The increasing prevalence of applications with memory footprints over terabytes in size, coupled with the rising popularity of tiered and disaggregated memory systems has generated an urgent need for memory access telemetry that scales well with working set size. We observe that telemetry techniques used in prior work have shortcomings that make them unsuitable for terabyte-scale workloads. We present our key insight that exploits the RADIX-tree structure of the page table to enable fast, precise, and accurate telemetry that works even for terabyte-scale applications at low performance overheads.
We leverage this insight in Telescope [9], a novel method to profile memory access patterns of applications. We implement Telescope in the Linux kernel. Our evaluation reveals that Telescope consistently delivers over 90% accuracy and coverage at just 0.9% CPU utilization for workloads with a memory footprint of 5TB, while data tiering (placement into memory tiers) guided by Telescope offers 5.6% to 34% extra throughput over other state-of-the-art approaches on workloads with up to 2TB of memory footprint.

Datacenter workloads memory requirements have skyrocketed in recent times. This rise has been fueled by many application domains, including Large Language Models, High-Performance Computing, and large databases. Application datasets commonly exceed terabytes in size [7,8]. Furthermore, these applications prefer to keep their working sets in memory to maximize performance. This trend has been enabled by the emergence of tiered and disaggregated memory systems. Various memory technologies are integrated horizontally and/or vertically to get terabytes of physical memory on a single system. On a tiered memory system, memory is populated in various tiers. The hot tiers are placed closer to the processor-and-cache hierarchy and are composed of technologies that offer high bandwidth and low access latency, such as DDR-attached memory, or High Bandwidth Memory (HBM). The cold tiers are farther away from the processor-and-cache hierarchy and are made of technologies that offer less bandwidth and higher latency, such as Persistent Memory, and CXL-attached memory. Overall, tiered memory systems promise vastly high memory capacity at low performance overheads.
However, the tiering is only as good as the telemetry. Telemetry refers to the active profiling and identification of the memory access patterns of a target workload. On a tiered memory system, data placement must be guided by accurate telemetry, so that the hot data, or the data that is expected to be used soon in the future, gets placed in the hot memory tiers, while the cold data, or the data that is not expected to be used in the near future, stays in the cold memory tiers. The telemetry technique should identify the hot data with precision, ideally at the granularity of the page size. Further, the technique must be fast and scalable to terabytes of memory footprint. Lastly, the performance overheads associated with the technique must be minimal.
Data placement must be guided by accurate telemetry, so that the hot data gets placed in the hot memory tiers, and the cold data stays in the cold memory tiers.
Telemetry techniques used in prior work fall under 3 categories.
Linear Scanning of Page Table Entries (PTEs) is a common technique to track workload access patterns. Each PTE contains the physical frame number of the indexed page, and some status bits. These status bits include an ACCESSED bit. On every Page Table Walk, the hardware page table walker sets the ACCESSED bit in the PTE. Thus, checking this bit in a PTE is enough to ascertain whether the page was accessed since it was mapped, or since the last time when the bit was reset.
In this telemetry, all the mapped PTEs of a workload are scanned periodically by a thread. The thread is awoken every few milliseconds to perform a scan, completing which, it goes back to sleep. During each scan, the PTEs’ ACCESSED bits are checked, and then reset, cleared so that they may be set by the page table walker on the next access. Therefore, on each scan, the thread identifies the pages that were accessed via a page walk since the last scan. This telemetry technique is used by various tools in the Linux kernel such as kstaled and MGLRU (Multi-Generation LRU lists) [3].
This technique, though simple, does not scale well as the number of PTEs used by an application becomes large. We find that even with nearly 50% CPU utilization, over 20 seconds are needed to complete one full linear scan of all the PTEs belonging to an application with a memory footprint of 1TB.
Region-Based Sampling is an enhancement over the linear-scanning technique, that quickens the convergence time by reducing the number of PTEs to scan. The mapped address space of a workload is divided into contiguous regions. Each region maintains its own access counter. One PTE is sampled from each region. Every few milliseconds, the sampled PTEs are checked to see if their ACCESSED bits are set. If so, the access counter is updated for the corresponding region. Then a new PTE is sampled from each region for the next round. About every 100 sampling rounds, regions are split or merged, based on their access counts. This repeated split-and-merge paradigm ensures that over time (typically in a few seconds for a gigabytes-large working set), the region boundaries and their corresponding access counts can be used to classify data into hot and cold sets. The most well-known example of a tool that uses region-based sampling is DAMON [4] which is now a part of the Linux kernel.
Our experiments reveal that DAMON is utterly ineffective when the target application’s working set exceeds 100 GBs of 4 KB pages. This is because when the number of pages per region is quite high, the likelihood that the access pattern of a sampled page accurately reflects that of its entire region is quite low. Increasing the number of regions reintroduces the same sluggishness and resource utilization overheads that afflict techniques based on linearly scanning PTEs.
Performance Monitoring Unit (PMU) counters are hardware counters present in some architectures that can count events such as Last Level Cache (LLC) misses, Translation Lookaside Buffer (TLB) misses, and so on. When the counter overflows, an interrupt gets triggered which writes the hardware state to a memory buffer. Prior works [1,5,6] have used event samples collected via PMU counters to identify hot and cold data. An example of this is Intel’s Processor Event-Based Sampling (PEBS).
The main drawback of this approach when used on terabyte-scale applications is the associated performance degradation. Accurately profiling memory access patterns necessitates a high sampling rate, and consequently many interrupts. This may result in significant slowdowns in the target application.
Here we present some key background followed by the insight behind Telescope, our novel memory access telemetry technique. We then discuss its design and implementation details.
The Radix-Tree Structure of the Page Table
Virtual memory is implemented via a data structure called the page table which must be searched (or ‘walked’) to find the physical page address given a virtual address. Most architectures implement the page table as a multi-level radix tree of PTEs. On a 64-bit x86 machine, the page table can have 4 or 5 levels, with 512 PTEs packed into a page.
On a TLB miss, the hardware page table walker reads PTEs from each level of the page table from the highest to lowest level to reach the physical page pointed by a virtual address, by treating chunks of the virtual address as offsets to index into the next level PTE. This mechanism is depicted in Figure 2. For each PTE in higher levels of the page table, the page table walker reads the address of the next-lower PTE, and updates the status bits (including the ACCESSED bits), and then reads the next-level PTE.
One corollary of the above mechanism is that if the ACCESSED bit is not set in a PTE at the higher level, then none of the PTEs in the levels beneath, which are indexed by that PTE, will have that bit set. Therefore, on a system which packs 512 PTEs into a page, if we check the ACCESSED bit at the second level of the page table, the total number of PTEs to be scanned to cover the entire mapped address space reduces by 512x relative to the case where the scanning happened at the first (or the lowest) level. The spatial granularity at which accesses to data are detected also becomes coarser by 512x. Similarly, at the (n+1)th level, the number of PTEs to be scanned is 512n times less, and the granularity at which accesses to data are detected is 512n times more, compared to scanning at the lowest level of the page table. This is the key insight that drives the design of Telescope.

Telescope Design
We use the above insight to augment region-based sampling. For a large region, tracking the ACCESSED bits at a higher level of the page table allows quicker convergence and better coverage. For a small region, tracking the bits at a lower level of the page table allows for precise convergence. By dynamically adjusting the level of the page table where the PTE’s ACCESSED bit is tracked (called the ‘profiling level’), our novel approach Telescope, can ‘zoom’ out of and into the address space by profiling at higher and lower levels, respectively.
Profiling
For each region, every sampling period (typically a few milliseconds), we sample an address at random. We identify the highest level of the page table where the area covered by the PTE corresponding to this address falls within the bounds of the region. Each time we find that the ACCESSED bit was set, we update the region’s access count. If there are 512 PTEs per page, a set ACCESSED bit at a lower level begets an access counter increment that is 512 times the increment corresponding to the next higher level.
Figure 3 shows an example of how this works. For Sampled Address 1, the corresponding L1 PTE is the highest PTE whose covered area falls within the region bounds. Similarly, for Sampled Address 2, the profiling level is L2.

Region Management
To converge to the correct access pattern, Telescope must ensure that region boundaries get finer over time.
Telescope’s region management is inspired by that of DAMON. Initially, the workload’s Virtual Memory Areas (VMAs) are scanned to obtain the initial set of regions. This is done every few seconds to capture new memory allocations. Before every region-update-interval (typically 100 milliseconds), DAMON splits each region into two smaller regions. After the region-update-interval, DAMON merges all adjacent regions with similar access counts.
We make the following changes to merging/splitting heuristic. If more than half a region’s size is covered by one PTE (at level n+1), then it must be split into smaller regions each covered by one PTE at level n of the page table. Else, the region must be broken into smaller regions each covered by one PTE at level n+1 of the page table. Similarly, a merge proceeds by applying the above split conditions in reverse order, provided the presence of adjacent smaller regions with similar access counts.
This algorithm ensures that regions with non-uniform access patterns within will stabilize over time, into smaller sub-regions that align with the boundaries of the actual access patterns. Telescope converges to the right access pattern over time, starting from a coarse granularity (a higher profiling level), and going to finer granularities (lower profiling levels) if needed.
Telescope starts profiling at higher levels with coarse granularity. As regions get smaller, Telescope profiles at lower levels with fine granularity.
Bounded and Flexible Variants
The scheme outlined above is the Bounded variant of Telescope. In addition, we present a Flexible variant that sacrifices accuracy for better coverage. In contrast to the Bounded variant, the Flexible variant can pick a PTE at a higher profiling level whose covered address space shoots over the region boundaries. The proportion of area covered by the PTE that falls outside the region boundary must be less than an error threshold. This error threshold can be configured independently at each level of the page table. The Flexible variant would be useful for simple access patterns with contiguous hot sets.
MGLRU + Telescope
Multi-Generational Least Recently Used (MGLRU) [3] is an algorithm implemented in the Linux kernel that uses linear-scanning-based telemetry to maintain multiple generation LRU lists instead of the typical ‘active’ and ‘inactive’ lists used in the classical OS implementation of LRU. Each MGLRU scan starts by creating a new generation LRU list. In every scan, frequently accessed or hot pages are moved to newer generations, while cold pages are “aged” to “old generation” LRU lists. Pages in the older generation LRU lists are considered for placement in the cold tier to reclaim space on the hot tier.
We augment MGLRU with Telescope’s profiling technique to make it effective for memory reclaim on terabyte-scale workloads.
Implementation
We implement Telescope in Linux v6.6.3. We reuse the logic introduced by DAMON, making changes wherever needed. Our patch is in the process of being pushed to the mainline Linux kernel [2].
We evaluated both the Bounded and Flexible variants of Telescope against DAMON and PEBS. We adjusted DAMON’s sampling intervals to 1ms and 5ms respectively, and PEBS’ event sampling frequency to 5kHz and 10kHz respectively, to create aggressive (more resource-intensive) and moderate (less resource-intensive) variants of both. We also evaluated MGLRU+Telescope against vanilla MGLRU.
Setup and Benchmarks
We used a tiered memory system with an Intel Xeon Gold 6238M CPU having 4 sockets, 22 cores per socket, and 2-Way HT for a total of 176 cores. It has a DRAM-based hot memory tier with 768 GB capacity and a cold memory tier with Intel’s Optane DC Persistent Memory Modules configured in flat mode (as volatile main memory) with 6 TB capacity for a total of 6.76 TB physical memory. The server runs Fedora 30 on Linux v5.18.19 with 4 KB pages. We used the Memcached and Redis key-value stores as benchmarks. On both, we ran two different load patterns, generated from Memtier and YCSB, respectively. The details of these are outlined in Table 1.
The workloads’ initial memory footprint was initialized in the Optane NVM cold tier using interleaved memory allocation policy. DAMON and Telescope output a list of regions and their access counts every 200ms which is also the region update interval. From PEBS, we collected samples of retired loads and stores every 200ms and converted them into a list of 2MB regions (2MB aligned), with access counts proportional to the number of samples that generate this address. We used 2MB as the region size as this has been used by prior work that utilizes PEBS [1]. We considered regions with 5 or more accesses in the last 120 secs as HOT. Hot regions with size 4GB or less were migrated from Optane to DRAM in descending order of access counts. Up to 10GB of data may be migrated in one round.
| Parameter | Memtier | YCSB |
|---|---|---|
| Memory Footprint | 1 TB | 2 TB |
| Number of Keys | 200,000 | 1,000,000 |
| Value Size | 5 MB | 2 MB |
| Number of Threads | 170 | 170 |
| Execution Time | 40 minutes (150 s warmup) | 40 minutes (150 s warmup) |
| Hot Data Distribution | Gaussian with Standard Deviation 100 | Hotspot (99% ops on 1% hot data) |
Results
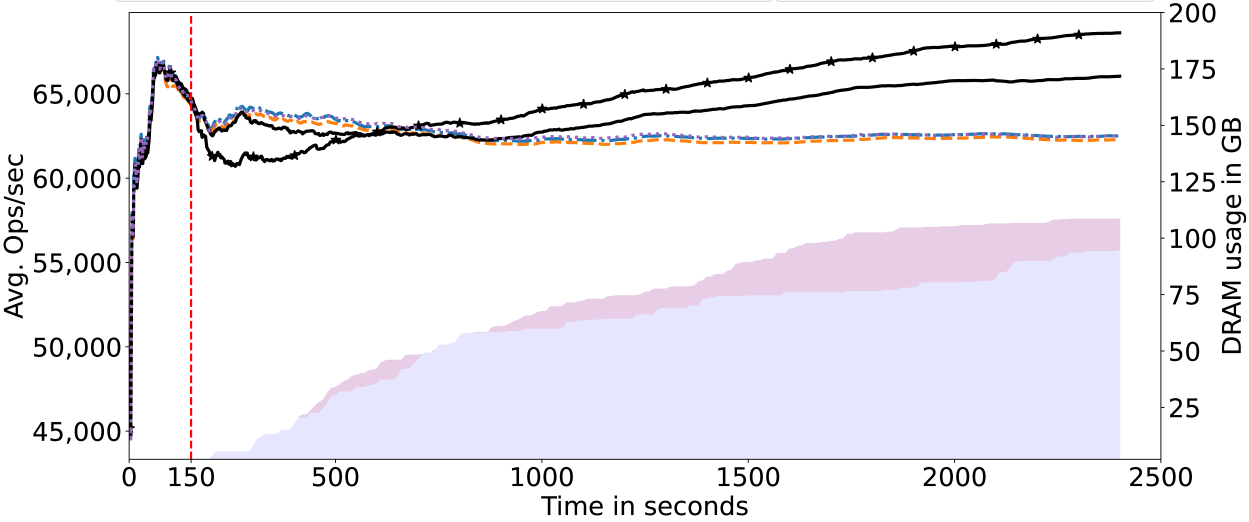
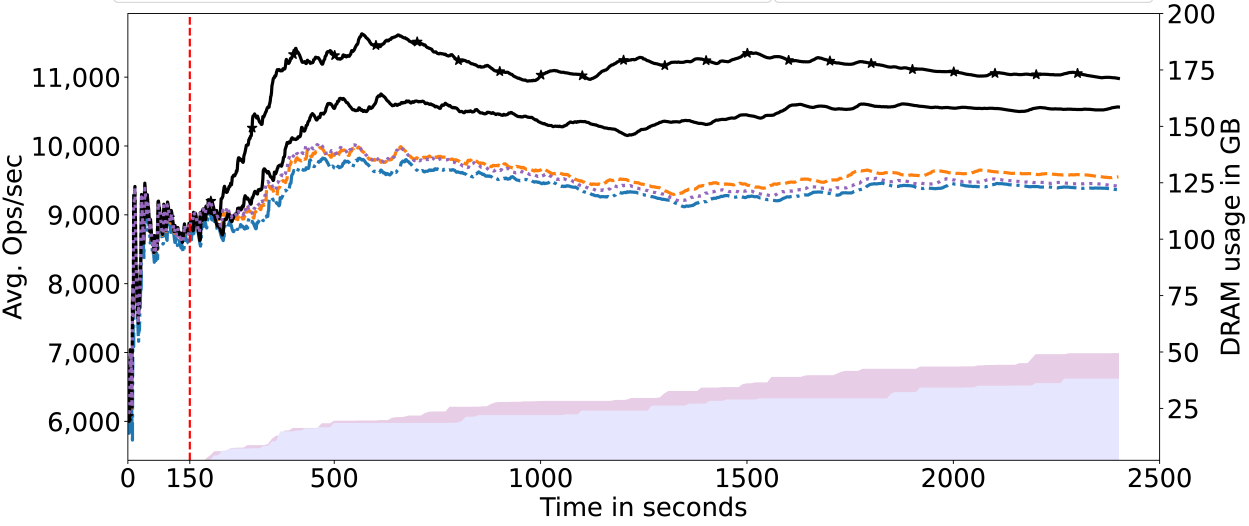
Figures 4-7 show throughput in ops/sec and the amount of data migrated to DRAM over time. Not only did DAMON fail to identify even a single hot data page, but the profiling overheads resulted in decreased throughput compared to the baseline (no telemetry). With PEBS, only a few gigabytes of hot data could be identified, resulting in marginal throughput improvements in some cases. We depict only one variant each of DAMON and PEBS because we fail to see any major difference in the results of the aggressive and moderate configurations.
We quantify the impact of the telemetry on the application’s performance by the 95th percentile latency among all requests. The results are shown in Table 2. We see that with Telescope, the tail latency is lower than with DAMON or with PMU counters.


| Application | Telemetry | 95th Percentile Latency (ms) | |
| YCSB | Memtier | ||
| Memcached | DAMON - Moderate | 881 | 11.2 |
| PEBS - Aggressive | 976 | 11.3 | |
| Telescope - Bounded | 867 | 10.8 | |
| Telescope - Flexible | 824 | 10.5 | |
| Redis | DAMON - Moderate | 850 | 59.13 |
| PEBS - Aggressive | 757 | 57.50 | |
| Telescope - Bounded | 696 | 54.01 | |
| Telescope - Flexible | 741 | 55.55 | |
MGLRU + Telescope
We evaluated classical MGLRU against our MGLRU+Telescope on a 2 socket Intel Xeon Gold 6354 with 72 cores and 1TB local (DDR-attached) DRAM, running Linux v6.5.0. We ran Memcached with Memtier load generator. Initially 976GB of data was initialized in DRAM. We ran MGLRU in parallel, and let it reclaim memory into a compressed in-memory zswap [10] pool, later repeating the experiment with MGLRU+Telescope.
Figure 8 shows how the Resident Set Size (RSS) of the workload changes with time in either case. Table 3 shows the overheads of both variants of MGLRU in terms of CPU cycles consumed, time taken to complete one full scan, and the impact on the throughput of Memcached. In every metric MGLRU+Telescope outperforms standalone MGLRU.

| Metric | MGLRU Standalone | MGLRU + Telescope |
|---|---|---|
| Scan Time (secs) | 14.57 | 12.77 |
| CPU cycles (billions) | 53.15 | 46.85 |
| Memcached ops/sec | 1 (normalized) | 1.08 |
The effectiveness of a terabyte-scale tiered memory system depends on precise and timely telemetry data to identify hot/cold pages. Telescope future-proofs telemetry for tiered memory systems with memory capacity up to and beyond the terabyte scale with a novel page table profiling technique.