


Next: Improvements from Route Control
Up: Experimental Results
Previous: Experimental Results
Figure 5:
Web server load profile: Average response time in ms,
per KB of the request, as a function of the average client arrival
rate at the server in our topology (Figure 4(b)).
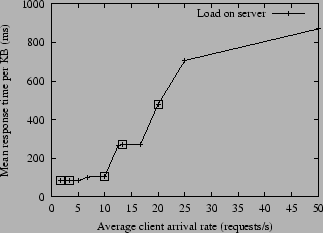 |
In Figure 5 we show the average response time per KB of
client requests (i.e., the completion time for a request divided by
the size of the request in KB), as a function of the average arrival
rate of clients at the server  (i.e.,
 requests/s). The response time quickly degrades beyond an arrival rate
of about 15 requests/s beyond which it increases only marginally with
the request rate. We select five different points on this load curve
(highlighted), corresponding to arrival rates of 1.7, 3.3, 10, 13.3
and 20 requests/s , and evaluate the proposed schemes under these
workloads. These workloads represent various stress levels on the
server , while also ensuring that it is not overloaded. The high
variability in response times in overload regimes might impact the
confidence or accuracy of our comparison of the proposed schemes.
requests/s). The response time quickly degrades beyond an arrival rate
of about 15 requests/s beyond which it increases only marginally with
the request rate. We select five different points on this load curve
(highlighted), corresponding to arrival rates of 1.7, 3.3, 10, 13.3
and 20 requests/s , and evaluate the proposed schemes under these
workloads. These workloads represent various stress levels on the
server , while also ensuring that it is not overloaded. The high
variability in response times in overload regimes might impact the
confidence or accuracy of our comparison of the proposed schemes.
In the remainder of the evaluation we focus on addressing the
following questions:
- To what extent do the route control schemes improve the
performance of the multihomed site, relative to using the single best
provider alone?
- Does employing historical samples help in better estimating
future provider performance?
- How do active and passive measurement schemes compare in terms
of the performance improvement they offer? Which of the two active
measurement schemes - SlidingWindow or FrequencyCounts -
works better?
- At what time intervals should samples for provider performance
be collected?
- What overheads do the proposed mechanisms incur?
Figure:
Performance improvement: The performance metric
 for the passive measurement scheme with EWMA parameter
 (no history employed) and sampling interval of 30s. The
graph also shows the performance from the three individual providers.
(no history employed) and sampling interval of 30s. The
graph also shows the performance from the three individual providers.
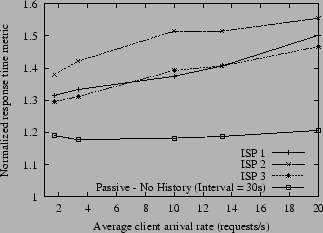 |
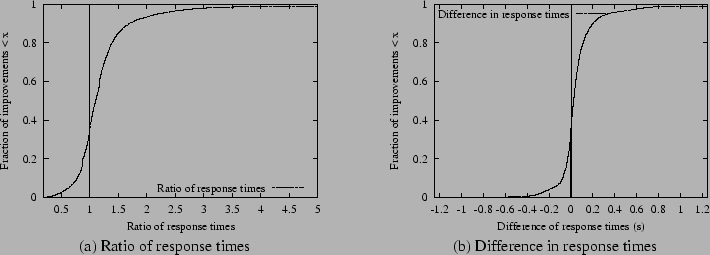
Figure 7:
Unrolling the averages: Ratio and the difference in the
response times from using just ISP 3 for all transfers relative to
using the passive measurement scheme. The average client arrival rate
in either case is 13.3 requests/s.
 |
Next: Improvements from Route Control
Up: Experimental Results
Previous: Experimental Results
Anees Shaikh
2004-05-05