| ||||||||||||||||||||||||||||||||||||||||||||||||||||
USENIX Technical Program - Paper - Proceedings of the USENIX Annual Technical Conference, January 6-10, 1997, Anaheim, California, USA
[Technical Program]
Observing the Effects of Multi-Zone Disks
Rodney Van Meter
Abstract:Current generations of hard disk drives use a technique known as zoned constant angular velocity (ZCAV), taking advantage of the geometry to increase total disk capacity by varying the number of disk sectors per track with the distance from the spindle. A side effect of this is that the transfer rate also varies with sector address. We analytically estimated and measured this effect on file system performance on a BSD Fast File System, showing a drop of roughly 25% in peak transfer rate depending on head position. We also show that, while ZCAV effects cannot be ignored, a simple linear model adequately estimates the performance from the few parameters normally available in disk drive spec sheets.
This research was sponsored by the Advanced Research Projects Agency under Contract No. DABT63-93-C-0062. Views and conclusions contained in this report are the authors' and should not be interpreted as representing the official opinion or policies, either expressed or implied, of ARPA, the U.S. Government, or any person or agency connected with them.
1 IntroductionMany magnetic disk drives use a technique known as zoned constant angular velocity (ZCAV), taking advantage of the geometry to increase total disk capacity by varying the number of disk sectors per track with the distance from the spindle. A side effect of this is that the transfer rate also varies with block address. Despite some excellent recent work on modeling the behavior of disk drives [10,14], the effects of ZCAV have generally not been taken into account in the design of file systems. Worthington et al [13] built a disk model which includes zone information, but the emphasis of their work is on disk scheduling algorithms to reduce latency, rather than improve throughput. Ghandeharizadeh has suggested [4] that file placement be adjusted based on access history to take advantage of ZCAV effects, but no work has measured the effects directly. The Microsoft Tiger Video Server [2] uses a simple placement algorithm in which primary data is placed on outer tracks and secondary (redundant, infrequently-accessed) data is placed on inner tracks. We estimated and measured the effect of ZCAV on file system performance on a BSD fast file system, showing a drop of roughly 25% in peak transfer rate depending on head position. We also show that, while ZCAV effects cannot be ignored, a simple linear model adequately estimates the performance from the few parameters normally available in disk drive spec sheets. The rest of the paper is organized as follows. ZCAV is explained in detail in section 2. In section 3 we extract the zoning information for the disk drive used in our experimental analysis. In the following section an analytic model for estimating ZCAV drive performance is presented. Then, our experimental setup is described, followed by our measured results and conclusions.
2 Zoned Constant Angular VelocityMagnetic disk drives consist of one or more rotating platters on a common spindle. Data is written and read by magnetic heads, generally one per surface (often with a spare surface, so that the number of heads is one less than twice the number of platters). A track is a concentric circle on one surface. The collection of tracks at the same distance from the spindle on each surface constitute a cylinder. A track consists of a number of sectors (occasionally called blocks), the smallest unit of data that can be read or written by the drive (typically 512 or 1024 bytes, but theoretically any number). The triple <cylinder,head,sector> uniquely defines a location on the drive. See [10,13] for good introductions to disk architecture. ZCAV is a technique adopted by hard disk manufacturers to increase the capacity of disk drives. Outer tracks, which are longer, contain more sectors than the shorter inner tracks. The cylinders are grouped into zones that all have the same number of sectors per track. Some manufacturers refer to this as Zoned Bit Recording, ZBR. It is referred to as notches or a notched drive in the Small Computer Systems Interface (SCSI) specification [1]. As a side effect of this, since the time per rotation is constant, the number of sectors read per second (and hence the transfer rate) is higher on outer tracks. The read and write electronics must be able to keep up with the higher data rates required. Compact disks (hence, CD-ROM) and old 400KB and 800KB Macintosh floppy drives achieved similar increases in density by varying the rotation speed to achieve constant linear velocity. For high-performance hard disk drives this is impractical, since each seek also means fighting high angular momentum to reach the correct speed, increasing the latency on seeks to an unacceptable level.
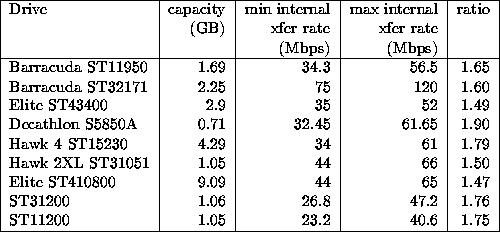
As table 1 shows The ST31200, for example, falls off from 47.2 to 26.8 Mbps, a drop of 43%. Thus, if the disk is operating mainly in the inner regions of the disk, performance can be expected to fall to just over half of the peak rate. Although not generally stated in the user manuals for the disk drives, empirical evidence indicates that the lower-numbered blocks (for a SCSI command set interface) are stored on the outer tracks. Note that these transfer rates are internal pre-format transfer rates; we will use this information to calculate the user data rate in the next section. Manufacturers sometimes report an ``average'' number of sectors per track for ZCAV disk drives. This number appears to be arrived at by totalling the number of sectors in the drive and dividing by the number of tracks. It does not attempt to reflect the fact that a higher percentage of the sectors are in tracks with more sectors. This average is useful for filling in the BSD disk format information (see the manual pages for fs and newfs), which retains the cylinder, head, sector model.
3 Determining Zone InformationSCSI is a commonly used interface for disk drives, and all of the drives we deal with in this paper have SCSI interfaces. At the SCSI command level, sectors are referred to by a logical block address, which the device controller maps to a physical location. Some information about the disk geometry is often available through the MODE SENSE Notch and Partition Page on SCSI disk drives. This page reports the number of notches. The two drives used for this paper, the ST31200 and the ST11200, both report 23 notches in this page. On some drives it is possible to read some information about each zone using MODE SELECT and MODE SENSE. However, not all drives implement this functionality. The ST31200 supports this, but the ST11200 does not. The ST31200 only reports the number of cylinders in a zone, however, not the number of sectors per track or the total number of sectors in the zone. More detailed information can be obtained by using SEND DIAGNOSTIC and RECEIVE DIAGNOSTIC with the TRANSLATE ADDRESS page. This provides the cylinder, head and sector number for each logical block, allowing easy determination of the number of sectors on a track, as well as two other important performance factors: the delay incurred by switching tracks and by switching cylinders, measured in sectors. It is interesting to note that on a Sparc 20/51 each address translation takes roughly 50 milliseconds, clearly at least one order of magnitude more than the actual translation requires. The reason for this delay is currently unknown. The intratrack instantaneous transfer rate can be determined by multiplying the number of bytes per track by the revolutions per second,
To find the sustained user rate for long transfers, this must be multiplied by the factor
where h is the number of heads (tracks per cylinder), s is the
sectors per track,
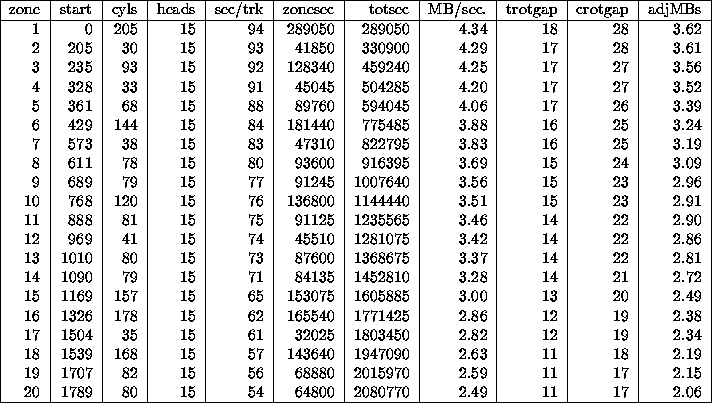
Table 2 gives the detailed zone information for the Seagate ST11200 used in these experiments. This data was obtained by a modified version of John DiMarco's scsiinfo, using a SEND DIAGNOSTIC/ RECEIVE DIAGNOSTIC RESULTS command pair with the TRANSLATE ADDRESS page for each block on the disk, then hand-extracting the zone boundaries. On disks that also support setting the active notch on the MODE SELECT Notch and Partition Page, it is possible to more directly extract the cylinder boundaries. The ST31200, for example, returns the notch size in cylinders, but not the total sectors in the notch. Determining the notch boundaries is also complicated by the track skew, sparing of sectors, and sector remaps. The capacity of each zone as listed does not take into account remapped or skipped sectors. In table 2, the first column is zone number, starting from the outer edge, in accordance with block numbering. start is the cylinder number for the start of the zone. cyls is the number of cylinders in the zone. heads, the number of data heads used, is constant for the whole disk drive. sec/trk is the number of sectors per track in the zone. zonesec, the total number of sectors in the zone, is the product of the prior three columns; totsec is a running total of the zonesec column. The columns in the table labeled trotgap and crotgap are the track and cylinder skew. MB/sec. is the intratrack transfer rate determined as above, and adjMBs is the rate adjusted by the track and cylinder skew, as above. As the table shows, the reduction in transfer rate caused by fewer sectors in a zone can sometimes be almost completely offset by a reduction in the track skew. Compared with the values of 23.2 to 40.6 Mbps internal transfer rates cited in the manufacturer's manual, the adjusted values are 29% lower, and represent reasonable ``not to exceed'' values for system transfer rates. It is also worth noting that the drive reports 23 notches on the notch and partition page, but only twenty were discernable from the logical to physical block map. The transfer rate is graphed in figure 1, which is explained in detail in section 4.
4 Analytic Approach to Estimating PerformanceIn this section, we consider three abstract examples, then analyze the disk drive used for the experiments. Transfer rates here are quoted in sectors per revolution; multiplying by revolutions per second and bytes per sector (both constants) would give bytes/second.
The first example is a hypothetical three-zoned disk drive. The outer
zone is 100 tracks of 175 sectors, the middle zone is 100 tracks of
137 sectors, and the inner zone is 100 tracks of 100 sectors. This is
overly simplistic but the ratios are common. The total capacity of the
drive is
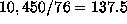
The ``average'' number of sectors per track is 137. If we assume that
each sector is accessed with equal frequency, the ``average'' transfer
rate is
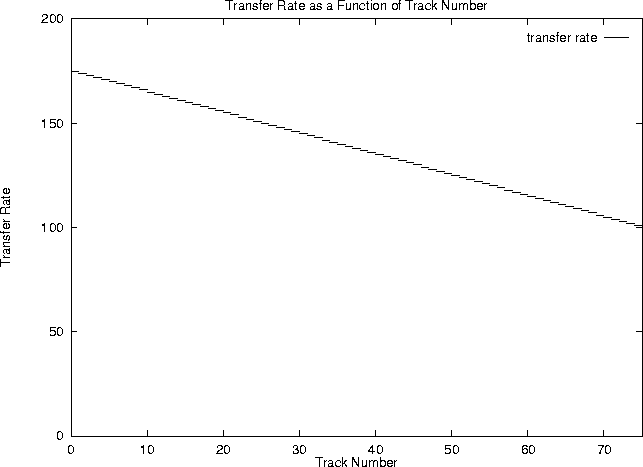
As a second example, consider a more finely-grained zoning. Let the disk drive consist of one track of 175 sectors, one of 174 sectors, etc. down to an inner track of 100 sectors, for a total capacity C of
where
sectors. The mean number of sectors per track is
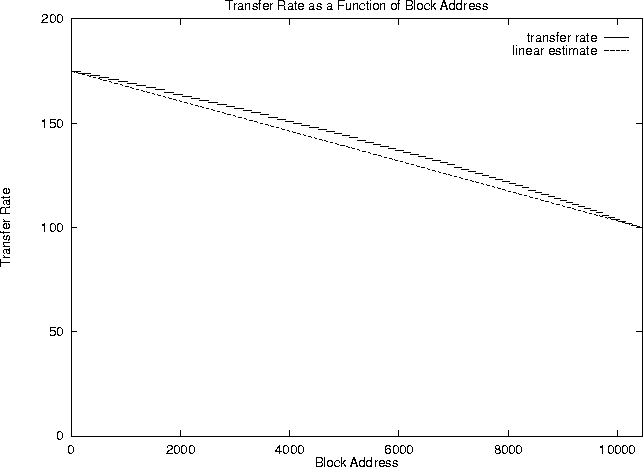
Figure 4 shows transfer rate versus track number. Figure
5 shows the transfer rate versus block address for this
example. Visually, it is nearly linear. A small
The median transfer rate
The ``average'' transfer rate, again assuming equal probability of access for each sector, would be the sum of the transfer rates for each of the individual blocks, divided by the total number of blocks:
This will not be equal to the ``average'' sectors per track reported by the manufacturer, times the rotations per second:
In our example 2, Figure 6 shows transfer rate versus block address for the Seagate ST31200, calculated based on the extracted zone information. It clearly shows the effects of more of the blocks being in the outer zones. The median transfer rate is 3.6 MB/sec, 10% higher than the 3.25 arrived at by averaging the max and min rates. The average transfer rate, assuming each sector has equal probability of being accessed, is 3.47, still 6% higher than 3.25. Again, the curve varies only slightly from linear.
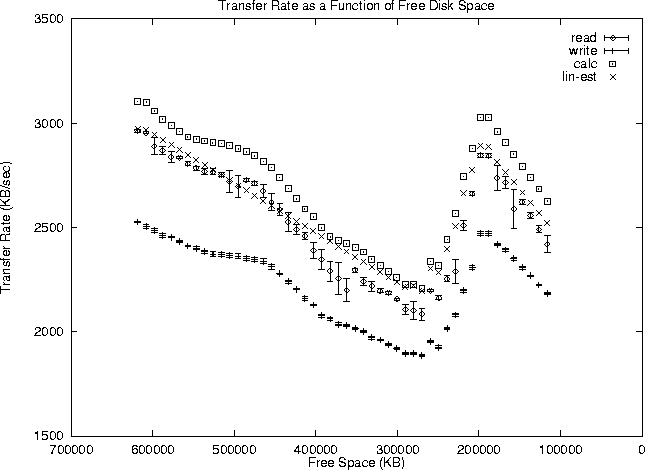
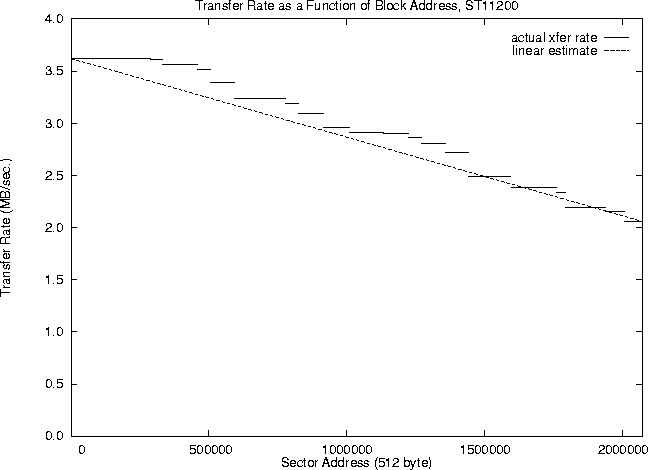
Figure 1 shows the transfer rate plotted against sector address for the ST11200 used for these experiments. A simple linear estimate is also plotted, running from the transfer rate at the outermost zone to the innermost zone. This shows a rough fit, with the maximum error from the true rate being approximately 8%. Thus, while far from perfect, this exceedingly simple model is significantly more accurate than assuming a fixed transfer rate, which may vary by 40%. In addition, this can be easily estimated from the data sheets typically supplied with disk drives. A recommended first-order estimate of transfer rate, simple enough to be implemented in a guaranteed-I/O-rate file system, would therefore be
where C is the disk capacity and
5 Experiment
5.1 Experimental SetupThese experiments were conducted on a Sparcstation 10 with 64 MB of main memory, and a 1.05 GB Seagate ST11200N disk drive. The actual bandwidth of this disk drive, as shown in table 2, varies from approximately 2.06 to 3.62 MB/sec., a factor of 1.75. Any read or write rate that exceeds that has clearly been the beneficiary of caching, either the file system's buffer cache or the disk drive's data block cache. According to the manual [11], this disk drive has 23 zones, or notches, and an average (mean) of 73 sectors per track, 15 heads, 1,872 cylinders for a total of 28,080 tracks. The drive rotates at 5,411 rpm. Write caching at the disk is disabled; all writes are synchronous. The file system is a SunOS UFS, essentially a BSD fast file system [5]. The partition used for these experiments begins at sector number 655,200 and extends 687MB to the end of the disk, as reported by dkinfo. Thus, according to table 2, the partition starts at a transfer rate of 3.24 MB/sec. and falls to 2.06, a drop of 36%. Unfortunately, due to hardware and disk partitioning limitations, it was not possible at the time this experiment was conducted to cover the entire span of a disk. The basic experiment runs a loop that executes a modified version of Tim Bray's bonnie to write a 100MB file, unmount the partition (to clear the cache and commit all modified metadata), then read the file back. Then the script records the Bonnie data file layout, deletes the file, writes a 10MB file to the system, and repeats. Thus, we have the results for 100MB written at 10MB intervals. The free space falls from approximately 610MB (user space available) to 105MB in 50 steps.
5.2 Experimental DataWhen measuring the effects of the ZCAV layout on file system performance, care must be taken as numerous other factors can contribute to changes in performance. They include:
Of course, the effect on performance will vary dramatically with the file system structure, which is generally operating-system specific; this is covered in the following section. Our data shows that the write rate varies by a factor of 1.33 (2528 KB/sec. v. 1900 KB/sec., a drop of 25%) depending on head position, even over the limited range of our experiments. Evaluating the reads is more difficult due to the high variability, but if we choose the means from the same data runs as the writes, we see a 23% drop, 3295 KB/sec. v. 2547 KB/sec. at, respectively, 608 and 270 MB free.
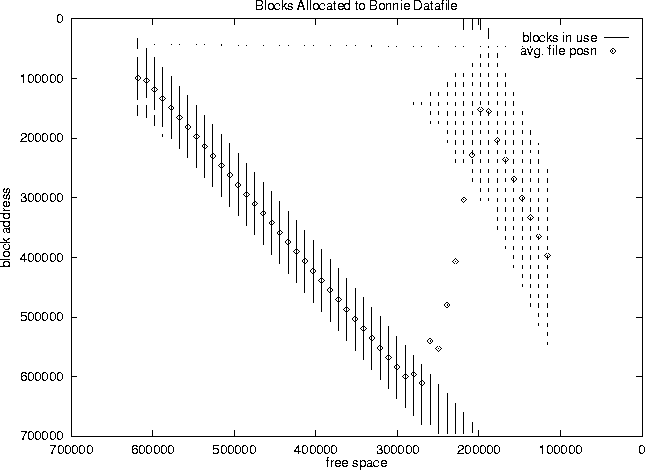
Figure 7 shows the mean of ten runs The write values are lower than the theoretical maximum due to inevitable missed rotations. Since the disk is not allowed to cache write data, typically at least one rotation must be missed at the end of each write request. Additionally, occasionally the file system writes some metadata to the drive, requiring a seek and write, with ensuing missed rotations. The measured values are fairly consistently approximately 80% of the calculated values, indicating approximately one missed rotation in five. Examining the layout for the data files created by the Bonnie benchmark (examined using a modified version of Keith Smith's fsblks utility), as shown in figure 8, confirms the hypothesis that transfer rate is related to head position, as well as providing an explanation for the upward turn near the right-hand edge. The 10 MB filler files are getting laid down with holes between them which go unused until the disk nears full. Returning to figure 7, the points labeled calc are calculated from run number 9, estimating the performance by integrating the transfer rate at each block in the file, using the transfer rates calculated for each zone in section 3. It clearly shows the same features (dips and peaks) as the write and read curves. The slight difference (approximately 5%) between the read curve and the calculated estimate is because the calculated estimate does not take into account real-world overheads for command processing and latency, and CPU time in the kernel and user process. This difference (for both read and write) will be system dependent and will have to be determined empirically. The points labeled lin-est are calculated using the linear estimate shown in equation 1. The largest difference from the more correctly calculated values is 7%. This error is significant, but the simplicity of this linear estimate (both in ease of determination and ease of use) may make it an acceptable substitute for detailed zone calculations. The apparent better agreement of the linear estimate than the more realistic calculation above is coincidence; the linear estimate slightly underestimates performance compared to the non-linear effects of block address and geometry as described in section 4. Note that near the disk spindle (where the curve in figure 7 dips at 280,000 KB free), the agreement between the block calculation and linear estimate is better, as we would expect.
Reviewing our concerns expressed at the top of this section, our data has good repeatability, especially on writes. The buffer cache issue has been addressed by clearing the cache via remounting the partition. Free space fragmentation proved to not be a problem. The CPU and other system components appear to be up to the task of fully utilizing the disk, clearly showing the ZCAV effects we expected.
6 Conclusions
6.1 Dependence on File System StructureOne of the interesting aspects of this work is how repeatable the data proved to be, especially for writes. This clearly demonstrated that the SunOS file allocation code depends on the current state only; the recent history of file creations and deletions does not alter future file system allocation decisions. Note that this does not mean that disk fragmentation is not a general problem, only that once large areas of disk have been cleared of files, the reuse of that area is optimal (or at least predictable).
McVoy showed that a UFS can achieve good write
performance [6] Other possible file system structures, such as SGI's XFS [12], may depend on more dynamic, and hence complex, data structures, and may therefore not allocate blocks as predictably. A log-based file system [9] or disk device [3] clearly will not, in their present forms, allocate blocks in a fashion amenable to improving throughput by careful choice of blocks.
6.2 Impact on File System Allocation PoliciesAs proposed by Ghandeharizadeh [4], the idea of including a measure of ZCAV effects into a dynamic file relocater is appealing. Such functionality could be included in a file system defragmenter, moving older, less-frequently-accessed files to lower-transfer-rate areas of the disk. It is clear that this effect needs to be taken into account for multimedia file systems and file systems (such as SGI's XFS [12] or Rangan's multimedia ropes [8]) that provide guaranteed throughput. However, to date these have all assumed disk bandwidth is fixed, rather than a function of block address. Larger files accessed in large chunks, for which transfer rate is likely to be more important, should be allocated to blocks at the outer edges (for a Seagate SCSI drive, the lower-numbered blocks). Small files obviously do not need to be placed in a high-transfer rate location, as their transfer time will be dominated by latency. Large files accessed in small I/O requests also will not take good advantage of the transfer rate. Determining which files will take advantage of this may require cooperation from applications, perhaps via some form of hints [7]. Incorporating knowledge of the drive's ZCAV nature into the cleaner for a log-structured file system may be useful. Data should be packed toward the spindle, so that the open area for upcoming log writes will get to use the outer, faster regions of the disk. This could be expected to improve the write performance of the LFS by 25% or more, at the expense of slower reads, in keeping with the LFS philosophy.
6.3 Future WorkObviously, we would like to try these experiments on a wider range of hardware and software platforms, especially different file systems. However, the point that performance varies with head position appears to have been adequately demonstrated. In particular, our work should be repeated with different families of disk drives from different manufacturers, to confirm both the hypothesis that ZCAV effects are user-visible, and the effectiveness of our proposed linear estimate. Ideally, a publicly-available bank of information on drive types and zone information should be created. As more drive developers adopt standard methods of determining the zone information, of course, determining this information at boot time or file system configuration time becomes more feasible.
6.4 ConclusionsWe have explained the underlying motivations behind ZCAV disk drives, and demonstrated that it does have an effect on file system performance for a BSD FFS. We have shown that it is possible, though somewhat tedious, to extract this information from at least some disk drives directly. We have proposed that a simple linear model relating transfer rate to block address should be adequate for most purposes. The measurable effect, at 23-25%, is less than the physical difference of 36% between the inner and outer disk edges of the tested partition, but still too large to ignore in performance-critical applications.
AcknowledgmentsThis work would have been substantially more tedious if not for the generosity of Keith Smith ( fsblks), John DiMarco ( scsiinfo) and Tim Bray ( bonnie) in making their code publicly available. John Heidemann, Ted Faber and Greg Finn provided useful technical and editorial suggestions. The anonymous referees and my shepherd, Bill Bolosky, improved the paper through their comments as well.
AvailabilityThe code used for these measurements and data obtained is available on the web at https://www.isi.edu/netstation/zcav/ or on the author's home page at https://www.isi.edu/~rdv/ or https://alumni.caltech.edu/~rdv/. The author may be contacted via email at rdv@isi.edu or rdv@alumni.caltech.edu.
About this document ...
Observing the Effects of Multi-Zone Disks
This document was generated using the LaTeX2HTML translator Version 95.1 (Fri Jan 20 1995) Copyright © 1993, 1994, Nikos Drakos, Computer Based Learning Unit, University of Leeds. The command line arguments were: The translation was initiated by Rodney D. Van Meter III on Tue Nov 12 15:00:06 PST 1996
Rodney D. Van Meter III Tue Nov 12 15:00:06 PST 1996 |
|
This paper was originally published in the USENIX Annual Technical Conference, January 6-10, 1997, Anaheim, California, USA
Last changed: 8 April 2002 ml |
|


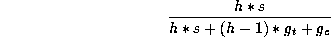
 is the track-switch skew (gap) (measured in
sectors) and
is the track-switch skew (gap) (measured in
sectors) and  is the cylinder-switch skew (also in sectors). When
reading continuously, the drive executes h-1 track switches plus one
cylinder switch, per cylinder read.
is the cylinder-switch skew (also in sectors). When
reading continuously, the drive executes h-1 track switches plus one
cylinder switch, per cylinder read.
 sectors. Roughly
42% of the sectors are in the outer zone, 33% in the middle zone,
and 24% in the inner zone. Figure
sectors. Roughly
42% of the sectors are in the outer zone, 33% in the middle zone,
and 24% in the inner zone. Figure 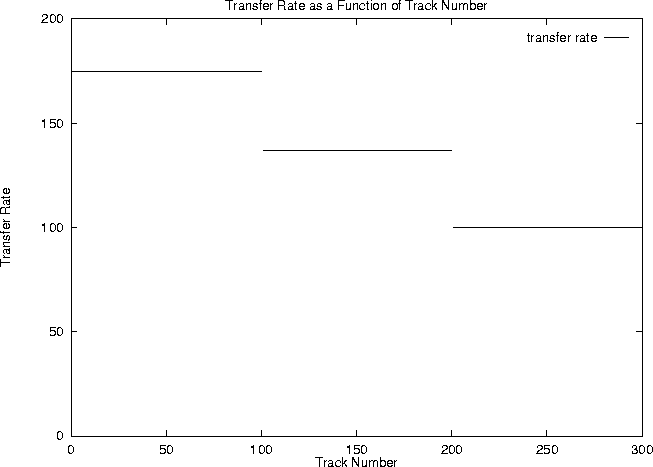
 , or 144
sectors/revolution, due to the higher probability of being in a
high-sectors-per-track zone. This effect alone leads to an error of
5% when estimating performance based solely on the mean number of
sectors per track.
, or 144
sectors/revolution, due to the higher probability of being in a
high-sectors-per-track zone. This effect alone leads to an error of
5% when estimating performance based solely on the mean number of
sectors per track.


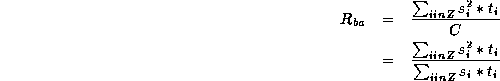
 is the number of sectors per track in zone i,
  is
the number of tracks in the zone, and Z is the set of zones. In this
case,
is
the number of tracks in the zone, and Z is the set of zones. In this
case,  and
and  , so this reduces to

 factor would be
expected to cause the transfer rate to fall off more quickly at higher
block numbers (fewer sectors per track mean fewer sectors per zone,
meaning the advance to yet-smaller zones accelerates), as shown in
figure
factor would be
expected to cause the transfer rate to fall off more quickly at higher
block numbers (fewer sectors per track mean fewer sectors per zone,
meaning the advance to yet-smaller zones accelerates), as shown in
figure  is the transfer rate of block
number
is the transfer rate of block
number  . In this case, block 5225 is on track 143, so it has a
transfer rate of 143, 4% higher than the mean sectors per track.
. In this case, block 5225 is on track 143, so it has a
transfer rate of 143, 4% higher than the mean sectors per track.

 simplifies to
  , a very modest
2.5% increase from simply assuming it to be the mean of the max and
min transfer rates. For all practical purposes, therefore, we can
estimate the mean transfer rate as the mean of min and max, when the
zoning is fine-grained and roughly linear with track number.
, a very modest
2.5% increase from simply assuming it to be the mean of the max and
min transfer rates. For all practical purposes, therefore, we can
estimate the mean transfer rate as the mean of min and max, when the
zoning is fine-grained and roughly linear with track number.


 and
and  are the
maximum and minimum internal transfer rates reported by the disk drive
manufacturer. The factor 0.7 comes from our observation in section
are the
maximum and minimum internal transfer rates reported by the disk drive
manufacturer. The factor 0.7 comes from our observation in section