We ran a benchmark to measure the bandwidth of reads and writes by multiple clients on a single disk with various file sizes. There were 6 clients in our experiments, each running on a separate machine. Each client opened one file at a time and sequentially read or wrote in 64 KB chunks. Each experiment lasted between 5 and 25 minutes. All the files were stored on the same disk, but no file was accessed by more than one client or more than once during each experiment. All files within an experiment have the same size, but size varies from 4 KB to 4 MB between experiments.
The larger the file size, the less open/close overhead is incurred per transferred byte. There is also overhead associated with capability-group invalidation; the benchmarks using file sizes of 4 KB and 16 KB accessed more than 10,000 files and hence triggered group invalidation.
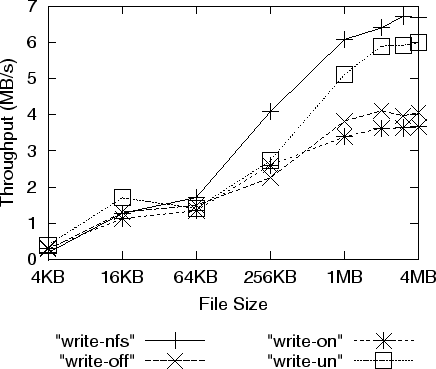 |
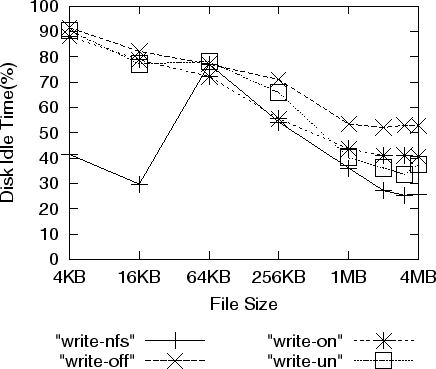
Figure 10 shows the system throughput as a function of file size for the write benchmarks. (The read benchmark results have similar trends and are not shown.) With file size 256 KB or less, the secure and non-secure setups have comparable bandwidth. With file sizes larger than 256 KB, the secure system performs up to 16% worse than the non-secure system. The difference is caused by CPU contention on the disk machine. Figure 11 shows the average percentage of idle time on the machine where the simulated NAD was hosted. The simulated disk controller in the secure setup consumes a considerable amount of cycles for MAC computation. Since it is implemented as a user-level process, it also consumes cycles for context switching and moving data across PCI buses and the kernel boundary.
We ran the same benchmark on an NFS server with a locally-attached disk (the NFS setup) for comparison. NFS performs comparably to Snapdragon (secure and non secure) for file sizes of 64 KB or less, and noticeably better for file sizes larger than 64 KB. This better performance is due to the NFS server's large data cache. Therefore, we ran the same benchmark again using the non-secure setup modified so that the simulated NADs can use as much cache as possible, up to the 128 MB physical memory capacity. The result is shown in Figures 10 and 11 as ``write-un''. The non-secure setup with no cache limit performed significantly better than the standard non-secure setup, which has only 2 MB of cache. This suggests that it would be worth increasing the data cache capacity in NADs (secure or non secure) in order to maximize bandwidth utilization for streaming I/O of large files by many concurrent users.
 |
The idle time of the NFS server (shown in Figure 11) is not monotonic because the NFS server is performing both metadata and I/O operations. As the file size increases, the rate of metadata operations decreases, but the I/O rate increases.
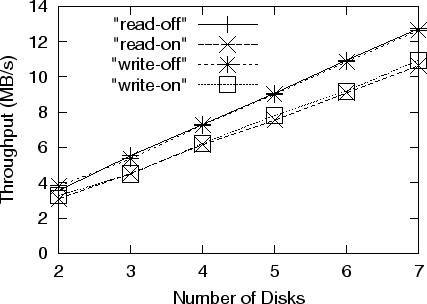
We also ran a benchmark to measure the aggregate throughput for various numbers of disks and clients. Due to the limited number of machines available for our experiments, we had to collocate a client with a simulated NAD controller on each machine. Each client sequentially read or wrote files on a NAD hosted by another machine and each NAD was accessed by exactly 1 client. We ran the benchmark with 2 through 7 such machines. The file size was 256 KB and each client accessed 600 files in each run. Figure 12 shows the aggregate bandwidth as a function of the number of disks.
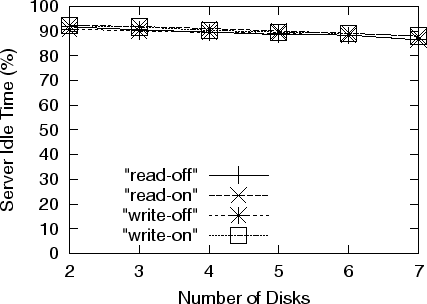
The results show that the aggregate read or write bandwidth of all clients scales linearly with the number of disks, which indicates that the metadata server imposes very low overhead to a high-bandwidth workload and has not become a bottleneck in a system with up to 7 disks. Figure 13 shows the average percentage of idle CPU time on the metadata server machine. The metadata-server machine was underloaded (i.e., 86-92% idle) in these experiments. Therefore, we expect it to be able to support a considerably larger number of disks. The throughput of the non-secure setup grew faster than that of the secure setup because the access control overhead, which is dominated by MAC computation, is proportional to the data bandwidth.