
Benchmarking can never produce an exact result because
complex systems exhibit inherent variability in their behavior.
The best we can do is to make a probabilistic claim about the
interval in which the ``true'' value for a metric lies based on
measurements from multiple independent trials [13].
Such a claim can be characterized by a confidence level and the
confidence interval at this confidence level.
For example, by
observing the mean response time ![]() at a test load
at a test load ![]() for
for ![]() independent
trials, we may be able to claim that we are
independent
trials, we may be able to claim that we are ![]() % confident (the confidence
level) that the correct value of
% confident (the confidence
level) that the correct value of ![]() for that
for that ![]() lies within the range
lies within the range
![]() (the confidence interval).
(the confidence interval).
Basic statistics tells us how to compute confidence intervals and levels from a
set of trials. For example, if the mean server response time ![]() from
from ![]() trials is
trials is
![]() , and standard deviation is
, and standard deviation is ![]() , then the confidence interval for
, then the confidence interval for
![]() at confidence level
at confidence level ![]() is given by:
is given by:
![]() is a reading from the table of standard normal distribution for
confidence level
is a reading from the table of standard normal distribution for
confidence level ![]() . If
. If ![]() , then we use Student's t distribution
instead after verifying that the
, then we use Student's t distribution
instead after verifying that the ![]() runs come from a normal
distribution [13].
runs come from a normal
distribution [13].
The tightness of the confidence interval captures the accuracy of the
true value of the metric.
A tighter bound implies that the mean response time
from a set of trials is closer to its true value.
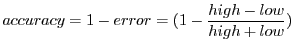
For a confidence
interval
![]() , we compute the percentage accuracy as:
, we compute the percentage accuracy as:
|
varun 2008-05-13
![\begin{algorithm}
% latex2html id marker 275
[t]
\caption{Mapping Response Surfa...
...he server to the saturation
state\;
}
\end{list}
\vspace{-3ex}
\end{algorithm}](img47.png)