
Overview
Figure 1:
Automated Workbench and Controller.
 |
Figure 1 depicts a framework for automated
server benchmarking. An
automated workbench controller directs benchmarking
experiments on a common hardware pool (workbench).
The controller incorporates policies that
decide which experiments to conduct and in what
order, based on the following considerations:
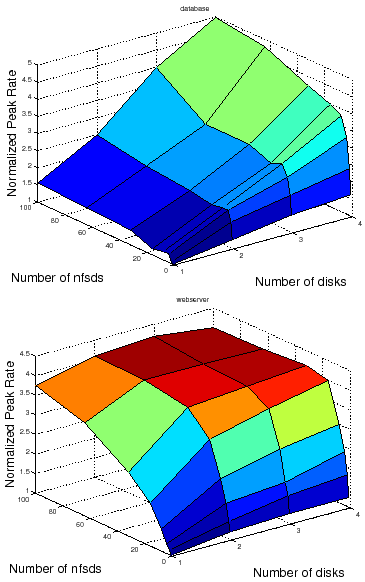
Figure 2:
These surfaces illustrate how the peak rate,  , changes with number of
disks and number of NFS daemon (nfsd) threads for two
canned fstress
workloads (DB_TP
and Web server) on Linux-based NFS servers.
The workloads for this example are described
in more detail later, in Table 3.
, changes with number of
disks and number of NFS daemon (nfsd) threads for two
canned fstress
workloads (DB_TP
and Web server) on Linux-based NFS servers.
The workloads for this example are described
in more detail later, in Table 3.
 |
- Objective. The controller pursues benchmarking objectives specified
by a user. A simple goal might be to obtain a standard NFSOPS rating for a
given NFS filer configuration. More complex goals might involve varying the
workload or mapping a response surface for different workloads or server
configurations. The goals may also specify the response time metric used to
obtain the peak rate, and/or thresholds for confidence and accuracy. An
objective that we consider is to obtain peak rates with 90% accuracy. An
alternative might be to obtain the most complete and/or accurate results
achievable within some deadline.
- Resources. The controller runs experiments as resources become
available. It may tailor the runs to the available resources or schedule
multiple runs concurrently.
- Previous results. The controller is feedback-driven in that it may
consider results of previous runs in designing new experiments. For example,
policies in this paper consider the variance of response times at a given test
load to determine how many trials are needed to obtain a sound
result. The controller can also use results of previous runs to prune the
sample space in mapping a response surface.
Table 1:
Some workload and configuration factors that affect NFS file server performance.
|
 |
read/write ratio, random/sequential ratio, metadata/data ratio, dataset size, file size distribution, directory structure, request mix |
 |
CPU speed, memory size, number of disks |
 |
Number of NFS server I/O daemons (nfsds), type of file system, block size |
|
We characterize the benchmark performance of a server by its peak rate or
saturation throughput, denoted . is the highest
request arrival rate  that does not drive the server into a saturation state. The server is said to be in a saturation state if a response
time metric exceeds a specified threshold, indicating that the offered load
has reached the maximum that the server
can process effectively.
that does not drive the server into a saturation state. The server is said to be in a saturation state if a response
time metric exceeds a specified threshold, indicating that the offered load
has reached the maximum that the server
can process effectively.
The performance of a server is a function of its workload, its configuration,
and the hardware resources allocated to it. Each of these may be characterized
by a vector of metrics or factors, as summarized in Table 1.
Workload . Workload factors define the properties of
the request mix and the data sets they operate on, and other workload
characteristics.
Configurations (). The controller may vary server
configuration parameters (e.g., buffer sizes, queue bounds,
concurrency levels) before it instantiates the
server for each run.
Resources . The controller can vary the amount of hardware
resources assigned to the system under test, depending on the capabilities
of the workbench testbed. The prototype can instantiate Xen virtual machines
sized along the memory, CPU, and I/O dimensions.
The experiments in this paper vary the workload and configuration
parameters on a fixed set of
Linux server configurations in the workbench.
Subsections
varun
2008-05-13