
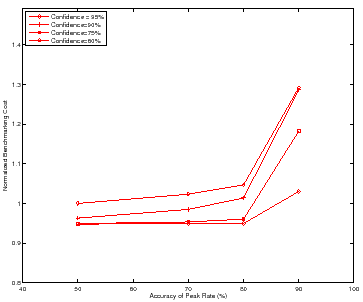
Figure 9 shows how the benchmarking methodology adapts the total benchmarking cost to the target confidence and accuracy of the peak rate. The figure shows the total benchmarking cost for mapping the response surface for the DB_TP using the Binsearch policy for different target confidence and accuracy values.
Higher target confidence and accuracy incurs higher benchmarking cost. At
![]() % accuracy, note the cost difference between the different confidence
levels. Other workloads and policies exhibit similar behavior, with Mail incurring a normalized benchmarking cost of
% accuracy, note the cost difference between the different confidence
levels. Other workloads and policies exhibit similar behavior, with Mail incurring a normalized benchmarking cost of ![]() at target accuracy of
at target accuracy of
![]() % and target confidence of
% and target confidence of ![]() %.
%.
 |
So far, we configure the target accuracy of the peak rate by configuring the
accuracy, ![]() , of the response time at the peak rate. The width parameter
, of the response time at the peak rate. The width parameter ![]() also controls the accuracy of the peak rate (Table 2) by
defining the peak rate region. For example,
also controls the accuracy of the peak rate (Table 2) by
defining the peak rate region. For example, ![]() % implies that if the mean
server response time at a test load is within
% implies that if the mean
server response time at a test load is within ![]() % of the threshold mean
server response time,
% of the threshold mean
server response time, ![]() , then the controller has found the peak rate. As
the region narrows, the target accuracy of the peak rate region increases. In
our experiments so far, we fix
, then the controller has found the peak rate. As
the region narrows, the target accuracy of the peak rate region increases. In
our experiments so far, we fix ![]() %.
%.
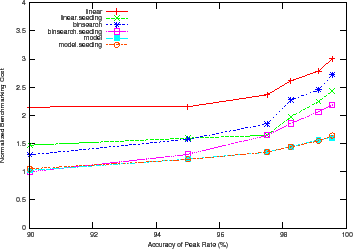
Figure 10 shows the benchmarking cost adapting to the target
accuracy of the peak rate region for different policies at a fixed target
confidence interval for DB_TP (![]() ) and fixed target accuracy of
the mean server response time at the peak rate (
) and fixed target accuracy of
the mean server response time at the peak rate (![]() %). The results for
other workloads are similar. All policies except the model-guided policy incur
the same benchmarking cost near or at the peak rate since all of them do binary
search around that region. Since a narrower peak rate region causes more trials
at or near load factor of
%). The results for
other workloads are similar. All policies except the model-guided policy incur
the same benchmarking cost near or at the peak rate since all of them do binary
search around that region. Since a narrower peak rate region causes more trials
at or near load factor of ![]() , the cost for these policies converge.
, the cost for these policies converge.
 |
varun 2008-05-13