  |
Bradley M. Duska, David Marwood, and Michael J. Feeley
Department of Computer Science
University of British Columbia
{bduska,marwood,feeley}@cs.ubc.ca
First published in ``Proceedings of the USENIX Symposium on Internet Technologies and Systems'', December 1997.
Also available as Technical Report TR-97-16.
The growing popularity of the World Wide Web is placing tremendous
demands on the Internet. A key strategy for scaling the Internet to
meet these increasing demands is to cache data near clients and thus
improve access latency and reduce network and server load.
Unfortunately, research in this area has been hampered by a poor
understanding of the locality and sharing characteristics of
Web-client accesses. The recent popularity of Web proxy servers
provides a unique opportunity to improve this understanding, because
a small number of proxy servers see accesses from thousands of clients.
This paper presents an analysis of access traces collected from seven
proxy servers deployed in various locations throughout the Internet.
The traces record a total of 47.4 million requests made by 23,700
clients over a twenty-one day period. We use a combination of static
analysis and trace-driven cache simulation to characterize the
locality and sharing properties of these accesses.
Our analysis shows that a 2- to 10-GB second-level cache yields hit
rates between 24% and 45% with 85% of these hits due to sharing
among different clients. Caches with more clients exhibit more
sharing and thus higher hit rates. Between 2% and 7% of accesses are
consistency misses to unmodified objects, using the Squid and CERN
proxy cache coherence protocols. Sharing is bimodal. Requests for
shared objects are divided evenly between objects that are narrowly
shared and those that are shared by many clients; widely shared
objects also tend to be shared by clients from unrelated traces.
The growing popularity of the World Wide Web is placing tremendous demands on the Internet and is increasing the importance that the Internet function effectively.
The scale problems facing the Web can be addressed on three fronts. The first is to scale Web servers to handle the increasing demands being placed on them. The second is to ensure that the Internet itself will scale by continuing to increase its capacity and by deploying new network technologies. The third is to focus on the clients: Web browsers and a hierarchy of proxy servers to which they may be connected.
Client-side solutions such as caching and prefetching are attractive because they improve the performance of both client and server. Caching, in particular, aids scaling by reducing the amount of data requested from servers and transferred through the network.
The potential benefit of client-side caching has drawn considerable research and practical attention. A general framework is emerging that organizes client-side caches as a hierarchy. At the bottom are Web browser caches. Browsers can be configured to direct requests to a nearby proxy server, which then provides the second level of caching; some proxy caches are themselves connected to a third-level cache. The highest-level cache is typically a cooperative cache that connects lower-level caches to each other so that a miss in one cache can be satisfied by one of its siblings. This cooperation can be achieved either by multicasting misses to siblings [7, 5, 17] or by maintaining a shared directory of cache contents [9, 18]. Caching can also be provided by geographically distributed caches to which servers push popular data [12].
The promise of client-side caching has been demonstrated by several research prototypes and by some large-scale experiments in higher-level Web caching [5]. To date, however, researchers have had little data about client access patterns on which to base their designs and with which to assess them. There are two main reasons for this lack of workload information. First, the nature of Web clients continues to change rapidly and thus workload characterization is a moving target. Second, until recently, there has been little machinery in place for collecting data from a significant sample of Web clients.
Workload characterization is important because caching and prefetching are techniques that exploit specific access properties to improve performance: temporal locality and sharing in the case of caching, and spatial locality in the case of prefetching. Filesystem research, for example, has relied heavily on studies of Unix filesystem workloads that show that files tend to be small, accessed sequentially from beginning to end, read more than written, and rarely shared concurrently [3, 1, 19].
Cache Size and Hit Rate First, what hit rate can we expect for a given cache configuration; that is, how does hit rate depend on the number of clients connected to the cache and how does the number of clients affect cache size?
Configuration of Cache Hierarchy Does a cache hierarchy make sense and if so, how many clients should be connected to each level, how many levels should there be, and how should higher-levels of the hierarchy be connected to each other?
Cache Coherence Is the coherence protocol currently used by most proxy caches (i.e., Squid [5] and CERN [14]) causing unnecessary cache misses?
Sharing How much sharing is there; are all Web objects shared equally; does sharing increase with the number of clients; and how does sharing within a group of clients (e.g., a company or a university) compare to sharing among unrelated clients?
| Trace | Collection Period | Number of Clients | Client ID Preserved | Requests (Millions) | Maximum Simulated Cache Size (GBs) |
| HAN | Jun 17 - Jul 7, 1997 | 1858 | full period | 5.28 | 14 |
| KOR | Apr 20 - May 10, 1997 | 2247 | full period | 3.19 | 8 |
| DEC | Aug 29 - Sep 18, 1996 | 16,663 | full period | 21.47 | unlimited |
| GMCC | Jun 4 - Jun 26, 1997 | 953 | full period | 1.36 | 4 |
| AU | Jun 4 - Jun 24, 1997 | 310 | one day | 1.86 | 6 |
| UU | May 1 - May 21, 1997 | 990 | full period | 1.59 | 4 |
| NLANR | Jun 3 - Jun 27, 1997 | 711 | one day | 12.65 | 8 |
Web proxies are found in most corporate organizations that use a firewall to protect their internal network from the vagaries of the Internet. To access the Web from within such a protected domain, Web browsers are configured to direct all outgoing Web-data requests to a designated proxy machine. The proxy forwards requests between the protected corporate network and the outside Internet.
A proxy can also act as a second-level Web cache (the Web browser being the first-level). In this configuration, proxies are becoming popular in unprotected environments such as universities due to caching benefits alone.
It is typically a simple matter to configure a proxy to record all object requests it receives from its client browsers. Access traces can also be collected from third-level proxies, whose clients are collections of second-level proxy servers. Third-level proxies were first suggested by the Harvest project [7].
Finally, we must ensure that any use of Web client access traces does not compromise user privacy. A client request includes the requesting host's IP address, which may identify the user, and the requested object's URL. Privacy concerns prohibit exposing information that identifies users with the objects they access. Our solution was to pre-process all traces used in our study to disguise the requesting host's IP address using a one-way function that permits us to compare two disguised addresses for equality while protecting user privacy.
Table 1 summarizes the traces, listing: the data collection period, the number of client hosts making requests, whether a client's disguise was preserved across days, the total number of requests, and the maximum simulated cache size. Every trace contains twenty-one days of Web access; some traces, however, have slightly longer collection periods because data was not available for all days in the period.
All of these organizations are using the Squid proxy server (and cache) [5], a derivative of the Harvest research system [7]. The DEC trace was collected by Digital using a specially instrumented cacheless version of Squid; the trace is available via anonymous ftp [21]. NLANR makes several traces available [8]; we selected the Silicon Valley trace, which includes caches from the San Francisco Bay area and from overseas. The KOR traces are from the gateway that connects Korea to the Internet. We used a modified version of this trace that excludes a large third-level cache, because second-level cache characteristics are more interesting to our study. The remaining traces are from proxies serving the general computing community of various colleges and universities.
The traces capture all Web user requests except those satisfied by browser caches or directed to the interal network thus bypassing the proxy. Each trace entry includes the request time, the disguised client IP address, and the requested object's URL and size. All traces but DEC also include the cache action taken by the cache (e.g., hit, miss, etc.). DEC, instead, includes the object's last-modified time as reported by the Web server that holds the object.
Unfortunately, the technique used to disguise client identity in the AU and NLANR traces does not preserve a unique disguise for a client for the entire collection period. Instead, in these two traces clients are assigned a new disguise every day. As a result, a client that makes requests on two different days appears to our simulator as if it were two different clients. We have taken a conservative approach to dealing with this limitation. The client count for AU and NLANR in Table 1 lists the maximum number of clients making requests on any given day, an underestimate of the actual number for the entire trace. In addition, we exclude AU and NLANR from our analysis of sharing presented in Section 3.4.
To simulate a different request rate, a trace is first reduced by extracting all of the requests made by a randomly-chosen subset of clients, such that the remaining clients produce the desired request rate.
To simulate a different cache size from the original proxy, SPA follows a simplified version of the replacement and coherence policies used by the Squid proxy-cache version 1.1 [5] and appropriately configured versions of CERN [14]. The replacement policy is a variant of LRU.
The cache coherence protocol assigns a time to live based on either a configurable portion of the last-modified time or a default if no value is supplied. Expired objects remain cached. When an expired object is requested, the proxy sends an if-modified-since request to the server and receives a new copy from the server only if the object was actually modified. The results of certain requests such as dynamic scripts (e.g., cgi) and Web query forms are never cached.
For all but the DEC trace, SPA infers the time to live from the cache consistency operations of the original proxy. This inference is accurate only up to the cache size of the original proxy, because a larger SPA cache would hold objects not cached by the orginal proxy and thus the trace would contain no consistency information for these objects. The Maximum Simulated Cache Size in Table 1 shows the maximum size we simulated, a size not larger than the original proxy cache size.
Unlike the other traces, DEC includes the expiry and last-modified times returned by the server, which can be used directly to calculate time to live (i.e., no inference is necessary). Where these times are not supplied in the DEC trace, SPA sets the last-modified time and time to live according to the default Squid cache coherence protocol.
We validated SPA by simulating each trace with a cache size equal to the proxy's actual size. We then compared the simulated and actual hit rates and byte hit rates. DEC was excluded, because its proxy did not include a cache. In every case, the simulated hit rates were slightly lower than the actual hit rates; the average error was 3% (i.e., a hit rate difference of around 1.5%) and all errors were less than 4.5%. We believe the reason for the slight discrepancy is that the actual proxy caches were slightly larger than what we simulated.
We validated our trace-reduction scheme in two ways. First, we compared each reduction's per-client request rate to confirm that reducing a trace did not significantly change per-client request rate; average variance was 5% and maximum was 16%. Second, we measured the hit-rate variance among different versions of the same reduction, by computing 30 versions of the 5% GMCC reduction (i.e., each had a request rate that was 5% of the original). We simulated the 30 reduced traces and measured standard deviations of 1.9% hit rate and of 3.6% byte hit rate, even though each of the 30 reductions included a different randomly-chosen subset of the original client population.
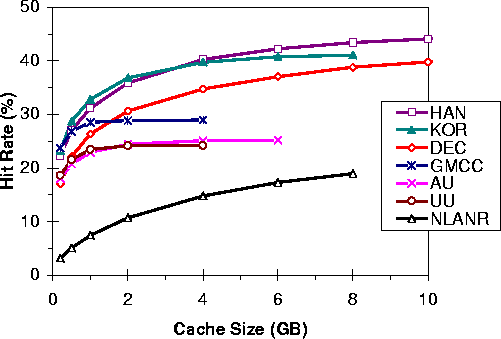
Figure 1 shows each trace's simulated hit rate as cache size is varied; hit rate is the ratio of cache hits to total requests. A trace's line on the graph stops at its maximum simulated cache size.
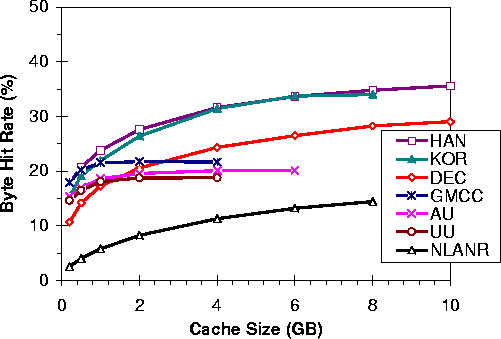
Figure 2 shows the byte hit rate for the same simulations; byte hit rate is the ratio of the total number of bytes supplied by the cache to the total number of bytes requested. The two graphs have the same shape but hit rates are roughly one third larger than byte hit rates, because smaller objects tend to have a slightly higher hit rate than larger objects.
Figure 1 shows that the hit rate of the NLANR third-level cache is considerably lower than that of the second-level caches. This lower hit rate is expected and is a common feature of higher-level disk caches [23]. The lower-levels of a cache hierarchy act as a filter, removing temporal locality and lower-level sharing from the reference stream. The resulting references received by the higher-level cache consist only of the lower-level caches' capacity misses, consistency misses, and first-time requests (i.e., references to objects that have been evicted, have expired, or have never been requested). Nevertheless, the NLANR third-level cache achieves a non-trivial 19% hit rate.
The two figures also show that most of the second-level cache hit rates level off at cache sizes smaller than 10 GBs. Hit rates for DEC and HAN continue beyond the largest cache size shown in Figure 1. DEC hit rates reach 41.1% for a 20 GB cache and increase very slowly to 42.1% for a 100 GB cache. HAN hit rates increase slightly to 44.7% for a 14 GB cache. These graphs seem to indicate that the largest cache needed to eliminate most capacity misses is dictated by a cache's request rate. For smaller traces, a cache size of 1-GB per 35,000 requests/day is adequate and for the larger traces, 1-GB per 70,000 to 100,000 requests/day is needed. We will see in the next section, however, that the relationship between request rate and cache size is not quite this straightforward.
The correlation between request rate and hit rate, however, is not perfect. There are two exceptions. First, DEC has the highest request rate but its hit rate is slightly lower than HAN and KOR. Second, GMCC's request rate is lower than UU and AU, but its hit rate is higher. Furthermore, the relationship between request rate and hit rate is not linear, as is seen by KOR, AU, and HAN. KOR's request rate is 1.7 times higher than AU and 1.7 times lower than HAN, but KOR's hit rate is twice AU's and only slightly smaller than HAN's. We examine this relationship in greater detail throughout the remainder of this section.
To conduct this experiment, we produced a set of seven reduced traces for each of the original traces at 5%, 10%, 20%, 40%, 60%, 80%, and 100% of the original request rate, as described in Section 2.3. We then simulated the behavior of each of the 49 reduced traces.
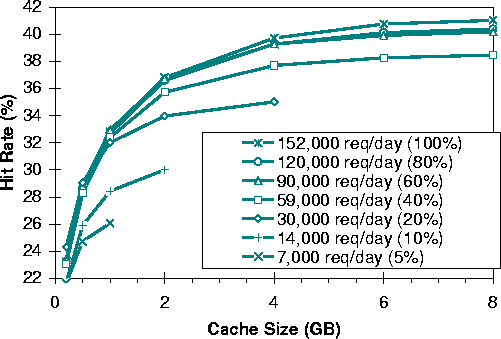
Figure 3 shows the hit rate for the seven KOR reductions as cache size is varied. The request rate of each reduction is shown in the legend. The top line of the graph, 152,000 requests/day, represents the full trace and is the same as the KOR line in Figure 1. The lines for lower request rates stop when the cache is big enough to hold every object referenced; increasing cache size beyond this point would have no impact on hit rate so we do not show the line.
For each KOR reduction in Figure 3, hit rate increases with request rate, just as we saw in Section 3.1 when comparing the request rates of different traces. The details of the two relationships, however, are somewhat different. Figure 3 shows that reducing KOR's request rate does not significantly reduce desired cache size. For example, the hit rates for the 60%, 80%, and 100% reductions all appear to level off at the same cache size, around 6 GBs. We believe that the reason cache size does not decrease as rapidly as hit rate is that clients in the same cache share common interests. As a result, a 40%-reduced client population requests virtually the same set of shared objects as the full population. This characteristics of Web sharing is discussed in detail in Section 3.4.
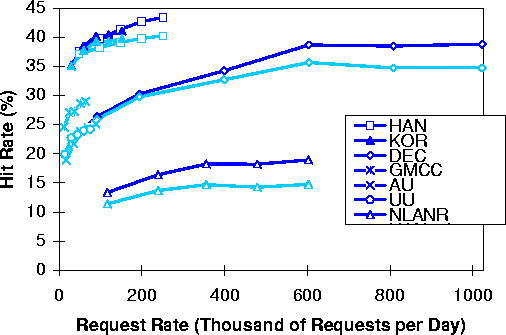
Figure 4 shows the relationship between hit rate and request rate for all traces. For each trace we show hit rates for two size caches: 4-GB caches are shown using light-colored lines and 8-GB caches are shown with dark lines. Some traces do not have an 8-GB line, because their maximum simulated cache size is less than 8-GBs. This graph confirms that, like KOR, hit rate increases with request rate for all traces. Notice that in the 4-GB DEC run, hit rate decreases slightly with request rate due to thrashing.
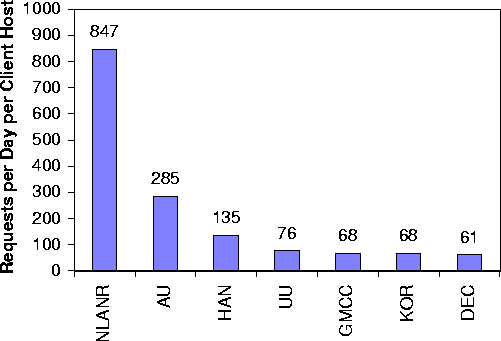
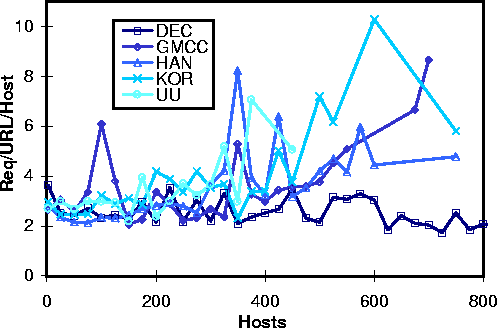
Figure 5 shows the average number of requests/day per client for each trace. These averages were computed by dividing each trace's request count by its total number of clients and then dividing by twenty one. The client counts for NLANR and AU shown in Table 1 are underestimated, because client disguises change from day to day, as discussed in Section 2.2. As a result, the values presented in Figure 5 for these two traces are upper bounds.
From Figure 5 we see that, for most of the second-level caches, clients made an average of 70 requests/day. AU and HAN have higher request rates, possibly because they have more multi-user hosts than the other traces. As expected, clients of the NLANR third-level cache have a much higher request rate than the second level caches (i.e., 847 request/day), because these clients are other caches and not browsers.

Figure 6 restates Figure 4, changing the x-axis from request rate to client count; the DEC line on this graph would extend to 16,700 clients. Notice that the shape of some of the lines has changed from Figure 4 to 6 due to the variety in the per-client request rates from different traces. The differences between these two graphs suggest that while client-count information is interesting, request rate is a better metric of cache performance.
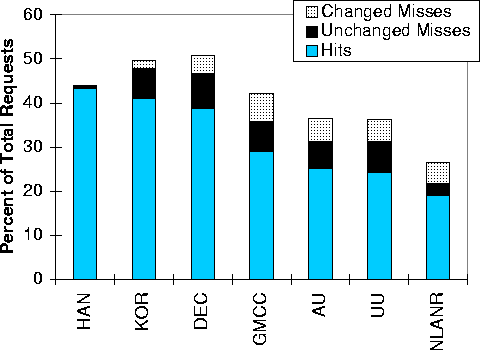
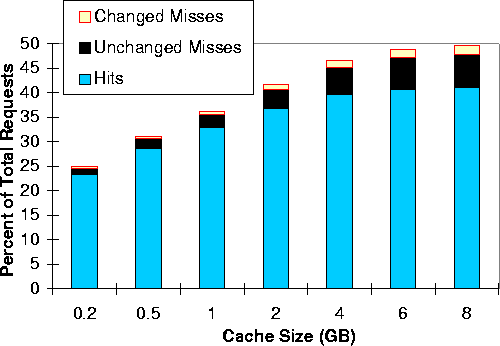
Figure 7 shows each trace's maximum hit rate from Figure 1 with two additional bars, one labeled Unchanged Misses and the other Changed Misses. The total of these two bars is the consistency miss rate (i.e., the percentage of requests that found expired objects in the cache). An unchanged miss is a request for an expired but unmodified cached object. In this case, the coherence protocol requires an if-modified-since request to the object's server to verify that the object is still valid and to update its expiry time. In contrast, a changed miss is a request for a cached object that had changed at the Web server.
The height of the Unchanged Misses bar is a measure of the inefficiency of the coherence protocol. This protocol uses the time since an object was last modified to predict its next modification time and thus set an expiry time for the object. If an object expires before it actually changes, an unchanged miss results. Figure 7 shows that unchanged misses account for between 2% and 7% of all references. This percentage represents the hit rate improvement possible for coherence protocols that do a better job of predicting object expiry (e.g., [13] proposes one such protocol).
Figure 8 shows the same information as Figure 7 for the KOR trace and a variety of cache sizes. We now see that as cache size increases, the consistency miss rate grows much more quickly than hit rate. This faster growth is explained by the fact that a larger cache holds more expired objects and thus some capacity misses of a smaller cache become consistency misses in the larger cache.
All simulation results presented in this section use the maximum cache size for each trace as shown in Table 1, or 8 GB for DEC.
A fundamental limitation of the available trace data is that requests are identified with client hosts and not with users. Our analysis thus includes some false sharing (i.e., due to users who move from host to host) and missed sharing (i.e., due to hosts that serve multiple users).
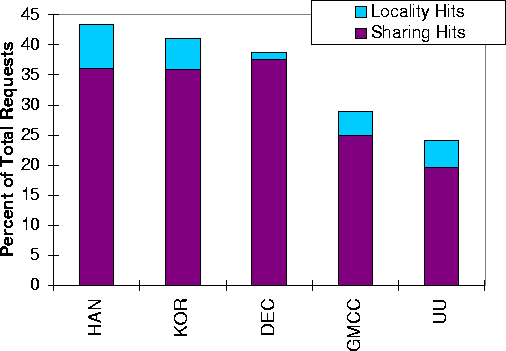
Figure 9 shows the hit rates from Figure 1 divided into Locality Hits and Sharing Hits. The figure includes data for only five of the seven traces. NLANR and AU are excluded because the daily changing of client disguise in these traces makes it impossible to distinguish sharing from locality, as discussed in Section 2.2.
The most important feature of Figure 9 is that sharing is high and increases with client population and request rate. In every trace, sharing accounts for at least 85% of all hits. Furthermore, traces with higher request rates also have more sharing. For example, DEC, the trace with the highest request rate, also has the highest sharing hit rate at 38%. Notice that sharing rate is more closely correlated with request rate than hit rate was; DEC's hit rate, for example, was not the highest of the traces.
In contrast, locality hits do not increase with request rate. All traces have roughly the same locality hit rate of 5% (the exception is DEC at 1.5%). In other words, clients from both small and large populations request roughly the same proportion of non-shared objects, even though there is more sharing in a large population. It thus appears that adding a new client to a cache turns some of the misses of other clients into hits but does not change locality hits into shared hits.
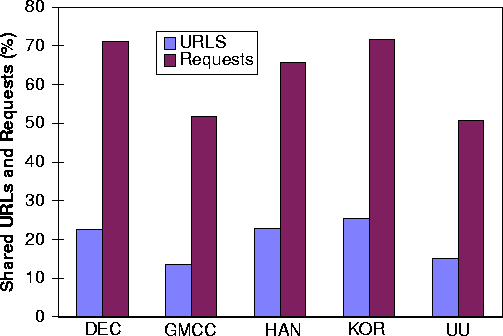
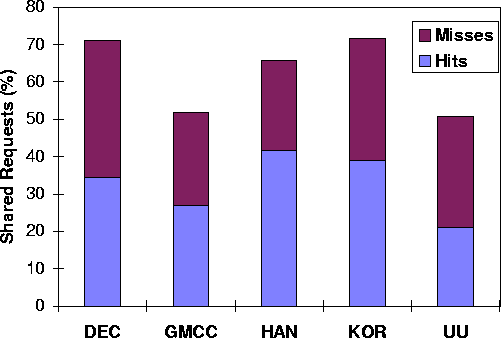
Figure 11 provides additional detail for the Shared Requests bar in Figure 10. The total height of each trace's request bar is the same in both figures. Figure 11, however, indicates the number of shared requests that hit in the simulated cache. The remainder of these requests are misses due to first-time accesses, consistency misses, and some capacity misses. In most cases, roughly half of the requests are hits, though HAN has slightly more hits than misses and UU has slightly less.
The key feature of Figure 10 is that while a very large portion of accesses are to shared objects (71% for DEC), only a small portion of objects are shared (23% for DEC). Notice further that the ratio between object count and request count is roughly the same for all traces, thought the actual sharing is lower for the smaller client populations.
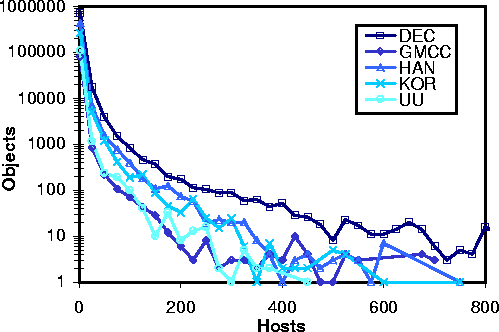
Figures 12 and 13 provide additional detail about how requests are distributed among shared objects. Figure 12 is a histogram of Web-object popularity. The y-axis indicates the number of objects (using log scale) and the x-axis indicates the number of hosts that share an object (using a bin size of 25). There is a line for each of the five traces. A point on a line indicates the number of objects that are requested by the specified number of hosts. For example, the graph shows that, in the UU trace, roughly 10 objects were requested by between 126 and 150 hosts.
Figure 12 shows three important features. First, most objects are accessed by a small number of hosts; the log scale of the y-axis somewhat hides this feature. Second, the distributions appear tail heavy, as has been observed by Cunha et al. [4]. For example, at around 150 to 200 hosts, the number of shared objects has dropped considerably; after that, however, the decline from 200 to 800 hosts is much more gradual. In fact, the line for DEC continues out to 4000 hosts and varies between zero and ten objects all the way out. Third, the object-popularity pattern for all traces is similar, though traces with higher reference counts have more widely shared objects, as expected.
Figure 13 graphs the normalized request rate for objects as a function of the number of hosts that share them. Notice that every object is summarized at the same x-axis point in both Figure 12 and 13. In Figure 13, however, the y-axis indicates the average per-host per-object request rate for objects with the specified degree of sharing. The important thing to notice about this graph is that a host's per-object request rate is mostly independent of an object's popularity, though very popular objects are requested at a higher rate; this is also true for DEC, which starts to trend upward toward six at around 2200 hosts (not shown in Figure 13).
To further understand the distribution of requests to shared objects, we conducted a series of experiments in which we looked for sharing patterns among clients from different traces. These comparisons are interesting because each trace represents a totally distinct collection of users. An object shared by users from multiple traces might be considered to be of global interest to Internet users in general. In contrast, objects shared only within a given trace are of only local interest to the particular user community. In addition, we mentioned above that some degree of false sharing occurs within a trace, because some users use multiple client hosts. False sharing, however, is eliminated when considering sharing among multiple traces.
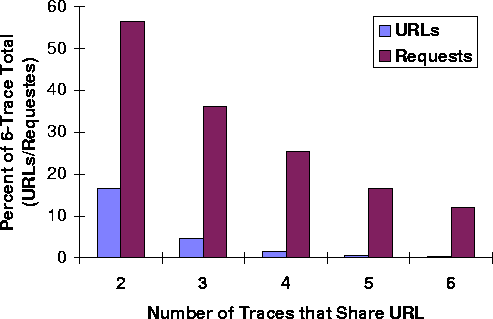
Figure 14 compares six traces: HAN, KOR, GMCC, AU, UU, and NLANR; DEC is excluded because its trace stores URLs using a hash code that can not be compared with the URL strings in other traces. There are five pairs of bars on the x-axis; of each pair, one bar shows shared objects and the other shows shared requests. Each pair of bars shows the amount of sharing that exists among the specified number of traces. For example, 18% of the total objects requested by the six traces are requested in at least two of the traces and 56% of total requests ask for one of these objects.
From Figure 14 we see that, as in Figure 10, the portion of requests that ask for shared objects is much larger than the portion of objects that are shared. Furthermore, we see that this gap widens as we look at sharing across more of the traces. For example, we see that only 0.2% of objects are shared by all six traces, but 16% of all of the requests ask for one of these objects. A second important observation is that a surprisingly large number of requests (16%) ask for objects that are globally shared among all six traces; recall, however, that not all of these requests will be cache hits.
Finally, we examine the nature of narrow and wide sharing. Figure 15 compares the inter-trace sharing for objects that are narrowly shared in one of the traces (i.e., requested by two to nine client hosts in that trace) and those that are widely shared in one of the traces (i.e., requested by at least ten clients); we also show objects that are only narrowly shared (i.e., narrowly shared in every trace in which they appear). This figure compares only four traces: HAN, KOR, GMCC, and UU; AU and NLANR are excluded because we can not distinguish sharing from locality, as described above. There are four sets of bars, each set with two bars for narrowly-shared objects, two bars for only-narrowly-shared objects, and two bars for widely-shared objects. As before, objects are counted only if they are requested from the number of traces specified under the bar on the x-axis (notice that this graph starts with one, while Figure 14 starts with two). An object that is narrowly shared in one trace and widely-shared in another trace counts as being both narrowly and widely shared, but not as only-narrowly shared.
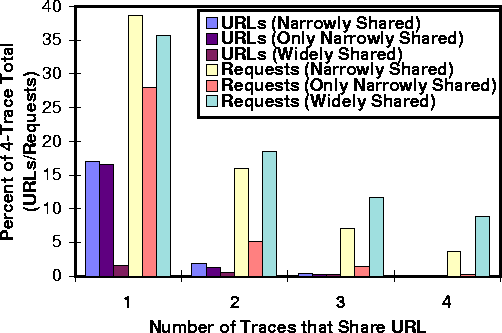
Figure 15 shows that Web sharing tends to be bimodal. First, notice that the one-trace bars on the far left of the figure show that sharing requests are divided almost evenly between narrowly- and widely-shared objects, while there are many more narrowly-shared objects than widely-shared objects. Furthermore, the other sets of bars show that a significant portion of widely-shared objects are also globally shared, while narrowly shared objects are almost exclusively locally shared. For example, for sharing among all four traces, only-narrow-sharing requests drop to 0.2% while wide-sharing requests remain relatively high at 9%; note that 4% of requests asked for objects that were both narrowly and widely shared (i.e., narrowly shared). We thus conclude that Web sharing tends to be divided roughly evenly between objects that are shared narrowly and locally and those that are shared widely, and that many widely-shared objects are also shared globally.
Our analysis shows that high hit rates depend on caches having sufficient clients to generate a high request rate. For example, a one-thousand client cache with 70,000 requests/day had a hit rate no higher than 28%, while a two-thousand client cache with 250,000 requests/day achieved a 45% hit rate. Furthermore, the NLANR third-level cache, whose requests are lower-level cache misses, had a hit rate of 19%. These two observations suggest that a client connected to a three-level hierarchy such as NLANR might see hits rates as high as 55% (i.e., the best hit rate of the second-level caches plus an additional 19% of that cache's misses).
The fact that sharing and hit rate increase with request rate might seem to argue for a monolithic cache structure consisting of a single-level cache designed to handle thousands or tens of thousands of clients. Latency and scalability concerns, however, argue for a more hierarchical structure.
A hierarchical structure allows caches to be placed closer to clients than does a monolithic structure, because the monolithic cache must be far enough away from clients to include the entire client pool. We have shown, however, that a relatively small group of one-thousand clients generates substantial sharing, with hit rates in the range of 25%. A more distant monolithic cache would increase request latency for the quarter of requests that could have been satisfied more locally.
A hierarchical structure also aids cache scalability. A substantial
request rate is needed to achieve the 55% hit rate that our
analysis indicates may be possible. For example, Table 1
shows that DEC has an average request rate of 12 requests/s. We have
also computed the request rate as a function of time for every trace.
This data shows that DEC has a peak request rate of 78 requests/s
and a peak miss rate of 55 misses/s;
miss rates is important because it determines
the impact a
cache has on its parent in the cache hierarchy. For comparison, the
proxy-cache performance study by Maltzahn and Richardson shows that
peak per-processor throughput of the Squid v1.1 proxy is less than 35
requests/s (when running on a Digital AlphaStation 250
4/266).![]()
We thus conclude that a hierarchical structure is the best solution for providing low-latency hits for local sharing, while achieving the substantial hit rates that are only achievable when thousands of clients share a cache.
More recent research has used simulators to vary individual parameters on large traces. Gribble and Brewer [11] simulate a trace with 20 million requests. They show a hit rate of 56% for a 6 GB cache. By comparison, our DEC and HAN traces see a 37% and 42% hit rate, respectively, for a 6 GB cache. Gadde et al. [9, 18] evaluate their proposed directory-based cooperative proxy cache using simulation of twenty-five days of the DEC trace. They see sharing hit rates of 45% for an 8 GB cache compared to our 38%, because their simulator does not model cache coherence.
Others have analyzed Web proxy traces for different purposes. In [15], Malzahn et al. compared the performance of the two most popular Web proxy servers (CERN [14] and Squid [5]). They show how the CPU, memory, and disk utilization of the proxy servers scales with increasing request rate.
Our analysis shows that cache hit rates for second-level caches vary from 24% to 45%. Sharing accounts for 85% of these hits and sharing increases with request rate. The hit rate of the third-level cache we examined was lower at 19%, because lower-level caches filter locality and lower-level sharing from its request stream.
Desired cache size varies between 2 and 10 GB. Small client populations need 1-GB of cache per 35,000 requests/day and larger populations 1-GB per 70,000 to 100,000 requests/day, though artificially removing clients from a population does not cause a proportional reduction in cache size.
Using the Squid v1.1 and CERN cache coherence protocol, between 2% and 7% of all requests are consistency misses to unmodified objects; that is these requests were hits on expired objects that had not actually changed at the Web server.
Requests to shared objects account for 71% of total requests, but only 24% of requested objects are shared. Most of these shared objects are accessed by only a few clients, though object popularity appears to be tail heavy and a few objects are accessed by most clients. Shared requests exhibit bimodality based on an even division of requests to objects shared narrowly by a few clients and objects shared widely by many clients. Unlike narrow sharing, wide sharing tends to be global. 6% of the total 11.7-million requests in HAN, KOR, GMCC, and UU, for example, ask for objects shared by all four traces.
Finally, our results argue for a cache hierarchy whose first level is close to clients; a one-thousand client cache should have hit rates of around 25%. One or more higher levels of caching are needed to expose the additional sharing present only in larger client populations (i.e., populations of a few thousand clients or more). For large populations, we have observed hit rates of 45% and, for the entire hierarchy, hit rates of 55% seem achievable.
We would like to thank everyone who provided us with proxy traces, particularly: Christian Grimm at the University of Hanover, Germany; Jaeyeon Jung with the Nation Wide Caching Project of Korea; Tom Kroeger, Jeff Mogul, and Carlos Maltzahn for making the DEC logs available; Tim Crisall at Grant MacEwan Community College, Alberta; Henny Bekker at Utrecht University, the Netherlands; Duane Wessels at NLANR; Maciej Kozinski at Nicolas Copernicus University, Poland; and our anonymous university. Thanks also to Norm Hutchinson and our shepard, Richard Golding, for their comments on earlier versions of this paper. Finally, thanks to the folks in the UBC system's lab for putting up with our long-running data-intensive simulations.
|
This paper was originally published in the
Proceedings of the Symposium on Internet Technologies and Systems,
Monterey, California December 8-11, 1997 Last changed: Nov 30, 1997 prowillen |
|