The experimental configuration consists of three geographically distributed clients and servers. The servers were located at Stanford University (Palo Alto, US west coast), University of Kentucky (Lexington, US east coast) and University of Saarbruecken (Saarbruecken, Germany). On each site we installed a Web++ server consisting of Sun's Java Web Server 1.1 extended with the Web++ servlet. The clients were located at University of California at Santa Barbara (Santa Barbara, US west coast), Bell Labs (Murray Hill, US east coast) and Charles University (Prague, Czech Republic). For the purpose of the experiment, we converted the Web++ client applet into an application and ran it under the JDK 1.0 Java interpreter 7. The parameter settings of our experimental configuration are shown in Figure 9.
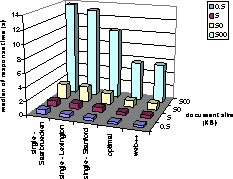
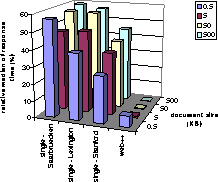
The workload on each client consisted of 500 GET requests for resources of a fixed size. We considered 0.5KB, 5KB, 50KB and 500KB files fully replicated on all three servers. The advantage of such a workload is that it allows us to study the benefits of replication in isolation for each resource size. It is also relatively straightforward to estimate the performance gains for a given workload mix (e.g. SPECweb96 [2]). Each client generated a new request only after receiving a response to a previously sent request. We executed the entire workload both during peak office hours (noon EST) and during evening hours (6pm EST). In each experiment we report the mean of response time measured across all requests sent by all clients.
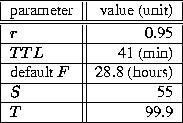
We compared the performance of our Web++ system with a system that uses only a single server (i.e. no resource replication) and an optimal system that sends three requests in parallel and waits for the first response. The parameters of our Web++ system (shown in Figure 10) were set based on the sensitivity study conducted in Section 4. In particular we set parameter r to 0.95 since values close to 1 lead to best prediction accuracy as shown in Figure 5. Time-to-live (TTL) was set to 41 minutes that corresponds to the average length of a (90,10)-stable periods as shown in Figure 6. The default value of F was set to 28.8 hours that corresponds to the mean time-to-repair for Internet servers as measured in [29]. We set the percentile S to 55 to keep the impact of the variance on server selection minimal (the purpose of variance is to only break ties for servers with similar average latency). Finally, we set the percentile T to 99.9 to minimize the number of false timeouts 8.
In contrast to the experiments in [35], in the experiments reported here we tested a complete system (Web++ clients and servers). Since we had a control over the server side, we were able to compare the HTTP request response times for resources of different pre-determined sizes. Finally, we also used three geographically distributed clients as opposed to a single client in [35]. On the other hand, all resources were replicated only on three servers (as opposed to five and fifty in [35]). This limitation was imposed on us by the number of accounts we could obtain for the purpose of the experiment.