![]()
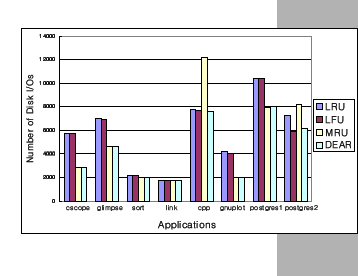
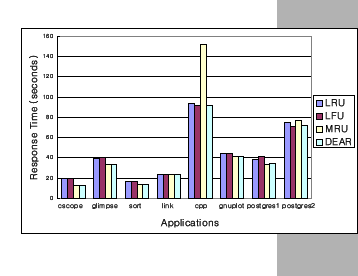
We compared the performance of each application under the DEAR scheme with not only that under the LRU scheme in FreeBSD but also with those under the LFU and MRU schemes. For this purpose, we implemented the DEAR scheme as well as the LFU and MRU schemes in FreeBSD. We measured both the number of disk I/Os and the response time of each application for a 6MB buffer cache with block size set to 8KB. For the DEAR scheme, we set the length of the detection period to 500 and the number of sublists in the ordered lists to 5 for both the backward distance and frequency block attribute types. The performance of the DEAR scheme for different cache sizes, different detection periods, and different numbers of sublists in the ordered lists is discussed in Section 4.5.


(a) Number of Disk I/Os (b) Response Time
Figure 7: Single application performance.
Figure 7 shows the number of disk I/Os and the response time of the four schemes. The values reported here are the average of three separate executions and before each execution, the system was rebooted. From the results we observe the following:
The last point is more evident in Figure 8 where the response time is divided into three components: I/O stall time, system time, and user time. For the LRU scheme of FreeBSD, the system time consists of VFS processing time, buffer cache management time, disk driver processing time, disk interrupt handling time and, data copy time from buffer cache to user space. On top of those, the DEAR scheme requires additional processing time such as those for sorting blocks according to block attribute values and maintaining block attribute values and forward distances. From Figure 8, we can notice that the system times of the two schemes are comparable meaning that the DEAR scheme incurs little additional overheads.
Figure 8: Decomposition of response time.
![]()