We performed experiments to find the basic costs of our new API calls, measuring how these costs scale with the number of connections per process. Ideally, the costs should be both low and constant.
In these tests, S-Client software simulates HTTP clients generating requests to the proxy. Concurrently, a load-adding client establishes some number of cold connections to the proxy server. We started measurements only after a dummy run warmed the Web server's file cache. During these measurements, the proxy's CPU is saturated, and the proxy application never blocks in get_next_event(); there are always events queued for delivery.
The proxy application uses the Alpha's cycle counter to measure the elapsed time spent in each system call; we report the time averaged over 10,000 calls.
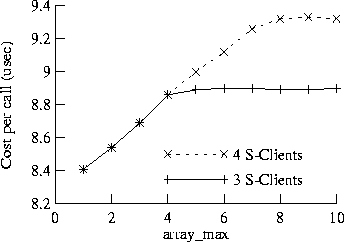
To measure the cost of get_next_event(), we used S-Clients generating requests for a 40 MByte file, thus causing thousands of events per connection. We ran trials with array_max (the maximum number of events delivered per call) varying between 1 and 10; we also varied the number of S-Client processes. Figure 6 shows that the cost per call, with 750 cold connections, varies linearly with array_max, up to a point limited (apparently) by the concurrency of the S-Clients.
For a given array_max value, we found that varying the number of cold connections between 0 and 2000 has almost no effect on the cost of get_next_event(), accounting for variation of at most 0.005% over this range.
We also found that increasing the hot-connection rate did not appear to increase the per-event cost of get_next_event(). In fact, the event-batching mechanism reduces the per-event cost, as the proxy falls further behind. The cost of all event API operations in our implementation is independent of the event rate, as long as the maximum size of the HINTS queue is configured large enough to hold one entry for each descriptor of the process.
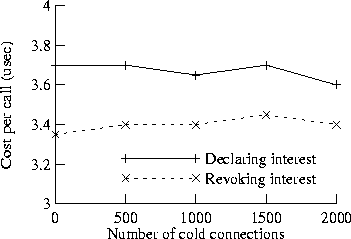
To measure the cost of the declare_interest() system call, we used 32 S-Clients making requests for a 1 KByte file. We made separate measurements for the ``declaring interest'' case (adding a new descriptor to an INTERESTED set) and the ``revoking interest'' case (removing a descriptor); the former case has a longer code path. Figure 7 shows slight cost variations with changes in the number of cold connections, but these may be measurement artifacts.