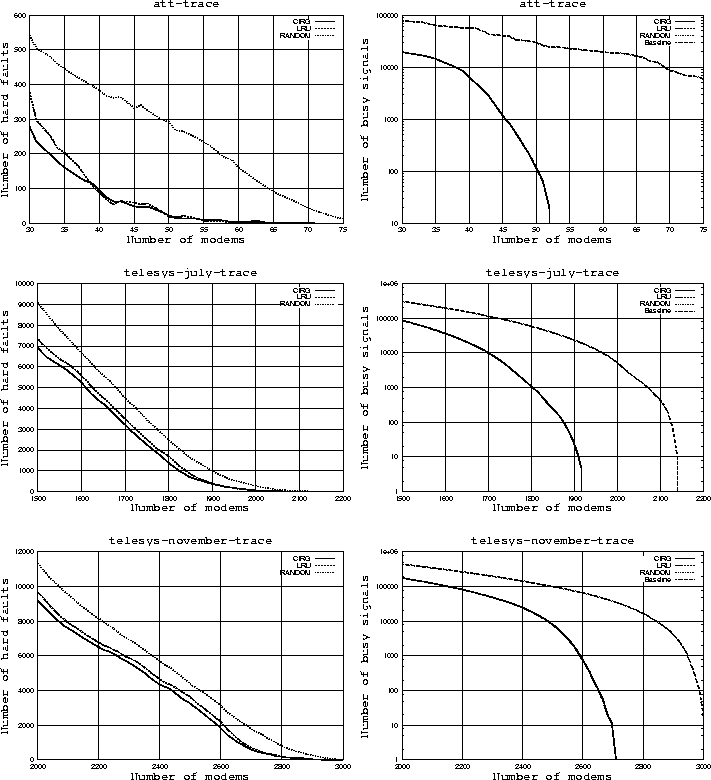
Figure 4 shows the results of simulations for all
three replacement policies and a wide range of modem pool sizes.
The value for threshold ![]() (and, consequently,
(and, consequently, ![]() ) is set
to 600 seconds (10 minutes). We will later examine how our
results change under different threshold values.
) is set
to 600 seconds (10 minutes). We will later examine how our
results change under different threshold values.
The ranges of modem pool sizes that we examine contain all reasonable values for practical applications, given each workload. That is, for the low end of the studied range, the workload incurs too many busy signals or too much user inconvenience due to disconnections. For the high end of the studied range, the workload incurs practically no hard faults or busy signals. For the Telesys traces, the chosen range begins at around 70% of the maximum number of simultaneously connected users in the trace.
Figure 4: Plots of hard faults (linear scale) and busy signals
(log scale) for all traces and a variable number of
modems. The value for threshold ![]() is 600 seconds (10
minutes) and
is 600 seconds (10
minutes) and ![]() . The baseline in the busy signal
plots is the number of busy signals incurred with no
disconnection policy in place (for the AT&T trace, no user
would get explicitly disconnected so this baseline is hardly
meaningful). For the busy signal plots, often all three curves
for RANDOM, LRU, and CIRG coincide and cannot be
distinguished.
. The baseline in the busy signal
plots is the number of busy signals incurred with no
disconnection policy in place (for the AT&T trace, no user
would get explicitly disconnected so this baseline is hardly
meaningful). For the busy signal plots, often all three curves
for RANDOM, LRU, and CIRG coincide and cannot be
distinguished.
As can be seen from Figure 4, CIRG and LRU are significantly better than RANDOM in terms of hard faults incurred. The difference ranges from a few tens of percent to over 1000%. Even more importantly, the relative difference is very significant for large modem pools, which are the ones that are going to be encountered in practice. For instance, it would be quite realistic to handle the workload of the July Telesys trace with around 1,900 modems (this setup would suffer around 15 busy signals in 10 days of use). For 1,906 modems, however, LRU incurs 370 hard faults, CIRG incurs 341, and RANDOM incurs 926 faults. Thus, in terms of user inconvenience, RANDOM may not be a good choice for a practical setup. Additionally, we can see that CIRG outperforms LRU. LRU systematically incurs 5% or more, and sometimes over 20% more faults than CIRG.
The second observation we can make in Figure 4 concerns the overall quality of service. We see clearly how a disconnection policy helps maintain a low busy-signal count with fewer modems. Combined with a replacement algorithm that yields a low number of hard faults, the result is a policy that guarantees good service under heavy demand. For instance, the July Telesys workload can be handled using CIRG with 1,875 modems while incurring only 100 busy signals and 500 hard faults during the course of 10 days (recall that this trace contains over 315,000 connections and user-initiated disconnections). This is 13% fewer modems than would be needed if the system did not disconnect idle users. For comparison, RANDOM needs 1,957 modems to reach 500 hard faults.