
 |
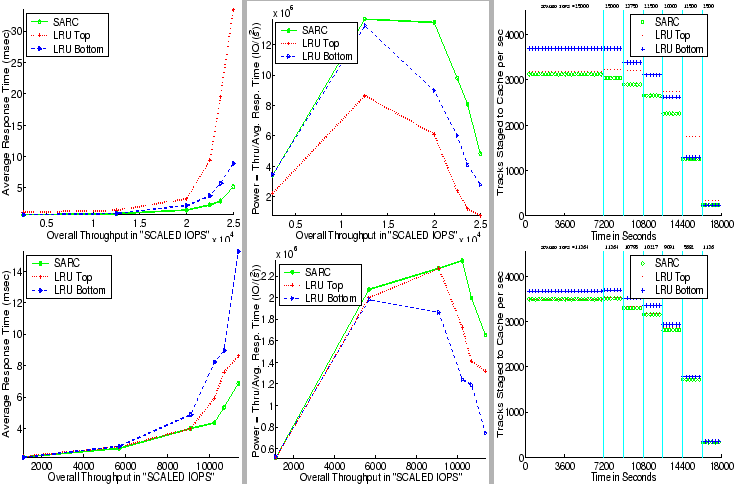
The two plots in the left column of Figure 6 show
the throughput (in scaled IOPS) versus average response time (in
ms) for all three algorithms by using the SPC-1 Like workload.
Each displayed data point is an average of ![]() numbers, each
number being an overall response time average for read and write
requests over a minute. According to SPC-1 specification, the
numbers corresponding to the first three minutes of a measurement
phase are discarded.
numbers, each
number being an overall response time average for read and write
requests over a minute. According to SPC-1 specification, the
numbers corresponding to the first three minutes of a measurement
phase are discarded.
The top, left plot is obtained on a cache-sensitive configuration
(see Section IV-D) for which, due to relatively
high cache hit ratio, a High Load schedule (see
Table I) is required to saturate the machine.
The bottom, left plot is observed on a cache-insensitive
configuration for which, due to relatively low cache hit ratio, a
Low Load schedule is sufficient. LRU Bottom generally
allocates more cache space to RANDOM than to SEQ when
compared to LRU Top. Hence, LRU Bottom performs better
than LRU Top in the cache-sensitive configuration where RANDOM list has more utility, whereas, the reverse is true in the
cache-insensitive configuration. However, in both the cases,
SARC significantly and dramatically
outperforms both the LRU variants by judiciously and
dynamically partitioning the cache space amongst the two lists.
Due to its self-tuning nature, SARC achieves this
without any a priori knowledge of the different workloads
resulting from different configurations and load levels.
For the cache-sensitive configuration (resp. cache-insensitive),
at the peak throughput, the overall average response times for
LRU Top, LRU Bottom, and, SARC are,
respectively, ![]() ms,
ms, ![]() ms, and
ms, and ![]() ms (resp.
ms (resp.
![]() ms,
ms, ![]() ms, and
ms, and ![]() ms).
ms).
To facilitate a more detailed analysis of the performance
improvements due to SARC, Table II provides
the break-up of overall average response time into read and write
components.
At the peak throughput in the cache-sensitive configuration, SARC provides ![]() % and
% and ![]() % read response time reduction
over LRU Top and LRU Bottom, respectively. Even for
the cache-insensitive configuration at the peak throughput, SARC provides
% read response time reduction
over LRU Top and LRU Bottom, respectively. Even for
the cache-insensitive configuration at the peak throughput, SARC provides ![]() % and
% and ![]() % read response time reduction
over LRU Top and LRU Bottom, respectively.
% read response time reduction
over LRU Top and LRU Bottom, respectively.
SARC improves read response times directly by reducing the
misses, serendipitously, the resultant reduction in the back-end
load also improves the performance for the concurrent writes. At
the peak throughput in the cache-sensitive configuration, SARC provides ![]() % and
% and ![]() % write response time reduction
over LRU Top and LRU Bottom, respectively. Once again,
even for the cache-insensitive configuration at peak throughput,
SARC provides
% write response time reduction
over LRU Top and LRU Bottom, respectively. Once again,
even for the cache-insensitive configuration at peak throughput,
SARC provides ![]() % and
% and ![]() % write response time
reduction over LRU Top and LRU Bottom, respectively.
Also observe in Table II that although none of
the LRU strategies works well in both cache-sensitive and
cache-insensitive configurations, SARC outperforms the
better of the two LRU variants fairly consistently across
all load levels for both reads and writes.
% write response time
reduction over LRU Top and LRU Bottom, respectively.
Also observe in Table II that although none of
the LRU strategies works well in both cache-sensitive and
cache-insensitive configurations, SARC outperforms the
better of the two LRU variants fairly consistently across
all load levels for both reads and writes.