The kernel support for DeBox consists of performing the necessary bookkeeping to gather the data in the DeBoxInfo structure. The points of interest are system call entry and exit, scheduler sleep and wakeup routines, and function entry and exit for all functions reachable from a system call.
Since DeBox returns performance information when each system call finishes, the system call entry and exit code is modified to detect if a process is using DeBox. Once a process calls DeBoxControl and specifies how much of the arrays to use, the kernel stores this information and allocates a kernel-space DeBoxInfo reachable from the process control block. This copy records information while the system call executes, avoiding many small copies between kernel and user. Prior to system call return, the requested information is copied back to user space.
At system call entry, all non-array fields of the process's DeBoxInfo are cleared. Arrays do not need to be explicitly cleared since the counters indicating their utilization have been cleared. Call number and start time are stored in the entry. We measure time using the CPU cycle counter available on our hardware, but we could also use timer interrupts or other facilities provided by the hardware.
Page faults that occur during the system call are counted by modifying the page fault handler to check for DeBox activation. We currently do not provide more detailed information on where faults occur, largely because we have not observed a real need for it. However, since the DeBoxInfo structure can contain other arrays, more detailed page fault information can be added if desired.
The most detailed accounting in DeBoxInfo revolves around the ``sleeps'', when the system call blocks waiting on some resource. When this occurs in FreeBSD, the system call invokes the tsleep() function, which passes control to the scheduler. When the resource becomes available, the wakeup() function is invoked and the affected processes are unblocked. Kernel routines invoking tsleep() provide a human-readable label for use in utilities like top. We define a new macro for tsleep() in the kernel header files that permits us to intercept any sleep points. When this occurs, we record in a PerSleepInfo element where the sleep occurred (blockingFile and blockingLine), what time it started, what resource label was involved (wmesg), and the number of other processes waiting on the same resource (numWaitersEntry). Similarly, we modify the wakeup() routine to provide numWaitersExit and calculate how much time was spent blocked. If the system call sleeps more than once at the same location, that information is aggregated into a single PerSleepInfo entry.
The process of tracing which kernel functions are called during a system call is slightly more involved, largely to minimize overhead. Conceptually, all that has to occur is that every function entry and exit point has to record the current time and function name when it started and finished, similar to what call graph profilers use. The gcc compiler allows entry and exit functions to be specified via the ``instrument functions'' option, but these are invoked by explicit function calls. As a result, function call overhead increases by roughly a factor of three. Our current solution involves manually inserting entry and exit macros into reachable functions. The entry macro pushes current function address and time in a temporary stack. The exit macro pops out the function address, calculates the wall clock time, and records these information in the CallTrace array. Automating this modification process should be possible in the future, and we are investigating using the mcount() kernel function used for kernel profiling.
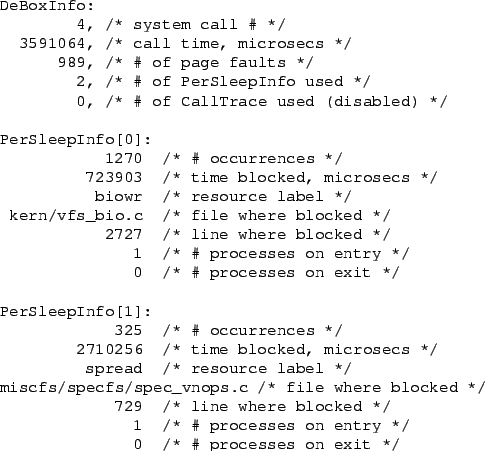
To show what kind of information is provided in DeBox, we give a sample output in Figure 4. We memory-map a 10MB file, and use the write() system call to copy its contents to another file. The main DeBoxInfo structure shows that system call 4 ( write()) was invoked, and it used about 3.6 seconds of wall-clock time. It incurred 989 page faults, and blocked in two unique places in the kernel. The first PerSleepInfo element shows that it blocked 1270 times at line 2727 in vfs_bio.c on ``biowr'', which is the block I/O write routine. The second location was line 729 of spec_vnops.c, which caused 325 blocks at ``spread'', read of a special file. The writes blocked for roughly 0.7 seconds, and the reads for 2.7 seconds.