 |

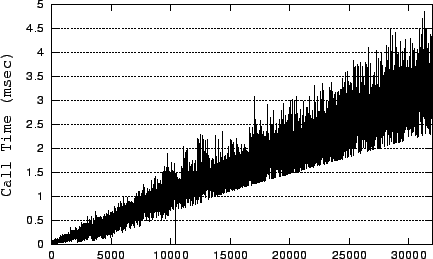
Though the dataset size now exceeds physical memory by over 50%, the system bottleneck remains CPU. Examining the time consumption of each system call again reveals that most time is being spent in memory residency checking. Though our modified Flash uses sendfile(), it uses mincore() to determine memory residency, which requires that files be memory-mapped. The cumulative overhead of memory-map operations is the largest consumer of CPU time. As can be seen in Figure 6, the per-call overhead of mmap() is significant and increases as the server runs. The cost increase is presumably due to finding available space as the process memory map becomes fragmented.
To avoid the memory-residency overheads, we use Flash's mapped-file cache bookkeeping as the sole heuristic for guessing memory residency. We eliminate all mmap, mincore, and munmap calls but keep track of what pieces of files have been recently accessed. Sizing the cache conservatively with respect to main memory, we save CPU overhead but introduce a small risk of having the main process block. The CPU savings of this change is substantial, allowing us to reach 620 connections (2GB dataset).