 |
The passive measurement module tracks the performance to destinations of interest by sampling provider links using Web requests initiated by clients in the enterprise. The basic strategy is to use new requests to sample an ISP's performance to a given destination if the performance estimate for that ISP is older than the predefined sampling interval. If the module has current performance estimates for all links, then the connection is directed over the best link for the destination.
The module maintains a performance hash table keyed by the destination (i.e., either the IP address or the domain name of the destination). A hash table entry holds the current estimates of the performance to the destination via the three providers, along with an associated timestamp indicating the last time performance to the destination via the provider was measured. This is necessary for updating the EWMA estimate of performance (Section 2.2).
Notice that without some explicit control, the hash table maintains performance samples to all destinations, including those rarely accessed. One concern is that this could cause a high overhead of measurement, with connections to less popular destinations being all used up for obtaining performance samples. While maintaining explicit TTLs per entry might help flush out destinations that have not been accessed over a long period of time, it does not guarantee a manageable measurement overhead. Also, TTLs require maintaining a separate timer per entry, which is an additional overhead.
In view of this, we limit performance sampling to connections destined
for the most popular sites, where popularity is measured in terms of
aggregate client request counts, as follows: Hash entries also hold
the number of accesses made to the corresponding destinations. Upon
receiving a connection request for a given destination, we update the
access count for the destination using an exponentially weighted
moving average (EWMA). The EWMA weight is chosen so that the access
count for the destination is reset to ![]() 1 if it was not accessed
for a long time, say 1 hour.
1 if it was not accessed
for a long time, say 1 hour.
We use a hard threshold and monitor performance to destinations for
which the total number of requests exceeds the threshold (by looking
for live entries in the table with the access counts exceeding the
threshold). In a naive hash table implementation for tracking the
frequency counts of the various elements, identifying the popular
destinations may take ![]() hash table size
hash table size![]() time.
time.
Other ways of tracking top destinations such as Iceberg Queries [8] or Sample-and-hold [6], may not incur such an overhead. Nevertheless, we stick with our approach for its simplicity of implementation. Also, as we will show later, the overhead from looking for the popular hash entries in our implementation is negligible. Note that this approach does not necessarily limit the actual number of popular destinations, for example in the relatively unlikely case that a very large number of destinations are accessed very often.
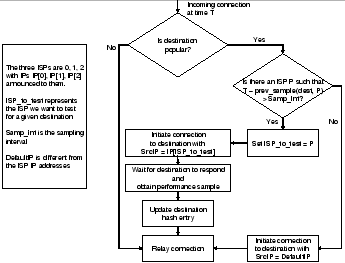
Figure 2 shows the basic operation of the passive monitoring scheme. When an enterprise client initiates a connection, the scheme first checks if the destination has a corresponding entry in the performance hash table (i.e., it is labeled popular). If not, the connection is simply relayed using a provider link chosen randomly, in a load-balancing fashion.
If there is an entry for the destination, the passive scheme scans the measurement timestamps for the three providers to see if the elapsed time since the last measurement on any of the links exceeds the predefined sampling interval. If so, the performance to the destination along one of these providers links is sampled using the current connection.
In order to obtain a measurement sample on a provider link, the scheme initiates a connection to the destination using a source IP address set such that the response will return via the link being sampled. Then, it measures the turn-around time for the connection, defined as the time between the transmission of the last byte of the client HTTP request, and the receipt of the first byte of the HTTP response from the destination. The observed turn-around time is used as the performance sample to the destination, and the corresponding entry in the hash table is updated using the EWMA method (Section 2.2). The remainder of the Web request proceeds normally, with the proxy relaying the data appropriately.
If all of the ISP links have current measurements (i.e., within the sampling interval), the proxy initiates a connection using the best link for the destination by setting the source IP address appropriately. We discuss these details in Section 3.3.