


Next: Correlation between delay and
Up: Circuitousness of Internet paths
Previous: U.S. versus Europe
Temporal properties of routing
To better understand some of the temporal properties of routing, we
compare the distribution of the distance ratio computed from our 2000
data set with that computed from Paxson's 1995 data set [20].
The paths in the 1995 data set correspond to traceroutes
conducted amongst the 33 nodes (mainly at academic locations) that
were part of the testbed. We considered 340 paths between the subset
of 20 nodes that were located in the U.S. The 1995 data set includes
multiple traceroute measurements between each pair of hosts. In our
study, we only use data from one successful traceroute between each
pair of hosts. To keep the nature of the measurement points similar,
in the 2000 data set we only consider paths between the 15 source
hosts located at universities and the 265 hosts in the UnivHosts set.
Figure 7:
CDF of distance ratio for paths in Paxson's 1995 data set and our data set from 2000.
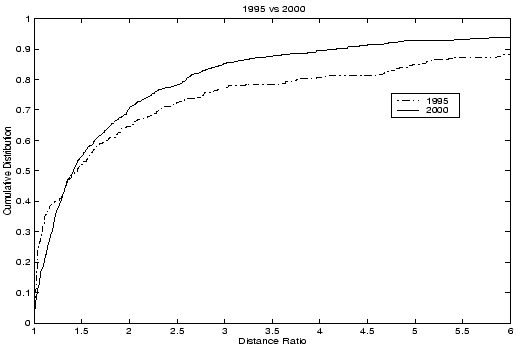 |
Figure 7 plots the CDF of the distance ratio for
the 1995 and 2000 data sets. By observing the tail of the cumulative
distribution, we find that the distance ratios tend to be smaller in
the 2000 data set. This improvement is not surprising because the
Internet is more richly connected today than it was 5 years ago. There
now exist direct point-to-point links between locations that were
previously connected only by an indirect path.
Next: Correlation between delay and
Up: Circuitousness of Internet paths
Previous: U.S. versus Europe
Lakshminarayanan Subramanian
2002-04-14