|
OSDI '04 Paper
[OSDI '04 Technical Program]
Using Magpie for request extraction and workload modelling
Paul Barham, Austin Donnelly, Rebecca Isaacs and Richard Mortier
{pbar,austind,risaacs,mort}@microsoft.com
Microsoft Research, Cambridge, UK.
Tools to understand complex system behaviour are essential for
many performance analysis and debugging tasks, yet there are many open
research problems in their development. Magpie is a toolchain for
automatically extracting a system's workload under realistic operating
conditions. Using low-overhead instrumentation, we monitor the system
to record fine-grained events generated by kernel, middleware and
application components. The Magpie request extraction tool uses an
application-specific event schema to correlate these events, and hence
precisely capture the control flow and resource consumption of each
and every request. By removing scheduling artefacts, whilst
preserving causal dependencies, we obtain canonical request
descriptions from which we can construct concise workload models
suitable for performance prediction and change detection. In this
paper we describe and evaluate the capability of Magpie to accurately
extract requests and construct representative models of system
behaviour.
Introduction
Figure 1:
The Magpie toolchain:
as requests move through the system event traces are generated on
each machine. These are then processed to extract the control
flow and resource usage by each individual request and
scheduling variations removed. Finally, the canonical requests
are clustered to construct models of the workload as a
whole.
|
Tools to understand complex system behaviour are essential for many
performance analysis and debugging tasks, yet few exist and there are
many open research problems in their development. Magpie provides the
ability to capture the control path and resource demands of
application requests as they are serviced across components and
machines in a distributed system. Extracting this per-request
behaviour is useful in two ways. Firstly it gives a detailed picture
of how a request was serviced, throwing light on questions such as
what modules were touched and where was the time spent? Did the
request cause a disk access or was data served from the cache? How
much network traffic did the request generate? Secondly, the
per-request data can be analyzed to construct concise workload models
suitable for capacity planning, performance debugging and anomaly
detection. These models require the ability to measure a request's
resource demands, discarding the scheduling artefacts due to OS
multitasking and timesharing. In effect, we obtain a picture of how
the request could have been serviced (and apply this
information toward modelling the workload), in addition to the data on
how it actually was serviced (which is useful for detailed
analysis of individual request behaviour).
The contributions of our work can be summarized as follows:
- An unobtrusive and application-agnostic method of
extracting the resource consumption and control path of
individual requests. Unlike other approaches to request
tracking, for example [1,8],
Magpie does not require a unique request identifier to be
propagated through the system, and it accurately attributes
actual usage of CPU, disk and network to the appropriate
request. This is achieved by correlating the events that
were generated while the requests were live, using a schema to
specify the event relationships and carrying out a temporal
join over the event stream.
- A mechanism for constructing a concise model of the workload.
Each request is first expressed in a canonical form by abstracting
away from the scheduling artefacts present in the original event
trace. A representative set of request types is then identified by
clustering the canonical request forms. This set of requests,
together with their relative frequencies, is a compact model of the
workload that can then be used for performance analysis purposes.
- A validation of the accuracy of the extracted workload
models using synthetic data, and an evaluation of their
performance against realistic workloads.
The Magpie request tracking technique is unique in that it uses
event logs collected in a realistic operating environment. It
handles the interleaving of many different request types, it is
impervious to unrelated activity taking place at the same time,
and it is able to attribute resource usage to individual
requests even when many are executing concurrently.
The request-oriented approach to understanding and characterizing
system behaviour complements existing methods of performance modelling
and analysis. Causes of faults or performance problems are often
revealed simply by inspecting the Magpie trace of the individual
request and comparing to the expected behaviour. In contrast, the
traditional approach to monitoring system health is to log aggregate
performance counters and raise alarms when certain thresholds are
exceeded. This is effective for identifying some throughput problems,
but will not catch others such as poor response time or incorrect
behaviour (``why was the item not added to my shopping cart?'').
Although straightforward programming errors and hardware failures are
likely to be at the root of most problems, the effects are exacerbated
and the causes obscured by the interactions of multiple machines and
heterogeneous software components.
Even though performance modelling is of key importance for commercial
enterprises such as data centers, current methods for constructing
workload models are surprisingly unsophisticated. Without a tool like
Magpie, workload models for capacity planning and other performance
prediction tasks have to be derived from a carefully controlled
measurement environment in which the system input is contrived to
stress each request type in isolation. This requires manual
configuration and expert knowledge of the system behaviour, and
compromises accuracy because variables such as caching behaviour are
ignored. Workload models that are automatically derived using Magpie
are quicker and easier to produce, and more accurately capture the
resource demands of the constituent requests.
Magpie is a preliminary step towards systems that are robust,
performance-aware and self-configuring (Autonomic
Computing [12] is a well known articulation of this grand
vision). We have previously discussed the applications and utility of
Magpie's workload models to scenarios ranging from capacity planning
to on-line latency tuning [3,11].
The emphasis in this paper is on a thorough, bottom-up evaluation of
its use in practical situations. We demonstrate that Magpie
accurately extracts individual requests under realistic operating
conditions, and that the aggregation of this data leads to
representative workload models.
The following four sections describe the design and
implementation of the Magpie prototype toolchain. Then in
Section 6 we evaluate the Magpie approach
using simple synthetic workloads where it is straightforward to
assess the results obtained, progressing to more complex
workloads in Section 7.
Design and implementation
The workload of a system is comprised of various categories of request
that will often take different paths through the system, exercising a
different set of components and consuming differing amounts of system
resources. A request is system-wide activity that takes
place in response to any external stimulus of the application(s) being
traced. For example, the stimulus of an HTTP request may trigger the
opening of a file locally or the execution of multiple database
queries on one or more remote machines, all of which should be
accounted to the HTTP request. In other application scenarios, the
database queries may be considered requests in their own right.
Within Magpie both the functional progress of the request and its
resource consumption at every stage are recorded. Thus a request is
described by its path taken through the system components (which may
involve parallel branches) together with its usage of CPU, disk
accesses and network bandwidth.
The Magpie prototype consists of a set of tools that take event logs
and eventually produce one or more workload
models. Figure 1 illustrates the process. The
intention when designing the tools has been to deploy an online
version of Magpie that monitors request behaviour in a live system,
constantly updating a model of the current workload. Although Magpie
operates both offline and online, this goal has dictated our design
choices in many places.
Earlier versions of Magpie generated a unique identifier when a
request arrived into the system and propagated it from one
component to another [3]. The same technique
is employed in other request tracking technologies such as
Pinpoint [8]. Events were then logged by each
component annotated with this identifier. We have since
developed less invasive request extraction techniques that we
describe in more detail below. Eschewing a requirement for
global identifiers avoids the problems associated with
guaranteeing unique identifier allocation. It also avoids the
need for complicated ad-hoc state management or API modification
to manage the identifiers as they are propagated. Finally, it
also ensures that the instrumentation is kept independent of the
definition of a ``request'': it is not uncommon for two
applications to share the same component, and it is desirable if
one set of instrumentation can support tracing of both
applications.
Instrumentation
The instrumentation framework must support accurate accounting
of resource usage between instrumentation points to enable
multiple requests sharing a single resource to be distinguished
(e.g. threads sharing the CPU, RPCs sharing a socket). One
consequence of this is a requirement for high precision
timestamps. As events are generated by components in both
user-space and kernel mode, the attribution of events to
requests relies on them being properly ordered. In Windows NT
based operating systems, a large proportion of kernel and device
driver activity occurs inside Deferred Procedure Calls (DPCs); a
form of software interrupt with a higher priority than all
normal threads. It is therefore often important to know whether
a particular event occurred inside a DPC or standard interrupt, or
whether it occurred before or after a context switch. In order
to get the required precision we use the processor cycle
counter, which is strictly monotonic, as the event timestamp.
Figure 2:
Instrumentation points for the web server and database server in our
test e-commerce site. Some components such as the http.sys kernel
module and the IIS process generate events for request arrival,
parsing, etc. Additional instrumentation inserted by Magpie (shown in
gray) also generates events; all these events are logged by the Event
Tracing for Windows subsystem.
|
Event Tracing for Windows (ETW) [17,18] is a low overhead
event logging infrastructure built into recent versions of the Windows
operating system, and is the technology underpinning the Magpie
instrumentation. We make extensive use of pre-existing ETW event
providers and where necessary we have added custom event tracing to
components. The instrumented components in an e-commerce site that we
use for prototyping are depicted in Figure 2. There are
three main parts to the instrumentation:
- Kernel ETW tracing supports accounting of thread CPU consumption
and disk I/O to requests.
- The WinPcap packet capture library[19], modified
to post ETW events, captures transmitted and received packets at
each machine.
- Application and middleware instrumentation covers all points
where resources can be multiplexed or demultiplexed, and where the
flow of control can transfer between components. In the prototype
both platform middleware components such as WinSock2, and specific
application-level components such as the ASP.NET ISAPI filter (used
to generate active content), are instrumented in order to track a
request from end to end.
An ETW event consists of a timestamp, an event
identifier, and the values of zero or more typed
attributes1. In a typical system there will be
multiple event providers, and therefore event identifiers have
the hierarchical form Provider/EventName. A typical event
from the log has the form:
Each ETW event provider produces an ordered stream of timestamped
events. However, at any given time there will usually be a large number of
requests present in the system, each generating events from a variety
of components and subsystems as it is serviced. As a result
the stream of events will invariably comprise a non-deterministic
interleaving of events from many active requests. The first
stage of workload extraction is to demultiplex this event
stream, accounting resource consumption to individual requests.
The toolchain consumes events generated by system instrumentation, as
described in Section 2.1. In the sections
following we present the workload extraction pipeline in some detail.
The request parser identifies the events belonging to
individual requests by applying a form of temporal join over
the event stream, according to rules specified in an event schema.
During this process it preserves the causal ordering of events,
allowing a canonical form of each request to be inferred that captures
its resource demands (as opposed to the service the request received),
and this is discussed further in Section 4. From
the canonical form, a request can be deterministically serialized,
leading to a representation suitable for behavioural
clustering. In Section 5 we describe how
behavioural clustering builds workload models by comparing requests to
each other according to both control path and resource demands.
Request parser
The request parser is responsible for extracting individual
requests from the interleaved event logs. By determining which
events pertain to a specific request, the parser builds up a
description of the request that captures its flow of control
and its resource usage at each stage. It is written to operate
either online or offline, via the public ETW consumer
API [17].
The parser considers each event from the stream in timestamp order and
speculatively builds up sets of related events. It relies on an
event schema to describe event relationships for the particular
application of interest. For example, it may be the case that events
occurring in sequence on the same thread belong to the same request,
and this will be expressed in the schema by specifying those events
related by thread id. The thread may post the identical event
sequence for any number of different requests. The idea of
temporal joins ensures that only those events that occur while
the thread is working on the one request are joined together. Some of
the resulting event sets will eventually be identified as describing a
complete request, others can be discarded. Because the way in which
events are related is defined out-of-band in an application-specific
schema, the request parser itself contains no builtin assumptions
about application or system behaviour.
For every event type, the schema specifies which attributes connect it
to other events. As each event is processed by the parser, its type
is looked up in the schema and the event is then added to the
appropriate set of related events--in other words, the event is
joined to one or more other events.
Figure 3:
Illustration of how the parser joins a sequence
of IIS events. Each event is shown as a black vertical line that
binds two or more attribute-value pairs (represented as circles on
the horizontal attribute-value lines). The joining of events is
depicted with transparent gray lines, and valid-intervals are
displayed with a vertical line to the left of the
BIND_START and to the right of the BIND_STOP
join attributes. This portion of the request does not show where
the valid-interval for W3Id=23 is opened, nor the opening or
closing of the valid-interval for ThreadId=44.
|
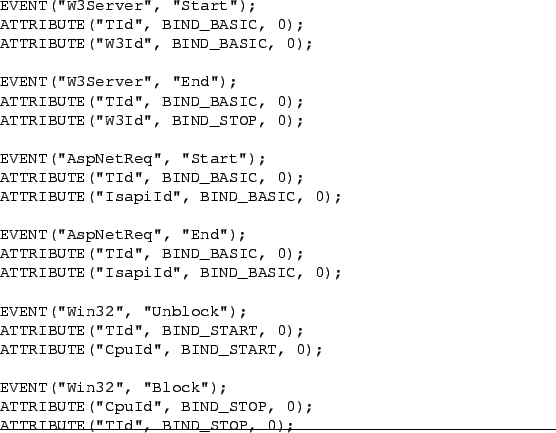
Figure 4:
Portion of the IIS schema
used to perform the event parsing illustrated in
Figure 3. The binding types BIND_START and
BIND_STOP instruct the parser to open or close a valid-interval.
 |
For example, an IIS web server schema specifies that one of the join
attributes for both the W3Server/Start and the
W3Server/End events is W3Id. This means that if two such
events occur, both with W3Id=23, for example, they will be joined
together. Figure 3 contains a graphical
representation of this process. The same schema states
that ThreadId is also a join attribute for those events. This
allows different attributes posted by other event types to be
transitively joined to the request for which W3Id=23. Thus, as
shown in the diagram, if ASPNetReq/Start with IsapiId=87 is
posted by the same ThreadId=42 as W3Server/Start, then the
two events will be joined via the shared ThreadId attribute. In
turn, the IsapiId join attribute causes other events also with
IsapiId=87 to be added to this set of related events. In this way,
the set of events belonging to each request is incrementally built up
as the parser processes the event stream.
In addition to identifying which attributes cause events to be joined,
the schema indicates the nature of these joins. In the example
description above, there is nothing to stop two
W3Server/Start events posted by the same thread but with
different W3Id values being joined together. A mechanism is
needed to prevent all the requests being merged into one, and this is
captured by the notion of temporal joins.
As a request progresses, relationships between attribute values are
broken as well as created. For example, a worker from a thread pool
may be re-tasked from one request to another, or an HTTP/1.1
connection may be reused for more than one request. In the above
example ThreadId=42 is a worker thread that posts a
W3Server/Start event on behalf of each request before
handing the request processing off to another thread. The period
during which we know that ThreadId=42 is working exclusively on one
request defines a valid-interval for the attribute-value pair
(ThreadId,42).
This terminology is borrowed from the temporal database
community [10], where it is used to denote the time range
during which a row of a table was present in the database. In such
databases, arbitrary SQL queries can be executed against the database
as if at a particular time. Theoretically it should be possible to
implement the Magpie parser as queries against a temporal database in
which each table holds the events of a given type. Finding all the
events relating to a request would be an n-way relational join, where
n is the number of event types involved in the request.
During a valid-interval, events are joined together as usual. However
once the valid-interval is closed for a particular attribute-value
pair, no more events can be added to the same event set via that pair.
Therefore the IIS schema specifies that the event Win32/Block
closes the valid-interval for the ThreadId attribute of that event,
and likewise the Win32/Unblock event opens the
valid-interval. In the example above, a new valid-interval for
ThreadId=42 is opened for each request, thus preventing the merging
of disjoint requests.
The opening and closing of valid-intervals is controlled in the
schema by the use of binding types for the join specifications.
A BIND_START begins a new valid-interval for an
attribute-value pair and a BIND_STOP terminates the current
valid-interval. An attribute that joins an event without affecting
the valid-interval has a BIND_BASIC binding type. In
the theoretical implementation using a temporal database, when a
valid-interval is closed by an attribute-value pair, all the
corresponding events would be deleted from the relevant
table2.
A fragment of the IIS schema matching the example discussed above is
shown in Figure 4. In our prototype parser
implementation, the schema is written as C macros. The EVENT
macro takes the name of the provider and the event. Each join
attribute is listed using the ATTRIBUTE macro, together with
its binding type and any flags.
Figure 5:
Transitive joins enable packet bandwidth and
CPU consumption by the network stack to be correctly attributed, even
though the thread that issues the send request is swapped out at the
time the packet is transmitted. The diagonal pair of lines crossing
the horizontal lines indicate the passing of an arbitrary amount of
time.
|
Certain event types are associated with the consumption of physical
resources. Specifically, context switch events give the number of CPU
cycles used by a thread during its timeslice, disk read and write
events are posted with the number of bytes read or written, and
likewise packet events with the packet's size. When these event types
are added to a request, it indicates that the relevant resource was
consumed on behalf of that request. Figure 5
shows an example in which CPU consumption is associated with the
request both while ThreadId=44 is running, and also during the
network stack DPC (when some other thread is nominally swapped in on
that CPU). The WinPCap/PktTx event also associates the
network bandwidth used by that packet with the request. The user mode
WinSock/Connect and kernel mode WinPCap/PktTx events
are joined via their shared source and destination address attributes,
represented in the diagram as ConnHash=12.
Figure 6:
Annotated screenshot
of parser visualization of a single request. Each of the event
attribute-value pairs that is active during the displayed time
period is depicted with a horizontal timeline. Events are shown
as binding to one or more of these timelines, and when the binding
is of type STOP or START, this is indicated with a small vertical
barrier. The portions of each timeline that belong to the
request are emphasized, showing that the parser is in effect doing
a flood-fill of the graph formed by the join attributes of events.
To make it easy to see which threads are actually running at any
time, this is highlighted with a pale rectangle.
|
Figure 6 shows an annotated screenshot from a
visualization tool that we developed to debug the parser. The
highlighted sub-graph contains events from an HTTP request for the URL
shortspin.aspx, which generates a very small amount of
dynamic content that is returned in a single HTTP response packet. It
also spins the CPU for approximately 15ms by executing a tight loop.
This particular request is an example of a type B request as used in
the experimental evaluation presented in
Section 6.
The design of the parser was severely constrained by the necessity for
minimal CPU overhead and memory footprint, as it is intended to run
online on production servers. Additionally, it must process
trace events in the order they are delivered, since there is no way for
it to seek ahead in the trace log, and this creates still more complexity.
In online mode, the kernel logger batches events from different
subsystems for efficiency and delivers one buffer at a time. For
example, context switch events from each CPU are delivered in separate
buffers. Whilst individual buffers contain events in timestamp
order, events from different buffers must be interleaved before
processing. These reorderings are performed using a
priority queue, and add approximately 1 second of pipeline delay to
the parser.
The reorder queue is also used for some events that are posted at the
end of the operation, such as those for disk I/O, which contain the
start time of the I/O as an event parameter. The parser creates a
synthetic ``Start'' event with the correct timestamp and inserts it into the
event stream in the correct place.
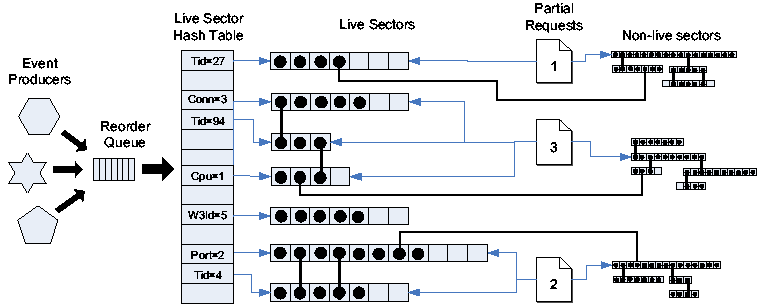
Figure 7:
Parser data structures. Hash table entries
represent the current valid-intervals and are known as live
sectors. An event (shown as a black circle) is added to zero or
more live sector lists according to the values of its binding
attributes. Non-live sector lists, representing closed
valid-intervals, are not reachable from the live sector hash table.
|
Figure 7 depicts the data structures used by
the parser. Temporal joins are implemented by appending events to one
or more time-ordered lists, each of which represents the current
valid-interval for an attribute. The most recent (``live'')
valid-interval for each attribute is maintained in a hash table and
requests are gradually built up using event attribute bindings to
connect lists together. In the example from the previous section,
the parser would enter the W3Server/Start event onto the
current list containing all events with W3Id=23 and onto the current
list containing all events with ThreadId=42. The presence of the
same event in both lists causes them to be joined together, forming a
larger sub-graph.
The schema identifies a seed event that occurs only and always within
a request, for example a web server HTTP request start event. As
events are processed in timestamp order, every so often some of the
sub-graphs will become unreachable because all their valid-intervals
have been closed. If a sub-graph contains a request seed event, then
all the connected events can be output as a complete request,
otherwise it will be garbage collected. Note that there will be many
lists (or graphs) that turn out not to represent any request, but
instead contain events generated by other applications and background
system activities. An additional timeout is used to bound the
resources consumed by such activities.
Ideally a request schema should be written by someone with an in-depth
knowledge of the synchronization mechanisms and resource usage idioms
of the application in question, and this would preferably be done at
the same time as the application is instrumented. It is much harder
to retrofit a schema and instrumentation to an existing application
without this knowledge (but not impossible, as we have in fact done
this for all the applications mentioned in this paper). An area for
future work is to explore extensions to the expressiveness of the
schema. Currently an event can only affect the timelines of its own
attributes: one useful enhancement would be the ability to
transitively start or stop the valid-intervals on other timelines.
We assessed the performance impact of Magpie event tracing and parsing
by running a web stress-test benchmark. The number of HTTP requests
served over a two-minute interval was recorded for a CPU-bound
workload that generated active HTML content and saturated the CPU.
Measurements were repeatable to within +/- 10 requests.
With no instrumentation the server was able to complete 16720
requests, i.e. 139 requests/second. When logging was turned on in
real-time mode, with no event consumer, there was no discernible
difference in throughput. A dummy event consumer, which immediately
discarded every event, reduced the throughput to 136 requests/second.
Running the Magpie parser to extract requests online resulted in a
throughput of 134 requests/second, giving a performance overhead of
approximately 4%, around half of which can be attributed to the ETW
infrastructure. During these experiments the average CPU consumption
of the parser was 3.5%, the peak memory footprint 8MB and some 1.2
million events were parsed. Since the web server was CPU-bound during
the course of the experiments, this directly accounts for the observed
drop in HTTP throughput.
When the ETW logging was enabled to write events to file (instead of
operating in real-time mode), the server throughput was 138
requests/second, indicating that the impact of the ETW infrastructure
in offline mode is negligible. For the same workload, of 2 minutes
duration, a total of around 100MB of binary log file was produced.
The parser extracted the correct number of requests in 5.6s, with a
peak working set size of approximately 10MB. The average number of
events attributed to each request was 36.
Synchronization and causal ordering
At the lowest level, all events are totally ordered by timestamp,
leading to a trace of the execution and resource consumption that may
vary depending on how the threads acting in a request happen to be
scheduled. To extract a meaningful workload model we need to recover
the threading structure within a request: for example, determining
when one thread causes itself to block or another to unblock. This
inter-thread causality tells us how much leeway the scheduler has to
re-order the processing of the various stages of a request, and it
also allows us to infer how portions of a request might parallelize,
which is clearly of interest in multi-processor deployments.
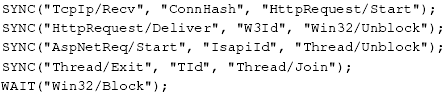
Figure 8:
Example statements from the
IIS schema used to add explicit thread synchronization points to
parsed HTTP requests. Each SYNC statement specifies
(s, a, d ) where s and d are the source and destination events,
and are (transitively) joined by shared attribute a. An event
pattern matching a SYNC specification will result in a
Signal event being inserted on the source thread and a
Resume event on the destination thread. A WAIT
event type generates an additional synthetic Wait event.
 |
In the web server example used for
Figure 6, a kernel TcpIP/Recv
event unblocks an IIS thread that parses HTTP requests, then
unblocks an ISAPI filter thread, which eventually unblocks a
third thread to run the ASP.NET active content generator. This
last thread blocks after sending the HTTP response back to the
client. Since these threads typically come from a thread pool,
we occasionally observe the same thread processing multiple of
these logically distinct segments of a request, so it is
important to be aware of these synchronization points even if
they are not apparent in all requests.
Many such synchronization points are implicit from the OS
primitives being invoked (e.g. send and receive). In other
places, thread synchronization can be performed using mechanisms
for which there is no instrumentation, e.g. in a user-level
scheduler. For this reason, we provide a mechanism to
explicitly insert causal dependencies into the parsed event
graphs. This allows us to annotate a request with additional
thread synchronization points using known semantics of the
application domain.
We define three synthetic events to be inserted into parsed requests:
Signal, Wait and Resume. There is an
explicit causality between related Signal and Resume
events, and so these will be connected by some shared attribute-value.
This is expressed in the schema using a 3-tuple (s, a, d ), where s
is the name of the source event executed by thread A at time tA,
d is the name of the destination event in thread B at time tB,
and a is the join attribute, shared by events s and d.
Attribute a is not necessarily a parameter of both event types, but
may be transitively shared through other joined events on the same
thread. Events from thread A with timestamps less than tA
must always happen before thread B events with timestamps
greater than tB, under any scheduling discipline.
Figure 8 shows some example synchronization statements
from the IIS schema, and in Figure 6 the
synchronization events inserted by the parser can be seen in amongst
the original request events.
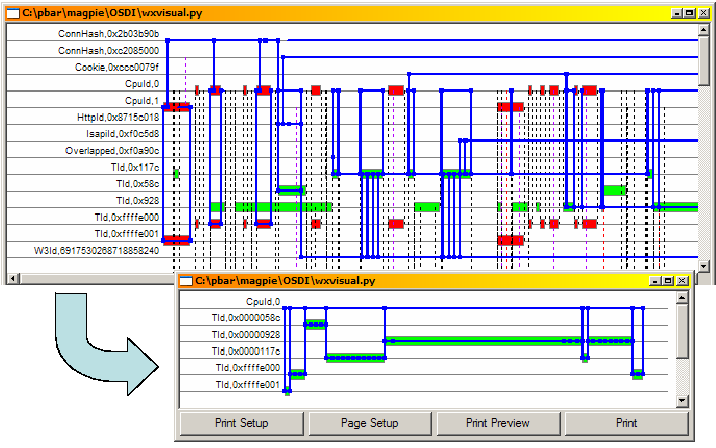
Figure 9:
A canonical
version of an HTTP request is produced by eliding all
scheduling behaviour and retaining only thread
synchronization points. The top window shows the request as
scheduled in an experiment with 5 concurrent clients, and
the lower window the canonical version.
|
Canonicalization
When the system is more heavily loaded, requests tend to be
scheduled in a highly interleaved fashion, as shown in
Figure 9. Although the request URL is identical
to that of Figure 6, the way in which the
request is serviced differs due to multiple clients
competing for system resources. In
Figure 6, the thread completes its work
in a single quantum of CPU time, whereas in the top window of
Figure 9 it is frequently preempted and its
activity is interspersed with threads servicing other
connections.
A detailed per-request view of system activity is undoubtedly
useful for determining the path taken by a request, and how it
consumed resources along the way. However, for constructing
workload models for performance prediction or debugging purposes
we would rather represent requests as a canonical sequence of
absolute resource demands and ignore all the information
about how the request was actually serviced.
Using the causal ordering annotations discussed in the previous
section, we produce a canonical version of each request, in effect by
concatenating all resource demands between synchronization points, and
then scheduling this as though on a machine with an unlimited number
of CPUs. The lower window of Figure 9 shows the result
of this processing stage when applied to the request in the upper
window. The canonical version is clearly more useful for modelling
purposes.
Cross-machine activity
When requests cause activity on multiple machines it is necessary to
``stitch'' together the events collected on each computer. Since
every machine in the system has a separate clock domain for its
timestamps, the request parser is run once for each machine, either
online or offline (we believe it ought to be straightforward to extend
the parser to deal with multiple clock domains but this is not a
current priority). The request fragments from each machine are
canonicalized as described previously. We then run an offline tool
that combines canonical request fragments by connecting synchronization
events from transmitted packets to received packets.
Request comparison
Thread synchronization can be used to overlay a binary tree
structure onto what would otherwise be a linear
timestamp-ordered event stream. When two threads synchronize,
perhaps by sending a message, we create a logical fork in the
event tree where the original (source) thread continues whilst
also enabling the destination thread to execute in parallel.
When a thread blocks, perhaps to receive a message, this is
treated as a leaf node. The results of applying this procedure
to a contrived RPC-style interaction is shown in
Figure 10.
Figure 10:
Binary tree structure
overlaid onto RPC-style thread interactions. This tree
would be deterministically serialized in the order shown.
![\includegraphics[width=7.5cm]{tree.eps}](img10.png)
|
By deterministically flattening this tree representation using
standard depth-first traversal, we can cluster requests using a simple
string-edit-distance metric rather than requiring elaborate and
traditionally expensive graph-edit-distance metrics. Although this
has produced reasonable results in our prototype, losing the tree
structure before comparing requests seems likely to limit the
usefulness of this approach in larger distributed systems where
requests have more complex structure. Recent work has developed more
suitably efficient algorithms for tree- and graph-edit-distance and
also investigated
graph-clustering [5]. Applying
some of these techniques to improve our workload extraction process is
currently under investigation.
Behavioural clustering
The clustering stage of the toolchain groups together requests with
similar behaviour, from the perspective of both event ordering and
resource consumption. Since we require that the processing pipeline
functions online, we use a simple incremental clustering algorithm.
The resulting clusters are the basis of a workload model which
expresses that requests occur as typified by each cluster's
representative, and they occur in proportion to their cluster's size.
The clusterer maintains a set of active workload clusters. For
each cluster, we record a representative request (sometimes
referred to as the centroid of the cluster), a cluster diameter,
and the set of requests that are considered members of the
cluster. Additionally, the algorithm keeps track of the average
cluster diameter, and the average inter-cluster distance.
When a new request is presented to the clusterer, it computes the
string-edit-distance between its serialized representation and that of
each cluster centroid. The distance metric is a function of both the
character edit cost (as in the traditional form of
string-edit-distance) and also of the resource usage deltas associated
with the the two events. So for example, the comparison of two
characters where both represent a disk read will give an edit cost
proportional to the difference in how many bytes were actually read.
The request is normally added to the cluster with the smallest edit
distance, unless that edit distance exceeds a trigger threshold, in
which case a new cluster is created.
Validation
To support our claim that Magpie is able to extract individual
requests and construct representative workload models, we attempt to
examine our techniques in isolation. In this section we present the
results, which include an assessment of the quality of the clusters
obtained, as well as checks that our resource accounting is accurate.
In all experiments, events are generated using the instrumentation
described in Section 2.1 and the event
streams are parsed as discussed in Section 3.
Flattened representations of the requests are then clustered into
similar groups using the behavioural clustering technique presented in
Section 5. The machines used are all
dual-processor 2.6GHz Intel P4, running Windows Server 2003, and IIS
or SQL Server 2000. In all experiments we used Application Center
Test [16] for the stress client.
We first evaluate the accuracy of Magpie's workload models using
traces taken with a synthetic workload. In contrast to the more
realistic operating conditions of Sections 7.1
and 7.2, the web site behaviour is calibrated to check
that we extract the same workload as was injected. These experiments
are intended to investigate the effectiveness of the request
canonicalization mechanism, together with the behavioural clustering
algorithm, to separate requests with different resource consumption.
Table 1:
Request types and
consumptions of primary resources.
|
Type | URL | Resource |
| A | longspin.aspx | 1 thread spins CPU 30ms |
| B | shortspin.aspx | 1 thread spins CPU 15ms |
| C | small.gif | Retrieve static image 12Kb |
| D | tiny.gif | Retrieve static image 5Kb |
| E | parspin.aspx | 2 threads spin CPU 15ms concurrently |
| F | rpcspin.aspx | 1st thread spins CPU 7.5ms, signal |
| | other thread and wait, spin CPU 7.25ms |
| | 2nd thread spins CPU 15ms |
|
The experiments were performed against a minimal ASP.NET website
written in C#. Each URL consumes resources as depicted in
Table 1. CPU is consumed within a tight loop of a
fixed number of iterations, and network bandwidth is used by
retrieving fixed size images.
Resource consumption
The string-edit-distance metric used by the clustering algorithm
treats events annotated with their resource usage as points in a
multi-dimensional space. To allow a more intuitive explanation of the
resulting clusters, we first present results where resource
consumption changes in only a single dimension. Concurrency is a
complicating factor, and so we examine how well the request extraction
and modelling tools perform, both under concurrent request invocations
and when concurrent operations take place within a single request.
We used the type A and type B requests of Table 1
(which differ only in their consumption of CPU cycles) to produce both
single-varietal workloads and mixtures, using either serialized
requests from a single client, or concurrent requests from 5 clients.
This gives a total of 6 different workloads, as listed in the
left-hand columns of Table 2. Note that even these
trivial requests exhibit fairly complex interactions between the
kernel and multiple worker threads--this is apparent in
Figure 6, which depicts a type B request.
|
Table 2:
Clusters produced from single and mixed
request type workloads consuming CPU only, for both concurrent
and serialized request invocations. Accntd CPU % is the
fraction of CPU consumed by the relevant process that was accounted
to individual requests. The Clusters Found column gives the
number of requests found in each cluster (from a total of 500
requests). Dia. and Min. Sep. are the average cluster diameter
and the distance to the centroid of the nearest other cluster,
respectively. Model Error refers to the difference in
resource consumption between the derived workload model and the
parsed requests.
|
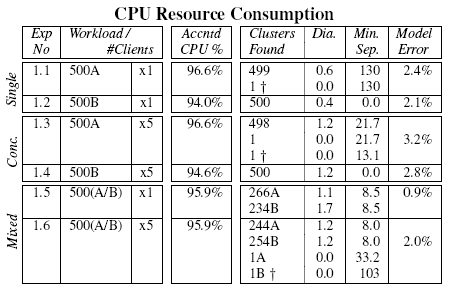 |
Table 2 records the clusters found from each of the
workloads. It also shows the average distance from the cluster
centroid of each request in the cluster (Dia.) and the
distance to the centroid of the nearest other cluster
(Min. Sep.). In experiments 1.1 and 1.2, 500 requests of type
A (longspin.aspx) and 500 requests of type B
(shortspin.aspx) each produced a large cluster. Repeating
these experiments with 5 concurrent stress clients produced very
similar results. The clusters produced under a concurrent workload
generally have a larger internal diameter than those for the
serial workload. Examining the distributions of total CPU consumed by
the individual requests shows that, as predicted by the clusters, the
concurrent workloads exhibit slightly larger spreads, probably due to
cache effects and scheduling overheads.
As a validation check, the total amount of CPU time accounted to
requests by the parser was summed and compared against the aggregate
CPU times consumed by processes and the kernel during the course of
each experiment. In Table 2, the column entitled
Accntd CPU % indicates the fraction of ``relevant'' CPU that
was accounted as request activity. Relevant CPU excludes that used by
background processes and the idle thread, but includes most kernel
mode activity and all user mode processing by the web server threads
(this information is directly available from the ETW event logs.) The
reported figures are less than 100% due to non-request related web
server activity such as health monitoring and garbage collection, and
also the difficulty of attributing all kernel mode CPU usage correctly
with the current kernel instrumentation.
The final column in Table 2 labelled ``Model
Error'', records how the resource consumption of the constructed
model differs from that actually measured. This figure is computed as
the percentage difference in resource consumption between the requests
as parsed, and a synthetic workload generated by mixing the cluster
representatives in proportion to their cluster sizes. In all cases,
the cluster sizes and representatives can be used to concisely
represent the experimental workload to within 3.2%.
As a useful cross-check, from experiment 1.1 we have a
centroid that represents the resource usage and control flow of
requests of type A, measured in isolation; from experiment 1.2
we have a similar centroid for requests of type B.
Table 2 shows that experiment 1.5 contains
requests with a 266/234 mix of type A and B requests, so we can
compare the CPU time consumed by all requests in experiment 1.5,
and the CPU time predicted by 266 type A centroids added to 234
type B centroids. The prediction falls short of the observed
value by just 3.5%, presumably due to worse cache locality.
Repeating this computation for experiment 1.6, the deficit is 3.4%.
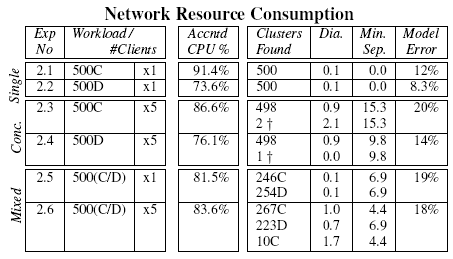
Table 3:
Clusters produced from single and mixed
request type workloads differing primarily in consumption of
network bandwidth, for both concurrent and serialized request
invocations. See the Table 2 caption for
explanation of the column headings.
|
Table 3 shows the results obtained using workloads
based on request types C and D, which differ in consumption of network
bandwidth. The Accntd CPU % figures are noticeably lower
for these experiments. However this is not surprising since it is
common when load increases for multiple incoming network packets to be
processed in the same deferred procedure call. Although 100% of the
network packets are correctly ascribed to requests, there are places
where insufficient instrumentation is present to safely account
computation to an individual request. In these cases, the parser errs
on the conservative side.
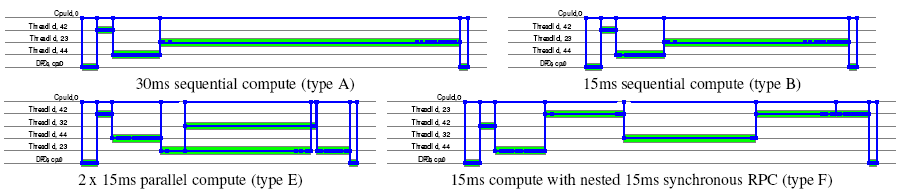
Figure 11:
Canonical versions of
four compute-bound HTTP requests with different internal
concurrency structure.
|
Figure 11 shows canonical versions of the four
compute bound requests of Table 1 with very different
internal structure. The first two requests (A and B) perform
sequential computations of different lengths, the third (E) performs
the same amount of work as B, but in two parallel threads. The fourth
request (F) also consumes the same amount of resource as B, but this
time using a synchronous RPC-style interaction with a second worker
thread.
Whilst three of these requests consume exactly the same amount of CPU
resource, they would have significantly different behaviour on a
multiprocessor machine from a response time or latency
perspective. When extracting workload models, we believe it is
important to capture these differences in concurrency structure.
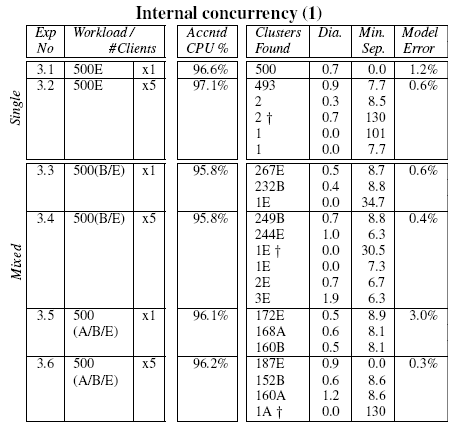
Table 4:
Clusters produced from single and mixed request
type workloads consuming CPU only, where the request contains
internal concurrency, for both concurrent and serialized request
invocations. See the Table 2 caption for
explanation of the column headings.
|
Table 5:
Clusters produced from single and mixed request
type workloads consuming CPU only, where the request contains
internal concurrency and blocking, for both concurrent and
serialized request invocations. See the Table 2
caption for explanation of the column headings.
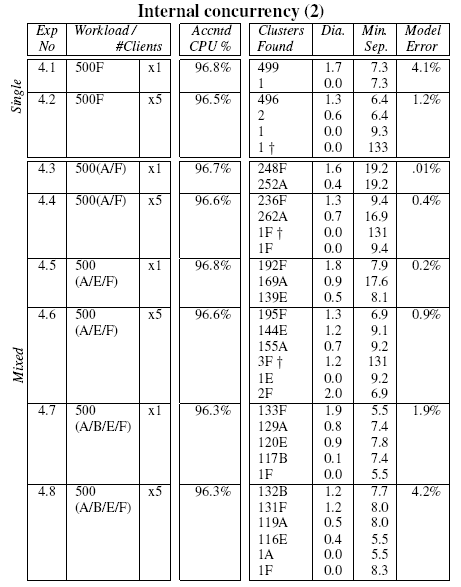
|
Tables 4 and 5 show
the clustering results of a suite of experiments constructed using
various combinations of the requests described above. From the
tables, it is clear that our distance metric and clustering algorithm
are capable of separating requests that differ only in internal
concurrency structure. Note in particular, experiment 4.8 of
Table 5, where the 4 request types fall
into 4 well separated clusters, with just 2 outliers.
An anomaly detection example
In several of the above experiments, we noticed occasional
unexpected outlier requests, which were always placed in a
cluster on their own (marked with a  in result tables).
Examination of these individual requests revealed that in every
case a 100ms chunk of CPU was being consumed inside a DPC.
Using sampling profiler events logged by ETW during the
offending intervals the problem was tracked down to a 3Com
miniport Ethernet driver calling
KeDelayExecution(100000)3 from its
transmit callback function! in result tables).
Examination of these individual requests revealed that in every
case a 100ms chunk of CPU was being consumed inside a DPC.
Using sampling profiler events logged by ETW during the
offending intervals the problem was tracked down to a 3Com
miniport Ethernet driver calling
KeDelayExecution(100000)3 from its
transmit callback function!
The above example gives some concrete proof that Magpie can
highlight apparently anomalous behaviour using extracted
requests. Other common causes of outlier requests include JIT
compilation, loading shared libraries, cache misses and genuine
performance anomalies. Being able to identify and isolate these
outliers is an advantage for accurate workload modelling.
Evaluation
We now turn to an evaluation of the toolchain with more realistic
scenarios: a small two-tier web site and an enterprise-class database
server.
Duwamish
In this section we extract requests from a distributed system and look
at the accuracy of the derived workload model. The experimental setup
is a two machine system running the Duwamish bookstore, a sample
e-commerce application that is distributed with Visual Studio. We
augmented the Duwamish database and the images stored at the web
server with auto-generated data in accordance with the volume and size
distributions mandated by TPC-W [21].
As in previous experiments, we first obtained results when all
requests have the same URL, and then looked at the clusters produced
from a mixed workload. Three dynamic HTML URLs were used, each with
different characteristics:
- The book.aspx page invokes a single database query
to retrieve a book item and look up its associated data such as
author and publisher. An image of the book cover may also be
retrieved from the web server file system.
- The categories.aspx page retrieves the details
associated with the specified category by making three RPCs to the
database.
- The logon.aspx URL runs only on the web server.
Table 6:
Clusters found from
Duwamish requests, with both single and mixed URL workloads. Results
are shown from clustering the workloads from individual machines (WEB
and SQL) as well as ``end-to-end requests'' across both (E2E).
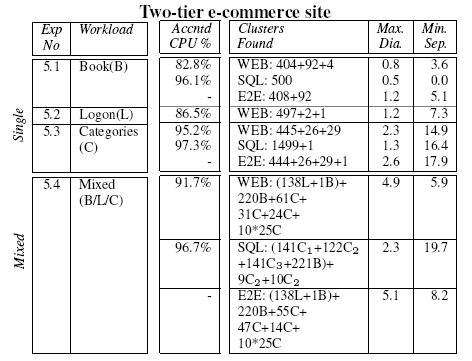
|
As described in Section 4, a stitcher matches
packet events within request fragments from individual machines to
produce a single canonical form of the request across multiple
machines. Table 6 shows the results of clustering on
the WEB and SQL fragments alone, as well as on the entire request.
For clarity, we have reported just the maximum cluster diameter and
the minimum inter-cluster separation of each set of clusters. Similar
to previous experiments, we report the fraction of relevant CPU that
was included in the extracted requests in the ``Accntd CPU%''
column.
Closer inspection of the resulting clusters reveals that the
book requests are primarily differentiated by
whether a disk read is performed on the web server (to fetch an image of the book
cover). On the
categories page, the amount of network traffic varies between
categories and hence one major and two minor clusters are formed. The
three stored procedures invoked by
categories.aspx--GetCategories(), GetBooksByCategoryId() and
GetDailyPickBooksByCategoryId()--are identified in the table as
C1, C2 and C3 respectively. All of these database request
fragments bar one for this URL are put in the same cluster. According
to the SQL Server Query Analyzer tool, the stored procedures are all of
similar cost, so this is not surprising. The clusters for the mixed
workload show that the
book and logon pages form tighter clusters than the
categories requests, which are spread across several clusters. These
results indicate that a workload model based on per-URL measurements
will be less representative than one constructed by grouping similar
requests according to their observed behaviour.
TPC-C
The TPC-C benchmark [20] results presented in this section were
generated using the Microsoft TPC-C Benchmark Kit v4.51 configured
with 10 simultaneous clients and a single server. The resulting
database would normally fit entirely in the memory of a modern
machine. We therefore ran SQL Server with restricted memory to more
accurately reflect the cache behaviour of a realistically dimensioned
TPC-C environment.
Table 7:
Clusters formed from TPC-C
workload. The workload is a constrained ratio mix of 6
different transaction types shown in the key. The additional
column d (0) shows the distance of each cluster centroid from
the null request and gives an indication of the amount of
resource consumption (largely disk I/O in this case).
|
TPC-C benchmark |
| # | Size | Contents | d (0) | Dia. | Min. Sep. |
| 1 | 751 | 620B+100F+30D+1A | 54.30 | 0.025 | 9.264 |
|
2 | 392 | 329A+56E+7D | 105.05 | 0.119 | 14.393 |
|
3 | 302 | 266A+30D+3B+3E | 29.16 | 0.116 | 9.264 |
|
4 | 30 | 30C | 555.45 | 9.596 | 81.251 |
|
5 | 21 | 21C | 111.03 | 4.870 | 78.080 |
Key:
|
A neworder | B payment | C stocklevel |
|
D orderstatus | E delivery | F version |
|
The clustering algorithm created 5 clusters from1496 requests. The clusters are quite tightly formed (they have
low intra-cluster distances, Dia.) and well separated (they
have high inter-cluster distances, Sep.). Although clusters 4 and 5
have somewhat higher intra-cluster distances, they are so well separated from any
other cluster that this is unimportant.
Examining the make-up of the clusters reveals that the amount of
I/O performed is the dominant factor in deciding the cluster for
a request. Cluster 1 contains all version transactions
and 99% of payment transactions, none of which have any
I/O. Cluster 2 contains 95% of delivery transactions
and 55% of neworder transactions: these are the
transactions with a small amount of I/O. Cluster 3 holds the
remaining 45% of neworder transactions, all of which
have a moderate amount of I/O. The orderstatus
transactions are split 45%/10%/45% between clusters 1-3
based on the I/O they contain. Finally, clusters 4 and 5
contain all the stocklevel transactions, predicted to be
nearly 3 orders of magnitude more expensive than the next most
expensive transaction by SQL Server Query Analyzer.
Although the above clusters represent a reasonable summary of
the benchmark workload in the experimental configuration, they
also expose an area requiring further attention. In many
applications, and especially in database servers, a shared
buffer cache is the dominant factor affecting performance. Our
instrumentation does not yet record cache and memory references,
observing only the disk I/O associated with cache misses and log
writes. Given the explicit SQL buffer cache API it would be a
simple matter to record the locality and sequence of pages and
tables referenced by each query. We believe that this extra
information will better distinguish between transaction types
and may allow us to predict miss rates with different cache
sizes as described in [15], but this remains an area
for future work.
Related work
The most closely related work to Magpie is
Pinpoint [8]. Pinpoint collects end-to-end traces
of client requests in a J2EE environment by tagging each call with a
request ID. This is simpler than using event correlation to extract
requests, but requires propagation of a global request ID, which is
not always possible with heterogeneous software components. The aim
of Pinpoint is to diagnose faults by applying statistical methods to
identify components that are highly correlated with failed requests.
This is in contrast to the Magpie goal of recording not only the path
of each request, but also its resource consumption, and hence being
able to understand and model system performance.
Aguilera et al. [1] have proposed
statistical methods to derive causal paths in a distributed
system from traces of communications. Their approach is
minimally invasive, requiring no tracing support above the RPC
layer. However, by treating each machine as a black box, they
sacrifice the ability to separate out interleaved requests on a
single machine, and thus cannot attribute CPU and disk usage
accurately. The approach is aimed at examining statistically
common causal paths to find sources of high latency. Magpie's
request parsing on the other hand captures all causal paths in a
workload, including relatively rare (but possibly anomalous)
ones.
Distributed event-based monitors and
debuggers [2,4,13] track
event sequences across machines, but do not monitor resource usage,
which is essential for performance analysis. Conversely, many systems
track request latency on a single system but do not address the
distributed case. TIPME [9] tracked the latency of interactive
operations initiated by input to the X Window System. Whole Path
Profiling [14] traces the control flow patterns
between basic blocks in a running program.
Similar approaches on different operating systems include the Linux
Trace Toolkit [22], which tracks request latency on a
single machine. The Magpie toolchain could easily be built to consume
LTT events instead of ETW events. A more sophisticatd instrumentation
framework is Solaris DTrace [6], which allows arbitrary
predicates and actions to be associated with instrumentation points.
DTrace provides an option for speculative tracing, which could
potentially be a lightweight mechanism for enabling request sampling.
Chen and Perkowitz [7] measure web application
response times by embedding JavaScript in the web pages being
fetched, i.e. by modifying the content being served rather than
instrumenting client or server code. The aggregated data gives a
view of client-side latency that would complement the detailed
server-side workload characterisation obtained using Magpie.
Conclusion
In this paper we described the Magpie toolchain that takes stand-alone
events generated by operating system, middleware and application
components, correlates related events to extract individual requests,
expresses those requests in a canonicalized form and then finally
clusters them to produce a workload model. We validated our approach
against traces of synthetic workloads, and showed that our approach is
promising for more complicated applications.
We have shown that by using Magpie to isolate the resource demands
and the path taken by requests, we can construct stochastic
models that give a good representation of a workload's
behaviour. A great advantage of Magpie is that these request
structures are learnt by observing the live system under a
realistic workload. As a consequence, the parsed event trace of
each individual request is recorded, giving a detailed picture
of how requests are actually being serviced within the system.
We gratefully acknowledge the encouragement and insightful
comments of our shepherd Eric Brewer, and many proof-readers
especially Steve Hand, Tim Harris and Andrew Herbert. Thanks also to
Dushyanth Narayanan and James Bulpin for past contributions to the
Magpie project.
- 1
-
M. K. Aguilera, J. C. Mogul, J. L. Wiener, P. Reynolds, and A. Muthitacharoen.
Performance debugging for distributed systems of black boxes.
In Proc. 19th ACM Symposium on Operating Systems Principles
(SOSP'03), pages 74-89, Oct. 2003.
- 2
-
E. Al-Shaer, H. Abdel-Wahab, and K. Maly.
HiFi: A new monitoring architecture for distributed systems
management.
In Proc. IEEE 19th International Conference on Distributed
Computing Systems (ICDCS'99), pages 171-178, May 1999.
- 3
-
P. Barham, R. Isaacs, R. Mortier, and D. Narayanan.
Magpie: online modelling and performance-aware systems.
In 9th Workshop on Hot Topics in Operating Systems (HotOS
IX), pages 85-90, May 2003.
- 4
-
P. C. Bates.
Debugging heterogeneous distributed systems using event-based models
of behavior.
ACM Transactions on Computer Systems (TOCS), 13(1):1-31, 1995.
- 5
-
H. Bunke.
Recent developments in graph matching.
In Proc. 15th International Conference on Pattern Recognition,
pages 117-124, 2000.
- 6
-
B. M. Cantrill, M. W. Shapiro, and A. H. Leventhal.
Dynamic instrumentation of production systems.
In Proc. USENIX Annual Technical Conference, pages 15-28,
June 2004.
- 7
-
J. B. Chen and M. Perkowitz.
Using end-user latency to manage internet infrastructure.
In Proc. 2nd Workshop on Industrial Experiences with Systems
Software WIESS'02, Dec. 2002.
- 8
-
M. Y. Chen, A. Accardi, E. Kiciman, J. Lloyd, D. Patterson, A. Fox, and
E. Brewer.
Path-based failure and evolution management.
In Proc. 1st Symposium on Networked Systems Design and
Implementation (NSDI'04), pages 309-322, Mar. 2004.
- 9
-
Y. Endo and M. Seltzer.
Improving interactive performance using TIPME.
In Proc. ACM SIGMETRICS, June 2000.
- 10
-
D. Gao, C. S. Jensen, R. T. Snodgrass, and M. D. Soo.
Join operations in temporal databases.
Technical Report TR-71, TIMECENTER, Oct. 2002.
- 11
-
R. Isaacs, P. Barham, J. Bulpin, R. Mortier, and D. Narayanan.
Request extraction in Magpie: events, schemas and temporal joins.
In 11th ACM SIGOPS European Workshop, Sept. 2004.
- 12
-
J.O.Kephart and D.M.Chess.
The vision of autonomic computing.
IEEE Computer, 36(1):41-50, Jan. 2003.
- 13
-
J. Joyce, G. Lomow, K. Slind, and B. Unger.
Monitoring distributed systems.
ACM Transactions on Computer Systems (TOCS), 5(2):121-150,
1987.
- 14
-
J. R. Larus.
Whole program paths.
In Proc. ACM conference on Programming Language Design and
Implementation (SIGPLAN'99), pages 259-269, June 1999.
- 15
-
R. Mattson, J. Gecsei, D. Slutz, and I. Traiger.
Evaluation techniques for storage hierarchies.
IBM Systems Journal, 9(2):78-117, 1970.
- 16
-
Microsoft Application Center Test 1.0, Visual Studio .NET Edition.
https://msdn.microsoft.com/library/default.asp?url=/library/en-us/act/
htm/actml_main.asp, May 2004.
- 17
-
Microsoft Corp.
Event Tracing for Windows (ETW).
https://msdn.microsoft.com/library/en-us/perfmon/base/event_tracing.asp,
2002.
- 18
-
I. Park and M. K. Raghuraman.
Server diagnosis using request tracking.
In 1st Workshop on the Design of Self-Managing Systems, held in
conjunction with DSN 2003, June 2003.
- 19
-
F. Risso and L. Degioanni.
An architecture for high performance network analysis.
In Proc. 6th IEEE Symposium on Computers and Communications,
pages 686-693, July 2001.
- 20
-
Transaction Processing Performance Council.
TPC Benchmark C (On-line Transaction Processing)
Specification.
https://www.tpc.org/tpcc/.
- 21
-
Transaction Processing Performance Council.
TPC Benchmark W (Web Commerce) Specification.
https://www.tpc.org/tpcw/.
- 22
-
K. Yaghmour and M. R. Dagenais.
Measuring and characterizing system behavior using kernel-level event
logging.
In Proc. USENIX Annual Technical Conference, June 2000.
Using Magpie for request extraction and workload modelling
This document was generated using the
LaTeX2HTML
translator Version 2K.1beta (1.47)
The output figures and HTML was subsequently manually hacked-on by
Austin Donnelly to make it looks something like the original.
In case of discrepancies between this document and the PDF, trust
the PDF.
Copyright © 1993, 1994, 1995, 1996,
Nikos Drakos,
Computer Based Learning Unit, University of Leeds.
Copyright © 1997, 1998, 1999,
Ross Moore,
Mathematics Department, Macquarie University, Sydney.
The command line arguments were:
latex2html -split 0 -html_version 4.0,math,table -nonavigation paper.tex
The translation was initiated by on 2004-10-01
Footnotes
- ...attributes1
- All events with the same identifier have the
same set of attributes.
- ...
table2
- Hence the n-way relational join to find all events in a
request would have to span multiple valid-intervals over multiple
tables.
- ... KeDelayExecution(100000)3
- This function is
implemented as a busy wait and the documentation clearly states
it should not be used for delays of more than 100us.
2004-10-01
|

![\includegraphics[width=\figurewidth,keepaspectratio]{pipeline.eps}](img1.png)
![\includegraphics*[width=\columnwidth]{instr.eps}](img2.png)
![\includegraphics*[width=8cm]{eventjoin3.eps}](img3.png)
![\includegraphics*[width=8cm]{eventjoin_res.eps}](img5.png)
![\includegraphics*[height=8.5cm]{req30apr30.1.eps}](img6.png)