
| ||||||||||||||||||||||||||||||||||||||||||||||||||||
|
LISA 2001 Paper
[LISA '01 Tech Program Index]
Performance Evaluation of Linux Virtual ServerAbstractLinux Virtual Server (LVS) is an open source technology which can be used to construct a scalable and highly available server using a collection of real servers. LVS load balances a variety of network services among multiple machines by manipulating packets as they are processed by the Linux TCP/IP stack. One of the most common roles for LVS is to act as a front end to a farm of web servers. This paper documents a series of experiments performed on LVS by Mission Critical Linux, Inc. in a cooperative effort with Intel Corporation. The objective of these experiments was to evaluate LVS's ability to distribute web requests among several servers. We investigated a variety of LVS configurations and offer a comparison of LVS's ability to scale on Linux 2.2 versus Linux 2.4. In contrast to similar evaluations, our entire test effort was accomplished using open source software on Linux based platforms. Our results show that in a uni-processor environment the performance of LVS on Linux 2.4 is on par with Linux 2.2, however in a multi-processor configuration, Linux 2.4 significantly surpasses Linux 2.2. LVS on Linux 2.2 actually exhibits minimal scaling in a multi- processor environment. We reveal the detrimental impact that multiple devices sharing interrupts can have on LVS throughput. A comparison of LVS to a commercial load balancer indicates that LVS is a viable alternative to the more expensive, proprietary solution. Our results show that LVS is nearly twice as cost effective in terms of price/performance when compared to the hardware based load balancer. Lastly, we document the steps necessary to enhance the capabilities of our load generator which in turn reduces the amount of client hardware needed. IntroductionLinux Virtual Server [1] is an enhancement to the Linux operating system which permits a set of servers to offer network services (e.g., ftp, http, ...) as a single virtual server. The aggregate capabilities of the individual hosts, or real servers, [Note 1] comprising the LVS cluster often exceed those of any one of the constituent systems as a stand alone entity. Reliability is also increased because services are backed by multiple machines, thereby avoiding the single point of failure one would have with a single server. Although LVS benefits from a very active user community, there seems to be a void in the reporting of concrete performance data. This paper documents a series of experiments Mission Critical Linux, Inc. performed on LVS in order obtain a basic understanding of LVS's performance and scalability. One of the most common roles for LVS is to load balance HTTP requests [2], thus our primary focus was on the ability of LVS to distribute a prescribed workload among a set of backend web servers. A secondary objective was to get a sense of how well LVS compared to some of the commercially available, hardware based load balancers. Linux Virtual Server OverviewThis section is a brief overview of the LVS architecture and provides a background for the ensuing discussion. Please refer to Zhang [1] for a more complete and thorough discussion of LVS's internals. An LVS cluster is made up of a director and one or more real servers. The LVS director is a modified Linux system whose responsibility is to distribute client requests among the real servers in a cluster. The real servers do the actual work of satisfying the request and generating a response back to the client. The director maintains a record of the number of requests being handled by each server and uses this information when deciding which server should receive the next request. An LVS cluster may also have a backup director which will take over in the event the primary director fails, however for the purposes of this report, we did not consider LVS's failover capabilities. The real server can run any operating system and application which supports TCP/IP and ethernet. [Note 2] Additional restrictions may be placed on the real servers depending upon the LVS configuration chosen. LVS Configuration MethodsLVS employs several techniques for distributing IP packets among nodes in the cluster. One method uses network address translation (LVS-NAT) in which the headers of the packets are overwritten by the director. The director masquerades as the real server(s) and this creates the illusion that the real servers are being contacted directly by the clients. The director must be the real servers' default gateway for an LVS-NAT configuration to work properly. As a result, every response from a server is returned to the client via the director. Although this scheme is sub-optimal from a performance perspective, it does have the benefit that the real server can run any operating system that supports TCP/IP.
A second LVS configuration uses direct routing (LVS-DR). As the name implies, each real server has an independent route back to the clients (i.e., internet) which is separate from the director. LVS-DR offers a significant performance advantage over LVS-NAT, but with some added complexity in configuring the cluster. Each node in the cluster is assigned the IP address of the virtual server (aka the VIP), but only the director is permitted to respond to address resolution protocol (ARP) requests (as a result all packets originating from the clients will be initially processed by the director). LVS-DR requires that the operating system on all real servers support this non-ARPing network interface in addition to TCP/IP. The third and final method uses IP encapsulation, or IP tunneling (LVS-TUN), in which a packet intended for the virtual server is enclosed in another packet and retargeted to one of the real servers. As with LVS-DR, the responses from the servers do not need to return via the director and so LVS-TUN offers performance and scaling similar to that of LVS-DR. Some operating systems may not support IP tunneling, therefore an LVS-TUN configuration restricts the realservers to running one that does. Tunneling allows the LVS administrator to put servers on separate network segments, whereas this is not possible with a direct routing configuration. We used a Gb Ethernet as our server network to avoid network congestion issues and consequently our experiments only concentrated on LVS-NAT and LVS-DR based configurations. Figure 1 provides a comparison of the differences between the various LVS configurations. Scheduling Client RequestsClient requests are distributed among the real servers based on IP address, protocol (i.e., TCP, UDP) and port number; commonly referred to as Layer 4 switching. LVS supports several different scheduling algorithms that are settable during the configuration of the LVS cluster. The scheduler is responsible for determining which real server will receive the next client request. The simplest scheduler is round robin which simply circulates requests among each real server in a round robin fashion. All the LVS configurations in our testing used the round robin scheduler since every real server had similar attributes (e.g., CPU speed, memory, network connectivity). Refer to LVS documentation [4] for a complete and thorough discussion of all the LVS scheduling algorithms available. Test EnvironmentOne of the most challenging aspects of this project was devising a hardware and software configuration capable of stressing the director. The hardware vendors and trade magazines that have reported results to date appear to use either closed tools or hardware based solutions (e.g., such as SmartBits) for generating a client workload [5] [6]. The only multi-client Linux based tool we came across was a tool called 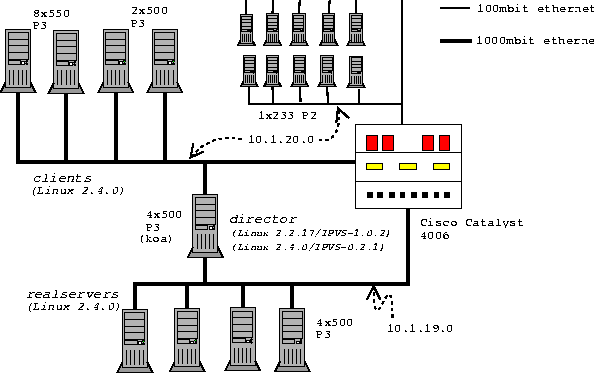 Tarantula developed by Arrowpoint Communications [7], but unfortunately this tool is not in public domain. We wanted a rather simple client workload so we could focus our attention on the LVS director, as opposed to tuning the web server software, therefore we avoided a complex workload generator such as SpecWeb. Hardware ConfigurationLVS DirectorThe hardware selected as the LVS director was chosen because we felt it was representative of a ``typical'' server based system on the market today. The system was configured with 512 MB SDRAM, 1-4 500 MHz Intel Pentium III Xeon Processors (512 KB L2 cache) and the ServerWorks* ServerSet II HE chipset. The director was equipped with two Intel PRO/1000 F Gb ethernet cards, each connected to a single Cisco Catalyst 4006 switch, which also acted as a gateway between the server and client subnets (see Figure. 2). Real ServersThere were between one and four real servers, three of them contained four 500 MHz Pentium III CPUs and one had four 550 MHz Pentium III CPUs using the SC450NX motherboard/chipset. Each system was booted with one gigabyte of RAM and an Intel PRO/1000 F Gb Ethernet card connected to the Cisco Catalyst 4006 switch. ClientThere were two sets of clients. The first set consisted of four systems and was connected to the Catalyst 4006 using Gb Ethernet (two via Intel PRO/1000 F and two). Two of these contained eight 550 MHz Intel Pentium III Xeon Processors with Intel's Profusion chip set and one gigabyte of memory. The other two were dual 500 MHz Intel Pentium III Xeons, one gigabyte memory with the L440GX motherboard/chip set. The second set of clients was ten 233 MHz Pentium II CPUs, 128 MB of RAM connected to the Catalyst 4006 via 100 Mb eepro100 cards. Network InfrastructureThe test environment consisted of two network segments with the Cisco Catalyst switch acting as the gateway between them. The server network was a Gb Ethernet and each server was directly connected to a Gb port on the Cisco switch. The clients with Gb cards were also connected to Gb ports on the 4006 switch, while the remaining ten Pentium II clients were connected into 100 Mb ports on the Catalyst. Software ConfigurationWe installed Redhat's 6.2 distribution of Linux (which is based on version 2.2.14 of the Linux kernel) on each of the systems. Some initial network [8] testing (Figure 3) indicated we could achieve better throughput using a 2.4 based kernel. Figure 3 shows the results of a connectivity test between one of the eight way clients and the LVS director node. These tests were run with each machine connected via the Cisco switch with an MTU of 1500 bytes, as opposed to a back to back test (in which the two hosts are connected directly two each other). The plots show the network throughput as packet size is increased from one byte to a maximum of twelve megabytes. The ``2.2'' curve reports the results with each system running Linux 2.2.14, while the plot labeled ``2.4'' is with each machine running Linux 2.4.0. The PRO/1000 cards were in 64 bit/66 MHz PCI slots on each system for these tests. The ``100 Mb netpc'' shows the Pentium II based clients are capable of saturating their 100 Mb link to the Cisco switch. 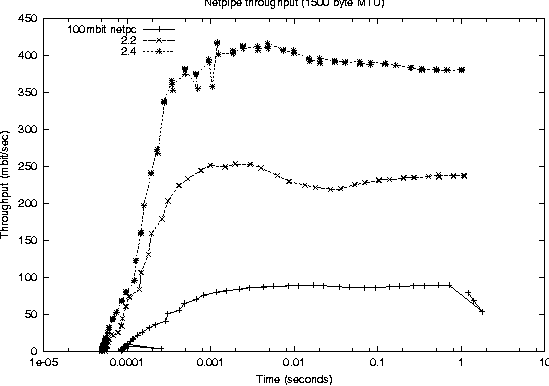 As a result of these connectivity tests we installed version 2.4.0 of the Linux kernel on each client and real server. This also required us to upgrade to revision 2.4.0 of the modutils package. A minor patch was also required in order to get the the e1000 device driver to load on 2.4.0. Figure 4 summarizes the versions of the major software components installed on the test hardware. Director SoftwareAlthough Redhat bundles a version of LVS with its distributions, we preferred to use a later version of the LVS software as well as a newer kernel. We used the latest 2.2 kernel available at the time we began our testing which was Linux 2.2.17 with version 1.0.2 of LVS. For testing a 2.4 based director we used a 2.4.0 kernel with LVS version 0.2.1. The LVS software was linked directly into the kernel for both 2.2 and 2.4 based directors. Client Workload GeneratorA key element to testing web based systems is the software used to generate client requests. We wanted the software to be lightweight so that a high number of requests could be initiated using a minimum number of clients. We also preferred to use an existing tool, rather than create our own so we could report the results of a ``known entity,'' and last but not least an open source tool was desirable. Julian Anastasov created a very efficient tool for stressing an LVS director called testlvs [9]. Testlvs is capable of simulating a large number of clients making connection requests by sending raw IP packets with spoofed source addresses. The connections are never fully established and as a result valid web requests are never actually made of the real server(s). We found it difficult to report a metric using testlvs, therefore we opted not to take advantage of it.
David Mosberger and Tai Jin created a tool called httperf [10] which is designed to measure web server performance. Httperf issues connection requests to a web server at a specified rate and measures the actual reply rate along with various other metrics (e.g., average response time, percent of connections in error, network throughout, ...). On a server capable of sustaining the offered connection rate, the number of replies will equal the number of requests and these replies will be received within the specified time- out period. Httperf provides many options to control its behavior, but it has no facility for being executed on multiple clients which made running it on fourteen clients simultaneously cumbersome. Therefore we created a small utility which would execute httperf on each client, wait for it to finish and collect the output into one central log. Testing MethodologyThe objective of this section is to offer an accurate and clear understanding of how these experiments were conducted. Our primary goal was to stress the LVS software (i.e., the director node) and so we attempted to keep our workload as simple as possible. As a result we explicitly avoided some parameters which are otherwise very important to the overall performance of a web farm. The clients were restricted to requests based on the HTTP 1.0 protocol. Each request was for the same web page which ensured that the web data would remain in the server's file cache, thereby eliminating any idiosyncrasies of file I/O on the web servers. The requested page was small enough (628 bytes) to be transmitted in a single packet without the need for fragmentation (given an MTU of 1500 bytes). We recognize that a more comprehensive test suite must address issues like HTTP 1.1, requests for variable sized data and complexities such as dynamic content. Introducing all of these features would have made it much more difficult to evaluate LVS's ability to load balance web requests due to the additional variables in the mix. This is also the reason why a comprehensive web benchmark like SpecWeb was not used to generate the work load. Apache TuningThe Apache configuration file on each real server was altered to disable logging and to keep a sufficient number of httpd daemons available so as to minimize overhead in responding to client requests. Below are the Apache tunables altered:
#CustomLog /var/log/httpd/access_log \
     common # turn off logging
LogLevel crit
MinSpareServers 200
MaxSpareServers 200
MaxClients 1500
MaxRequestsPerChild 0
     # servers never go away
Linux TuningThe amount of socket memory on each system (client, director and real server) was increased to five megabytes to allow for a large TCP window size: echo 5242880 > /proc/sys/net/core/rmem_max echo 5242880 > /proc/sys/net/core/rmem_default echo 5242880 > /proc/sys/net/core/wmem_default echo 5242880 > /proc/sys/net/core/wmem_maxIn order to maximize the number of concurrent connections a given client could create it was necessary to increase the number of per- process file descriptors as well as system wide limit on files and local port numbers:
ulimit -n 100000
sysctl -w 'fs.file-max=150000'
sysctl -w 'fs.inode-max=32768'
sysctl -w 'net.ipv4.ip_local_port_range=1024 \
                                      40000'
LVS ConfigurationAll web servers were essentially the same type of hardware and so we always configured them as being equal in weight. The clients all requested the same web content and we did not experiment with the various LVS scheduling algorithms; we simply stayed with round robin. We avoided extensive testing on a 2.2 based director in an SMP configuration because earlier network testing done at Mission Critical Linux found additional processors did not improve network scalability on Linux 2.2. We also did not test a 2.4 LVS-NAT configuration because we had difficulty getting the director to successfully masquerade for the real servers, which turned out to be a known limitation of LVS in 2.4. A workaround for LVS-NAT has since been provided in ipvs-0.2.2, but unfortunately time did not permit us to re-run our tests. httperfHttperf was run on each client machine such that the desired connection rate was distributed evenly among all fourteen clients. Each run lasted three minutes as suggested by [10] so the server farm could reach steady state. The client time out specified was one second, thus if a connection was not established within that period it would be flagged as an error. The offered connection rate was increased on each client until we reached the maximum amount of connections any given system was capable of sustaining. This resulted in the largest aggregate connection rate our test bed could sustain as 14140 connections per second, or approximately 1010 connections per second, per client. This seemingly artificial barrier is the result of a limitation of the __FD_SETSIZE macro in /usr/include/bits/types.h which restricts the number of files (i.e., connections) to 1024. [Note 3] Fortunately a connection rate of 14140 connections per second was sufficient to saturate all tested LVS configurations with the exception of the four processor, four real server 2.4 LVS-DR configuration. The aggregate reply rate was calculated by summing the individual reply rates reported by each client. Each data point was repeated three times to account for any aberrations and the results reported below represent the mean of these three runs. It was also necessary to delay 120 seconds between each iteration to allow for any lingering connections to leave the TIME_WAIT state. ResultsThe results in this section are based on a series of test runs as shown in Figure 5. Some additional workloads were done on specific configurations in order to gain further understanding of a particular result. As a control we also ran the workload directly against a single web server without LVS. This served to provide baseline data so we could easily evaluate the impact of LVS. It should be noted a second control case would be with the director node forwarding packets without LVS, however we did not investigate this due to time constraints.
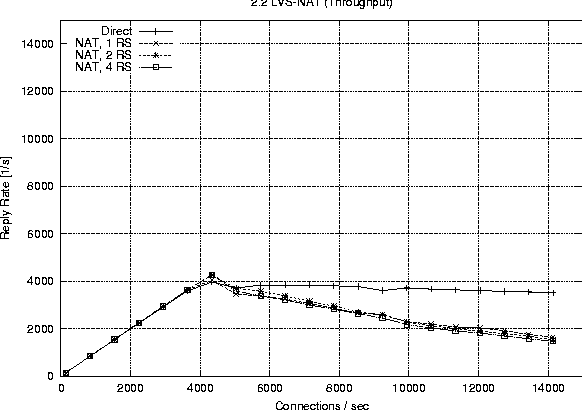 Linux 2.2Figure 6 shows the behavior of a single processor director running 2.2.17 with one, two and four real servers respectively. The plot labeled ``Direct'' represents the reply rate sustained by a stand alone web server running the configuration. The direct and LVS-NAT curves both peak at around 4000 connections per second, but we see that with LVS-NAT the sustained workload is less. This is a result of the extra overhead associated with LVS-NAT, i.e., the fact that return packets from the real server must pass through the director. The reason additional real servers offer no benefit is because one alone is sufficient to saturate the director, therefore we cannot take advantage of the extra servers. Figure 7 reports on the LVS-DR configuration running on a single CPU, 2.2.17 based director. LVS-DR with a single real server (``DR, 1 RS'') appears to be on par with the direct case. The addition of a second real server (``DR, 2 RS'') provides a jump from about 4000 connections per second to approximately 6700 connections per second. This increase can be explained by our observation that a single web server saturates at 4000 connections with the small request size chosen, but the additional server allows us to distribute the load among two servers. Hardly any improvement at all is seen when we increase the number of real servers from two to four (``DR, 4 RS''). Based on subsequent results seen with a 2.4 SMP based director, we suspect we are hitting a limit on the packet processing ability of the single CPU in the director. When describing our test methodology we noted that we did not expect linear scaling as more processors were added to a 2.2 based director. To verify this we performed a test on the largest 2.2 configuration we had available (four CPUs, four real servers) and compared that to a single processor director with the same number of servers. Figure 8 shows the results of this test and we do see only a marginal improvement. The reason for such a small improvement is that much of the networking code in Linux 2.2 still executes under the auspices of the global kernel lock. For all intents and purposes the 2.2 TCP/IP code is really running on one CPU, however there still are moments when other useful work can be accomplished with the additional CPUs, therefore we do see a small improvement. 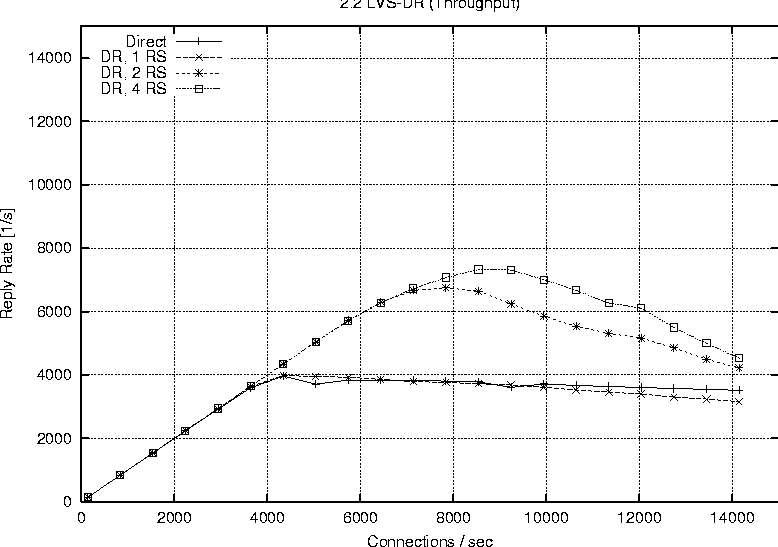 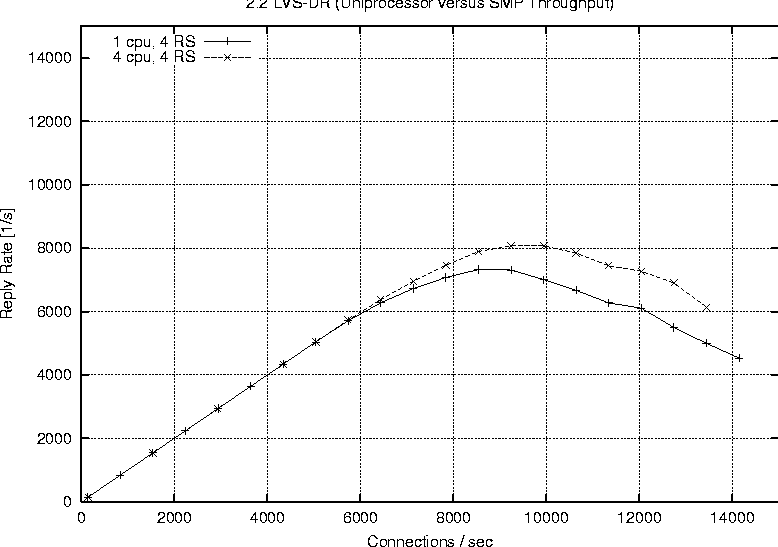 Finally Figure 9 combines all the 2.2 based runs so we can easily view a comparison of LVS-NAT versus LVS-DR capabilities. As expected we can sustain a significantly higher connection load with an LVS-DR based configuration than is possible with LVS-NAT. Linux 2.4Figure 10 shows the connection rate sustainable by a 2.4 based director using LVS-DR. As a baseline we again include the case of running directly against the web server without LVS (``Direct'') and show the impact of adding one, two and four real servers; curves ``DR, 1 RS,'' ``DR, 2 RS,'' ``DR, 3 RS'' respectively. This graph is similar to that of the 2.2 LVS-DR seen in Figure 7 and we see just how close they are in Figure 11. 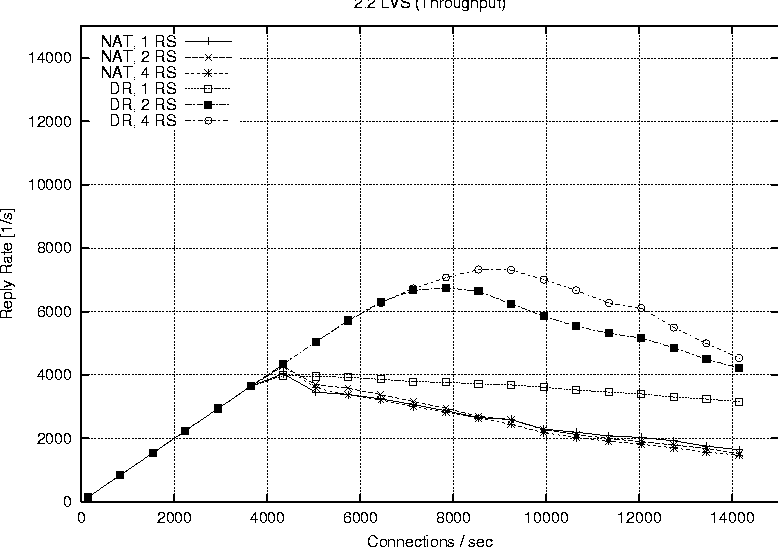 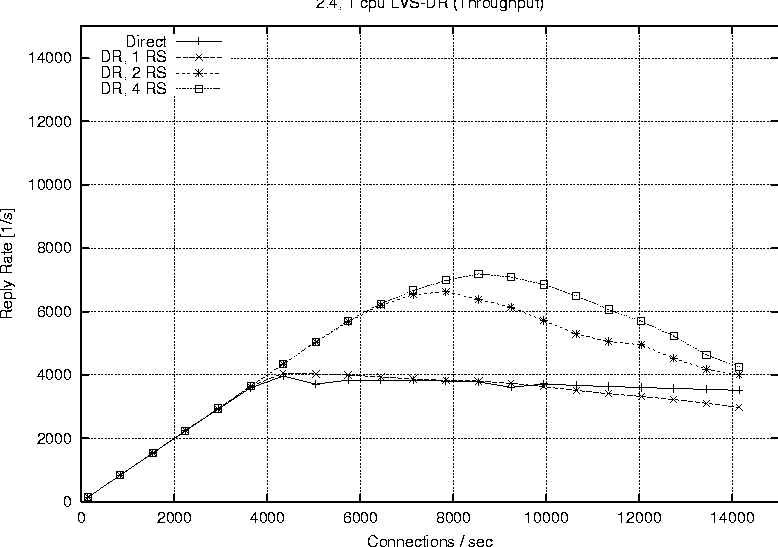 Figure 11 indicates that a single processor 2.4 based LVS-DR configuration is very close in performance to that of a 2.2 based director, in fact it shows 2.2 is slightly better than 2.4. Joseph Mack pointed out this slow down is because LVS in 2.4 is implemented via the hooks provided by the Netfilter subsystem, whereas in 2.2 LVS ran independently, i.e., the LVS patch was applied directly to the Linux IP networking code. According to the data we collected, one of our single web servers can sustain a connection rate of approximately 4000 connections per second. Therefore if one were to have perfect scaling, an LVS-DR configuration with four webservers should theoretically be able to support 16000 requests per second. While we do see a nearly linear jump from one to two servers (on both 2.2 and 2.4), it seems the additional two servers when going from two to four provides almost no gain at all. We believe this to be a limitation of the single processor in the director to handle the network traffic. Figure 12 shows our ability to scale with two CPUs as we add real servers. Increasing from one real server to two provides a nearly linear increase in overall connection rate, a jump from 4000 to around 7700 connections per second. According to our results, a 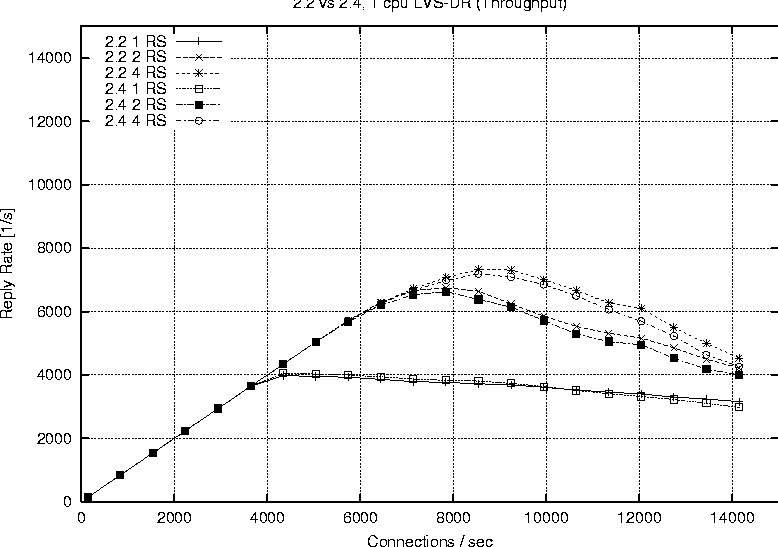 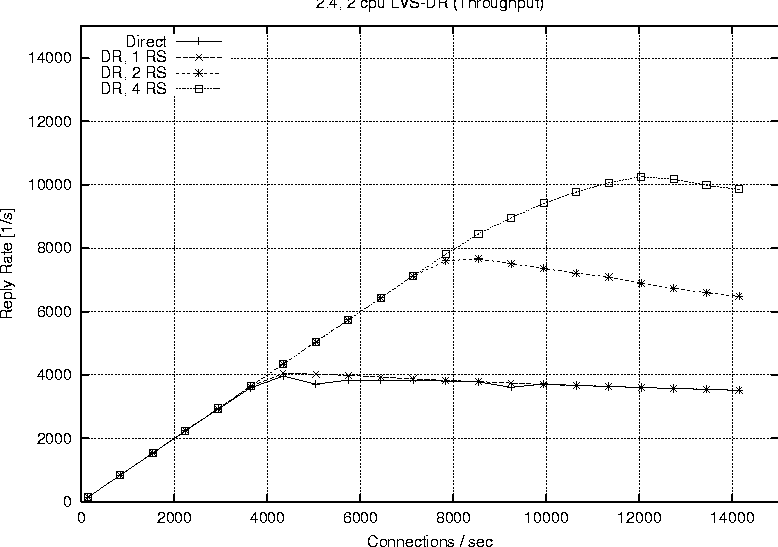 two processor LVS-DR director with two servers outperforms a uni-processor with four servers. We suspect the reason is because the TCP/IP layer in 2.4 is fully multi-threaded, so the additional server's load can be handled in parallel by the second CPU. We are no longer contending for the global kernel lock as is the case in 2.2. The addition of two more servers brings us closer to theoretical limit of 16000 requests per second, but in this case we top out at around 10000 connections per second. [Note 4] We suspect the reason being that the request rate has exceeded the ability of two processors to sustain. We see in Figure 13 that more CPU power brings us even closer to our theoretical limit of 16000 connections per second. This is evidence for how well parallelized the TCP/IP stack is in Linux 2.4. In fact our set of clients in their current configuration is capable of driving the LVS cluster to saturation. You can see from the shape of the curve ``DR, 4 RS'' in Figure 13 that it looks as if we will peak at around 13000 connections per second. 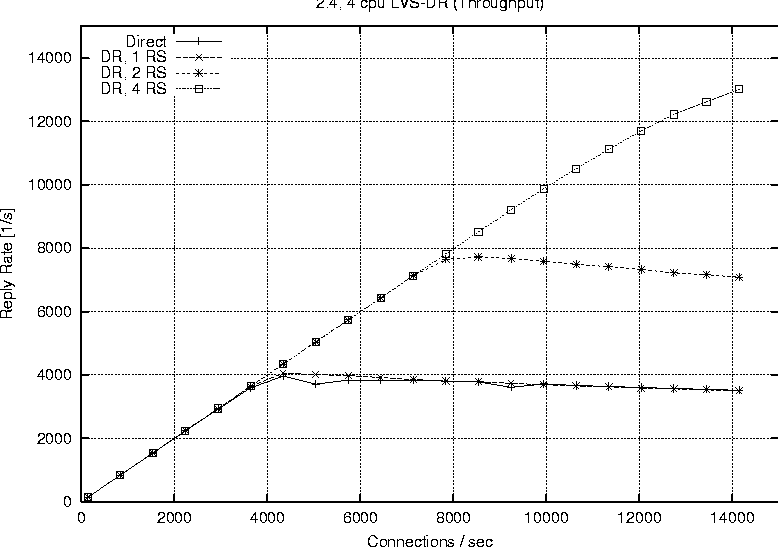 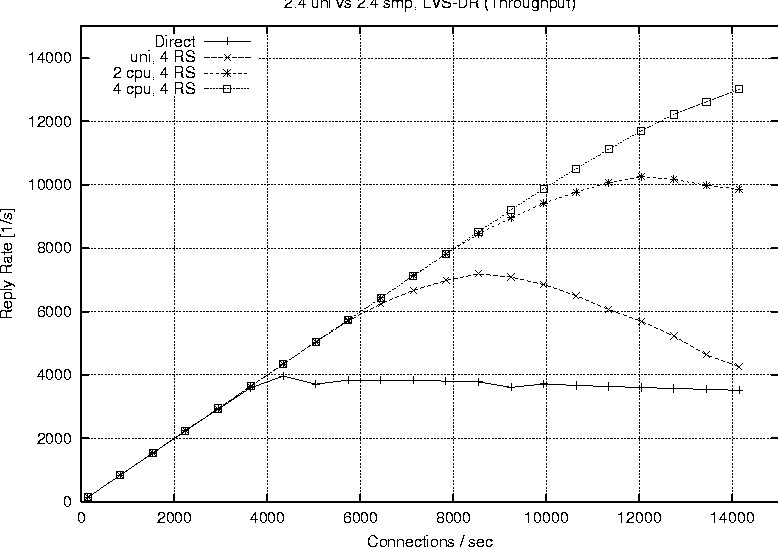 Figure 14 illustrates the ability of a 2.4 based LVS-DR to scale as we add processors with real servers held constant at four. Director LoadEarlier results indicated the peak load that a single real server could sustain was approximately 4000 connections per second. The question remains however if we are limited due to network saturation or by the capabilities of the real servers. Httperf allows us to estimate how much network bandwidth our tests consumed because it reports the amount of network I/O each client received. Recall that the requested web content was 628 bytes in length, and according to httperf each request contained 288 bytes of packet header, so each reply received corresponds to 916 bytes of network data transmitted. We can therefore estimate the amount of network traffic by taking the sum of data received for each client during a particular test run. Figure 15 shows the aggregate network I/O reported by httperf at the highest sustainable reply rate for several selected test runs. We are not close to saturating the 100 Mb connections on the smallest clients, let alone the Gb interfaces on the director and real servers, even at our peak connection rate of 13019.3 replies per second.
We would also like a sense of the load on the cluster nodes themselves during peak activity. Therefore we sampled vmstat(8) output during runs of the highest sustainable connection rates for various configurations. Figure 16 reports the CPU utilization figures for a single CPU director when front ending one, two and four real servers respectively. At an offered connection rate of 4200 connections per second the single processor director is lightly loaded with an idle time of 85 percent. The single real server on the other hand is fairly loaded with less than 20 percent idle time. The load on the director increases with the number of real servers and we achieve an average system time of 55 percent with four real servers (peaks of 80 percent system time were seen for the four real server case). Figure 17 shows the CPU utilization figures for a two CPU director. We did not include the numbers for the one real server scenario because they were very similar to the uniprocessor director shown previously. As with the single CPU director case, we are capable of saturating both the two and four real server configurations. The load on the two CPU director is higher than a single, but that coincides with an increase in the sustainable connection rate as well, a peak of 7115 replies per second. We did observe periods of greater than 90 percent system time on the two CPU director when running with four real servers. In Figure 18 we show the utilization figures for the four CPU director with two and four real servers respectively. The added CPU cycles allow us to reach a reply rate over 12000 connections per second, but we still have a nearly 40 percent idle time on the director. At this connection rate we encounter the limitation in httperf which prevents us from reaching a higher load on the director. Sharing IRQsProfiling the director via readprofile(1) showed we were spending a great deal of time in the AIC
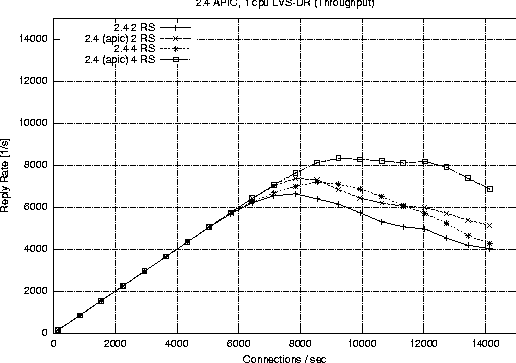 SCSI controller's interrupt service routine on both 2.2 and 2.4 based configurations. Further investigation revealed that the e1000 card and the SCSI controller were sharing the same IRQ which resulted in do_aic7xxx_isr() being called for every packet received. Linux 2.4 provides a config option to use the APIC controller available on IA32 based systems in a uni-processor environment (CONFIG_X86_UP_IOAPIC). [Note 5] This resulted in allowing us to use different IRQs for the e1000 and AIC controller. Figure 19 shows the dramatic benefit of eliminating the IRQ contention. With two real servers our sustainable peak increased from 6600 to 7400 requests per second. In the case of four servers the peak sustainable rate went from 7200 to 8300 connections per second. We re-ordered the manner in which interrupt handlers register themselves, while leaving the IRQ shared between the e1000 and AIC. As a result the e1000 interrupt routine would be called prior to the AIC driver's. The hope was that the e1000 would handle the interrupt and the kernel would skip the un-needed call to the AIC driver. The device driver re-ordering had no effect on performance because the interface between handle_IRQ_event() and driver functions does not have a mechanism to signal that an interrupt has been processed. Thus the kernel continued to call each driver as before the re-ordering experiment. The APIC controller permitted us to place the AIC and e1000 drivers on separate IRQs, thereby eliminating the overhead of the AIC interrupt routine, and resulting in better performance. LVS vs. A Hardware Load BalancerBoth hardware and software solutions are presently available for solving the load balancing, packet redirector problem inherent in the development of a scalable web farm. Linear scalability (or as close to it as possible) of a web farm is desirable since we want to easily predict the number of servers to add as the request load increases. Any bottlenecks will prevent the web farm from scaling predictably and in fact, may provide less processing power than was previously available under a lighter request load. For a web server without bottlenecks and whose request load scales linearly, the following is true: [Note 6]
connection rate =
      average request rate =
      average reply rate
Given this identity, we can try to compare our software-based results for LVS against those reported on hardware products such as ArrowPoint's CS-150 Content Smart Web switch [11]. The test methodology employed by ZD Labs on the CS-150 enables NAT and round- robin load balancing so we will use the LVS-NAT configuration with the highest throughput for our comparison; namely Linux 2.2 on a uni- processor director with four real servers and round-robin scheduling. For a .01 percent error reply rate (all of which are client time out errors), such a configuration produces the reply rate shown in Figure 20.
Two hardware products we can compare the above LVS based solution against are ArrowPoint Communications' Content Smart Web switches; models CS-150 and CS-800. Each client in ZD Labs's tests repeatedly requested a 114 byte HTML web page, this should be comparable to the 628 byte web page requests used during our LVS testing. Joseph Mack [12] shows that network transmission times are approximately the same for sizes less than the MTU (1500 bytes). ZD Labs did not provide any information about errors that occurred during their testing, even though they gathered this information. This study reports the following results:
The CS-150 and CS-800 results are similar to those obtained for our NAT-based LVS test. Although LVS-NAT has raw performance that is on average 20 percent lower than the ArrowPoint CS-150, the ArrowPoint switch costs approximately $18,000 [Note 7] compared to an estimated value of $7,500 for the four processor director. The LVS solution is approximately twice the cost effectiveness of the CS-150 if one computes the cost per requests/second. The Arrowpoint comes out to $4.09 per request/second ($18,000/4400) whereas the LVS based configuration is $2.06 per request/second ($7500/3640). Also note that only four real servers were used by the LVS test whereas the CS-150 configuration used twelve. These results should be revisited once the 2.4 LVS-NAT functionality is stable and fully operational since it is likely that it will outperform ArrowPoint's CS-150 web switch. Future WorkA significant number of LVS features would benefit from more performance and scalability analysis in addition to the analysis we have done. It would be interesting to see how LVS behaves under a more varied workload instead of the static data we used in this report. This would enable one to study the effects and benefits of the various scheduling algorithms offered. Commercial web sites currently employ a variety of different protocols (e.g., HTTP 1.1, SSL, ...) and it may be interesting to see how well LVS can handle such workloads. We had to skip testing a 2.4 based NAT configuration because the software is still evolving. Since that time LVS-NAT has become functional in 2.4 so it would be beneficial to compare it to the 2.2 version. LVS-NAT is an important configuration because it allows your real server to be any platform, such flexibility would be important to anyone wishing to product-ize an LVS based solution so as to avoid making restrictions on the types of platforms which can function as servers. It would also be of great value if one could compare a server farm load balanced with LVS to one front ended by a commercial alternative such as Alteon or Foundry. Such a test would provide an users with an accurate price/performance comparison so they could make an informed decision on which technology is best for them. We found it difficult to ascertain the true capabilities of a commercial product from the vendor's literature, not to mention the obvious lack of objectivity. It seems as if each vendor reports performance results in a slightly different manner, or are somewhat vague in how they conducted the tests (e.g., number of clients, what type of operating system was used and so on). There also is a lack of standardization on testing and evaluating load balancers in general. This is evidenced by the widely varying statistics reported from commercial load balancers. An industry-wide, standards based test suite would permit a direct comparison to be made between a software based approach such as LVS and a hardware solution. ConclusionOur experience with Linux Virtual Server has been a positive one overall. Although not an exact comparison, we give an example in of how LVS can be a reasonable alternative to a more expensive hardware offering. The 2.2 LVS-NAT was unable to sustain as high a steady state as a stand alone web server, this warrants further investigation to determine if the performance of LVS-NAT can be improved. The Linux 2.4 based platform shows promise in its ability to scale as we add processors. We illustrated how important it is for the director to be properly configured, the overhead of sharing IRQ vectors is to be avoided. It is also clear that additional real servers will not help if your director does not have the processing power to handle the extra load. One may want to consider adding a CPU to the director after the number of real servers has also been increased (this ratio was close to 1 to 1 in our testing). One of the most valuable lessons to take away from this project is the ability to generate a high work load with a limited number of client machines. Our initial attempts were throttled by system resource limitations so that we could not open more than 1024 concurrent connections. After a substantial debugging effort, later tests we were able to increase this to approximately 5500 concurrent connections, [Note 8] even on our smallest client (see Figure 2). A key asset of LVS is the willingness of the open source community to enhance it and respond to the questions of users via the LVS mailing list. We have found it to be an invaluable resource that has assisted our efforts many times. AcknowledgmentsMission Critical Linux would like to thank Intel Corporation for their assistance in getting access to various hardware and software resources, especially John Baudrexl, Vikram Saletore, Mike McCardle and Greg Regnier. They provided invaluable assistance to MCLX in scoping our experiments as well as supplying feedback throughout the project. Kris Corwin of MCLX assisted the authors in diagnosing several issues related to httperf and the e1000 device driver. Joseph Mack, Wensong Zhang and Julian Anastasov graciously reviewed an initial draft and offered excellent comments. David Mosberger assisted in our efforts to increase the ceiling on the number of connections a single client could achieve with httperf. Finally we would also like to acknowledge the members of the LVS mailing list for providing timely responses to our inquiries and for being an invaluable source of information concerning LVS. Author InformationPat O'Rourke worked as a kernel engineer at Mission Critical Linux, Inc. where he was responsible for adding LVS support in MCLX's Convolo Netguard cluster product. He is currently employed at Egenera, Inc. working on their BladeFrame server. He can be reached at porourke@world.std.com. References[1] Zhang, Wensong, ``Linux Virtual Servers for Scalable Network Services,'' https://www.linuxvirtualserver.org/ols/lvs.ps.gz.[2] Zhang, Wensong, ``LVS Deployment page,'' https://www.linuxvirtualserver.org/deployment.html. [3] Mack, Joseph, ``The Linux Virtual Server HOWTO,'' https://www.linuxvirtualserver.org/Joseph.Mack/LVS-HOWTO-991205.gz. [4] ``LVS Documentation,'' https://www.linuxvirtualserver.org/Documents.html. [5] Foundry Networks, ``ServerIronXL vs. Alteon 180e: Layer 4 Maximum TCP/IP Session Rate and Concurrent Session Capacity,'' https://www.foundrynetworks.com/testreports.html#ServerIron. [6] Freed, Les, ``How We Tested: Load Balancers,'' PC Magazine, https://www.zdnet.com/pcmag/stories/reviews/0,6755,2455845,00.html. [7] ArrowPoint Communications, ``Testing Stateful Networking Devices for Web Applications,'' https://www.arrowpoint.com/solutions/white_papers/product_testing.html#howto. [8] Snell, Quinn O., Armin R. Mikler, and John L. Gustafson, ``NetPIPE: A Network Protocol Independent Performance Evaluator.'' [9] Anastasov, Julian, ``testlvs,'' https://www.linuxvirtualserver.org/software/index.html. [10] Mosberger, David, and Tai Jin,' ``httperf - A Tool for Measuring Web Server Performance.'' [11] eTesting Labs, ArrowPoint Communications, https://www.zdnet.com/etestinglabs/stories/main/0,8829,2462091,00.html. [12] Mack, Joseph, ``LVS Performance, Initial Tests with a single Real server, LVS,'' https://www.LinuxVirtualServer.org/Joseph.Mack/performance/single_realserver_performance.html. Footnotes: Note 1: Real servers is the term used in the LVS documentation to denote the web server systems responsible for fulfilling the actual request. Note 2: It may be theoretically possible to use an alternative to ethernet (e.g., an ATM network), however there may be issues in getting such an LVS configuration working. Note 3: We were eventually able to overcome this limitation by modifying the httperf source code, but this was not used in our testing. Note 4: httperf was specified to make only one request per connection, so we use the terms connection and request interchangeably. Note 5: The APIC is used by default in SMP kernels. Note 6: At least for a web server performance measuring tool such as httperf and presumably this holds for Tarantula - the tool used by ZD Labs in its tests Note 7: As of April 17, 2000. Note 8: As the numbers are reported by httperf. | |||||||||||||||||||||||||||||||||||||||||||||||||||||||||||||||||||||||||||||||||||||||||||||||||||||||||||||||||||||||||||||||||||||||||||||||||||||||||||||||||||||||||||||||||||||||||||||||||||||||||||||||||||||||||||||||||||||||||||||||||||||||||||||||||||||||||||||||||||||||||||||||||
|
This paper was originally published in the
Proceedings of the LISA 2001 15th System Administration Conference, December 2-7, 2001, San Diego, California, USA.
Last changed: 2 Jan. 2002 ml |
|
