
| ||||||||||||||||||||||||||||||||||||||||||||||||||||
|
LISA 2001 Paper
[LISA '01 Tech Program Index]
Simulation of User-Driven Computer BehaviorAbstractWe simulate a computer system by modeling its users as individuals who have separate needs for resources like processes and login time. During the simulations the users make decisions with probabilities which depends on the time of day and on the character of the user. This makes us able to reproduce the large scale behavior measured at real computer systems as well as predicting the behavior of systems when varying the number and characters of the users. IntroductionOne of the goals of system administration is to be able to understand the characteristic interaction between humans and machines more fully, in order to use such knowledge to improve the reliability and security of computer systems [1]. To understand this interaction, one must blend empirical data with models and simulation, thus relating cause to effect [2]. A full understanding of computer systems requires a knowledge of important scales and processes. This is far more than can be achieved with a single model or study; however, at the level of the user-computer interaction, high level changes in the system generally occur over intervals greater than several minutes. This leads to a considerable simplification. Recently some progress has been made in trying to characterize the state of large and complex computer systems, in terms of a few macroscopic parameters [3, 4]. This work is based on measuring at intervals of a few minutes, a large number of system variables like the number of users and processes, network connections, memory and disk usage etc. One of the goals has been to be able to measure the normality of a computer system, making it possible to automate the detection of abnormal behavior. Burgess has provided a stochastic explanation for the subset of variables which closely follows the periodic trends of users [5]. This approach uses functional methods of statistical mechanics. However, the approach is limited to fairly simple calculations, and there is room for a more general way to predict system behavior, by Monte Carlo simulation. The model presented here attempts to simulate the behavior, in time, of a selection of variables which describe resources on the system, by imitating the behavior of the users themselves. Previous work has been done to model some of this behavior by assuming that large numbers of users behave more or less like a mass crowd (a gas of users) [5]. Here we start with some simple assumptions about the probable behavior of individual users and repeat this behavior for a given number of users. This allows us to adjust the number of users and see how behavior depends on various parameters. This is potentially more complicated than the analytical analysis in [5], but it is more general and flexible for extending that work. A simulation environment is ideal for testing such theories, since it becomes easy to change conditions which are impossible to change on real systems. A simulation is also an efficient tool for predicting the expected load and resource usage of a system when the number of users or the system itself changes. The functional analysis of Burgess is only true in the limit of large numbers of users, and thus must be understood mainly as an idealized limit on behavior. Empirical DataEarlier empirical work came to two main conclusions about the behavior of macroscopic system variables: that many (though not all) variables are periodic in nature and that the behavior was stochastically distributed around stable averages, in the manner of a steady state, modulated by periodic variation. These empirical facts can be seen in the periodogram of Figure 1, which plots a number of these variables, scaled over the course of a week. 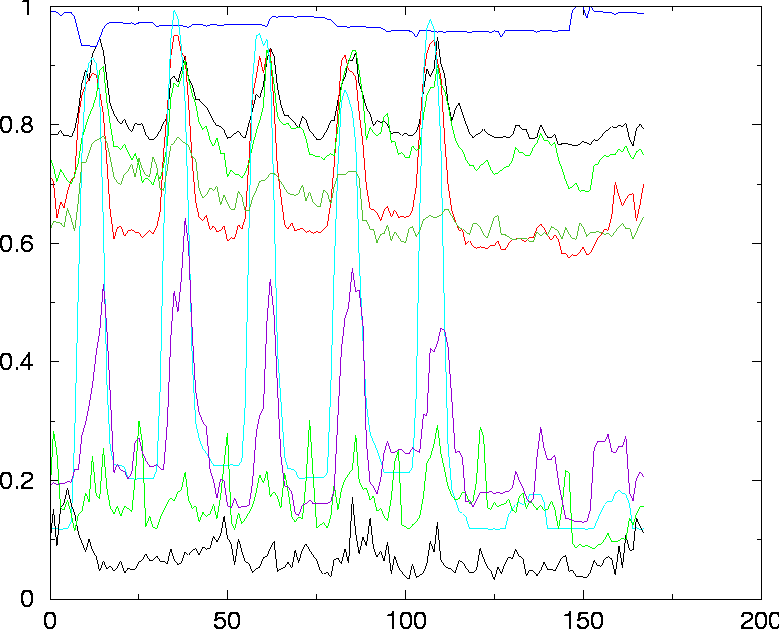 Traditionally, measurements of normal computer behavior have been used to analyze event arrival times and lifetimes; they have often been collected in connection with performance analyses [6, 7, 8, 9, 10]. Other studies of computer systems have been performed in connection with load balancing [11, 12, 13, 14], expectations of communications over a network [15, 16] and interactions with users on teletype terminals [17]. Our primary aim here is to show how a simple random model can be used to understand system behavior, and to test predictions about management decisions. In the classification used by Burgess [1], this a type I model. SimulationIn a Monte Carlo simulation we attempt to follow the time dependence of a model for which change does not proceed in some rigorously predefined fashion but rather in a stochastic manner which depends on a sequence of random numbers which is generated during the simulation. With a second, different sequence of random numbers the simulation will not give identical results but will yield values which agree with those obtained from the first sequence to within some statistical error. The simulation presented here models users of a computer system as individuals who make decisions in a stochastic manner, but far from completely at random. It is for instance more likely that a normal user logs on to the system in the morning than in the middle of the night. The simulation is object-oriented and written in C++. The main objects are the users, characterized by their individual needs for resources, and the hosts with a given set of resources. The system one wants to simulate is devised by providing the number of users and hosts and their properties. The simulation is divided into time-slices and at each step, every user makes decisions such as starting a new process, logging out or using the disk. These decisions are made using random numbers to simulate Bernoulli trials, with probabilities which are time-dependent and reflects social behavior and work rhythms of the users [3] [18] [19]. A Bernoulli trial [20] is an experiment that either fails or succeeds and the probability for success is given by p. Flipping a coin is a Bernoulli trial with probability p = 0.5. Suppose that a user of the simulation has got a probability of p = 1/6 for logging out at some time of day. This corresponds to a user throwing a die every minute and once he gets a ``six'' he will log out. On average such a user will stay logged in for six minutes. A user who just pops in to check his email is in our simulations given logout-probabilities of similar magnitude. The probability for logging on at, for instance, Sunday night is small and is much larger on Monday morning. In addition, the probabilities depend on the particular character of the user. Several characters can be included in the simulation, such as users who start their day early, users who mostly work at night, or those who just use their account for reading email once in a while. A percentage of these various user-characters is input to the simulation. Each user in each character-group differs slightly and they change somewhat from week to week within given boundaries. The fundamental assumption of the simulation is that, at any given time, there exist probabilities for a user to log in or out, start a process and generally perform any action that influences the system. That such a probability exists is clear, but it certainly has a very complex dependence on time, the user's state of mind, and the state of the system. Making these probabilities only depend on time is a strong simplification, but it seems to grasp much of the correct dynamics of a computer system. Some limits given by the system, like a maximal number of users and processes or finite memory are straightforward to impose. One could also think of mechanisms which changed the user- probabilities with respect to how the system reacted (slow response, paging, slow network etc.) but this is beyond the scope of this short study. The behavior of a computer system will obviously be strongly dependent on the kinds of users it serves. In the simulations we have several categories of users and initialize the simulation by simply assigning percentages of users from each of the following categories.
A standard user has, for instance, a high probability for logging in between 8:00 and 10:00 on a weekday and a high probability for logging out after 5. The probabilities are never one or zero, so any action is in principle possible at any time. A simulation is initialized by creating a new simulation-object which in turn creates all the users. The number and categories of users is globally defined and for each user a new user-object is created. The initialization method of the user-class then sets the time dependent probabilities for logging on and off and creating processes according to the character of the user. The properties of users within a character-group are also made slightly different so that no users are identical. Figure 2 shows the main objects of a simulation of a system containing 14 individual users on a single host which has a maximum number of 256 processes. Time is split into time-slices of one minute as we are looking for the behavior of the system over relatively long time-scales. After all the users have been created the simulation runs by visiting all users in a Round Robin manner and each of the users makes their decision according to their time-dependent probabilities for logging out or on, starting processes etc. 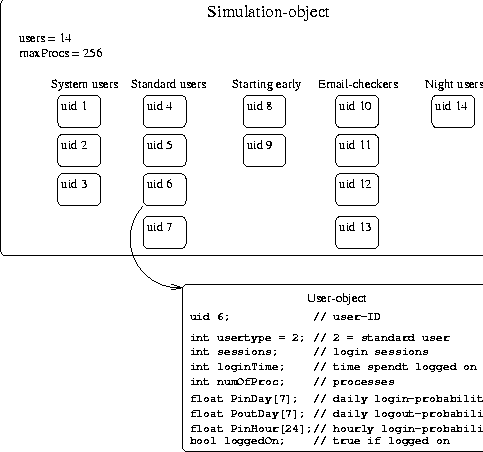 If the probability p for an event like logging out was kept constant with time, the number of failures before an event happened after a series of independent Bernoulli trials would follow the Geometric distribution [20]. The mean value of this distribution is 1/p and gives the expected time to elapse before the event occurs. The standard deviation for this distribution equals the mean value for small p's and both the mean value and the width of the distribution grows rapidly with decreasing p. The probability p for logging out is changing with time, but on a time scale of hours. So the probability distribution for a user event is split into several Geometric distributions with different p's, each lasting one or more hours. The following is an example of how the state of a user is updated in a time-step. If a user is logged on and his probability for logging out is p = 0.02 at this time of day, a random number between 0 and 1 is generated and if this number is smaller than 0.02 the user is logged out. This simulates a Bernoulli trial with probability p = 0.02. the expected time for the user to stay logged on would then be 1/0.02, i.e., 50 minutes. At five o'clock in the afternoon the probability for a standard user to log out increases to p = 0.06 making it improbable that he will stay much longer than half an hour. The various user-probabilities p were initially chosen based on the average amount of time 1/p which would run before the corresponding event would occur. Since these probabilities also depend on the time of day and the day of week, the expectation values are hard to estimate accurately. Some initial simulations where therefore run in order to tune the parameters to make ``standard'' users behave as expected, system users stay logged on more or less permanently, email checkers just pop in from time to time and not stay for days, etc. Finally the percentage of user characters where adapted in order to simulate a given system. A future improvement would be to be able to estimate model parameters directly from data obtained by measuring the user behavior at a system. The user-probabilities of the simulations are summarized in Figure 3 and Figure 4. The actual probability at a given hour and day of week, is the product of the number in the row labeled by this hour and the number in the row labeled by this day. At the bottom of the tables, the probabilities for stopping and starting processes are given. Systems of various natures can then be simulated by changing the percentage of these users as shown in the next section. ResultsThe simulations of user and process statistics has given results which are quite similar to previously measured real world results [3]. Figure 5 shows the number of users logged on for a system of 100 users. The weekly rhythm is apparent. The behavior of such a function obviously depends on the kind of users the computer serves. By changing the percentages of the different characters one can simulate computers with other user characteristics. In Figure 6 the simulation is carried out with a different composition of users; the main difference being the removal of the late night users.
In this way it is possible to tune the simulation to fit the data of a given computer system and afterwards predict what would happen when for instance the total number of users increased. Averaging over several simulation-years is done in minutes and makes it convenient to change and test the consequences of the kind of users who use the system. Figure 7 compares the number of processes obtained from simulation and from measurement of a computer. The data are from the same computer and the same simulation as the data presented in Figure 5 are from. In previous work [3, 4] the skew distributions of deviations around the mean value have been pointed out. We have obtained similar results in our simulations as seen in Figure 8. For each data point of the simulation, the deviation from the mean is calculated. The figure shows the number of data points as function of deviation from the mean, measured in units of standard deviation. The frequency of data points is counted by splitting the x-axis into 200 slots of equal size. 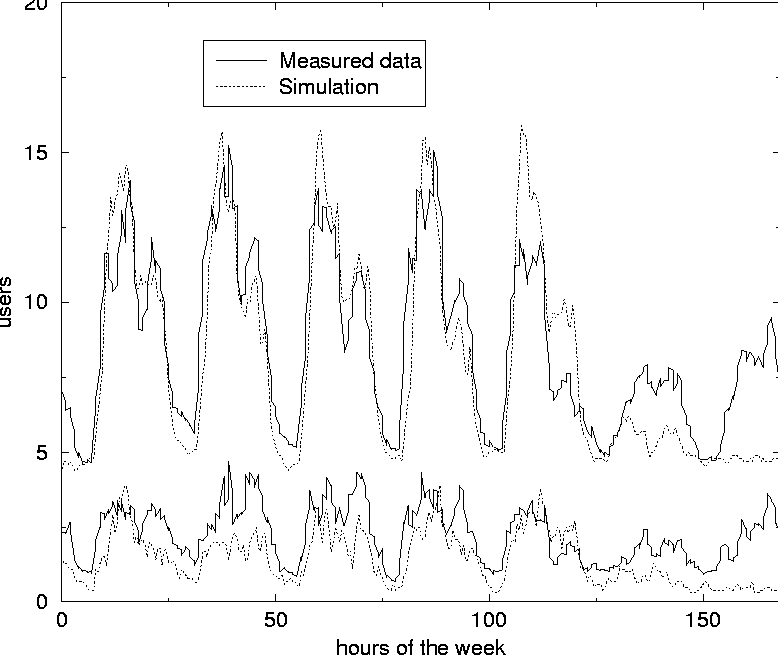 Suppose the average value for the number of users at a given time of the day is 19.9 and that the standard deviation is 5.0 for the data collected so far in the simulation. If a new measurement of 30 users is made at this time it deviates by 10.1 from the average value and this equals 2.02 standard deviations, since 2.02 x 5.0 = 10.1. This data point will then fall into the standard deviation slot ranging from 2.01 to 2.04. The deviation is scaled in this way in order to characterize the complete set of data at the same time. The distribution of deviations seems to have a skewness to the left with a tail to the right when the measured value is close to zero some time of the week, for instance at night as shown for the dotted distribution of Figure 8. The only difference when performing this simulation compared to simulation leading to the data of the fully drawn line which show a symmetric Gaussian distribution of data points, is that the 10% of the users stay logged on at night in the latter simulation. The skewness may be due to all the data points which are zero and therefore occurs slightly below the average. The non-zero points in the same area will be several standard deviations above the mean and therefore contribute to the tail of the skew contribution. When the value considered never is close to zero, the distribution is Gaussian as one would expect. 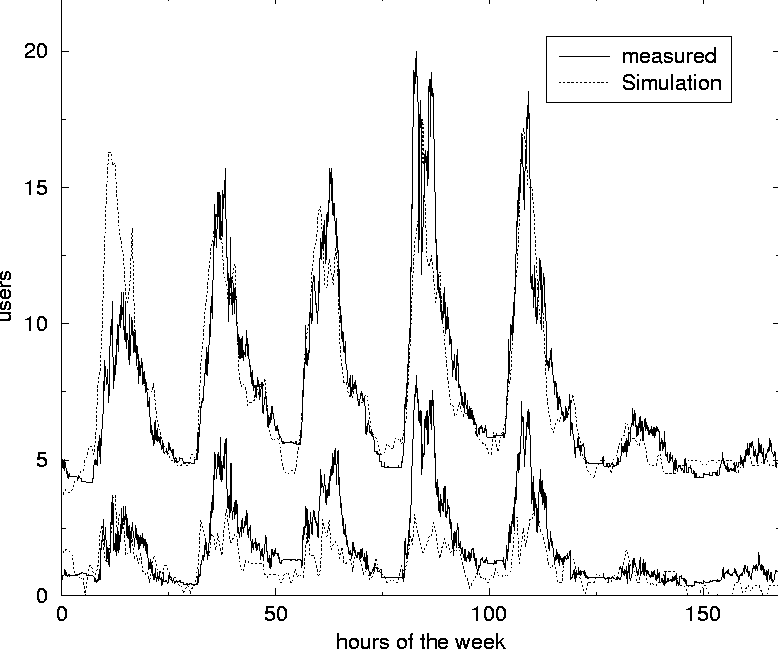 On the other hand, when the value measured is limited from above, as the number of processes is at a given host, one would expect that the distribution would be skew to the right with a tail to the left, since there will be a lot of points close to the upper limit contributing to data points shortly above the average. This means that the skewness of the distribution, which is a well defined statistical quantity, might be used as a numeric measure of how limited a resource is. Frequently occurring values close to zero makes it skew to the left, while frequently occurring values close to the upper limit makes it skew to the right. Some work remains to be done in order to understand this behavior thoroughly and quantitatively. Other characteristics will surely emerge as further studies are made. Such characteristics can be used to plan resources for future refinements of performance and reliability. ConclusionAlthough the first results of our simulations are promising, we have only scratched the surface of user-level Monte Carlo simulation of computer systems. There are many possible new uses of such a general approach to investigating a computer system. One of 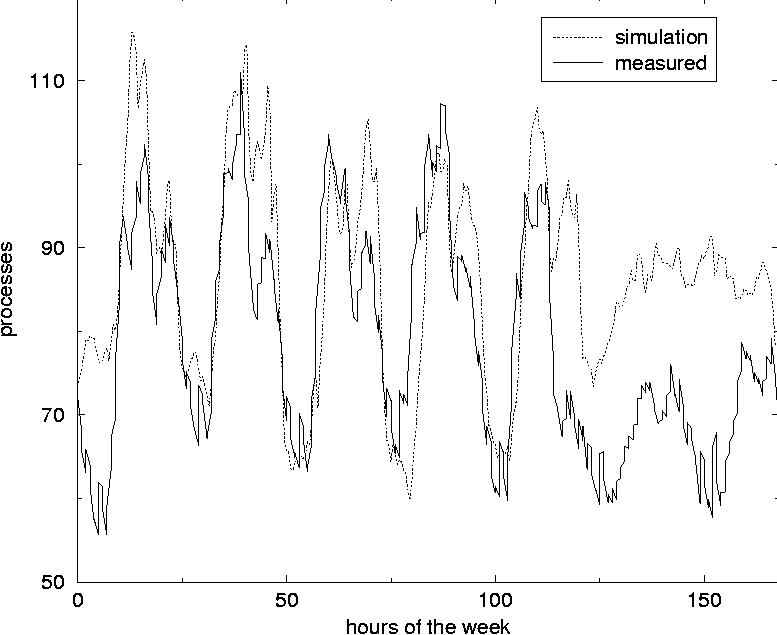 them is to study the effect of introducing the topography of the system, including network connections between the various hosts and servers. This will make it possible to simulate the network traffic and to find the solutions which gives the best and most balanced use of the resources of the system as a whole. As Traugott and Huddleston have pointed out, modern distributed systems are best thought of as a single virtual machine, at the level of the network [21]. In version 2 of cfengine [22], being developed at Oslo University College, the results of these studies are already being used to implement automatic anomaly detection for automatic regulation of systems. We hope to return to more intricate studies in future work. The authors are grateful to Mark Burgess for inspiring discussions and to Tim Bower for providing us with data from Kansas State University. The simulation software can be obtained by contacting the authors. References[1] Burgess, M., ``Theoretical system administration.'' Proceedings of the Fourteenth Systems Administration Conference (LISA XIV), USENIX Association, Berkeley, CA, p. 1, 2000.[2] Burgess, M., Principles of Network and System Administration, J. Wiley & Sons, Chichester, 2000. [3] Burgess, M., H. Haugerud, T. Reitan, and S. Straumsnes, ``Measuring Host Normality,'' ACM/Transactions on Computing Systems, submitted, 2001. [4] Burgess, M., ``Thermal, Non-Equilibrium Phase Space for Networked Computers,'' Physical Review E, Vol. 62, p. 1738, 2000. 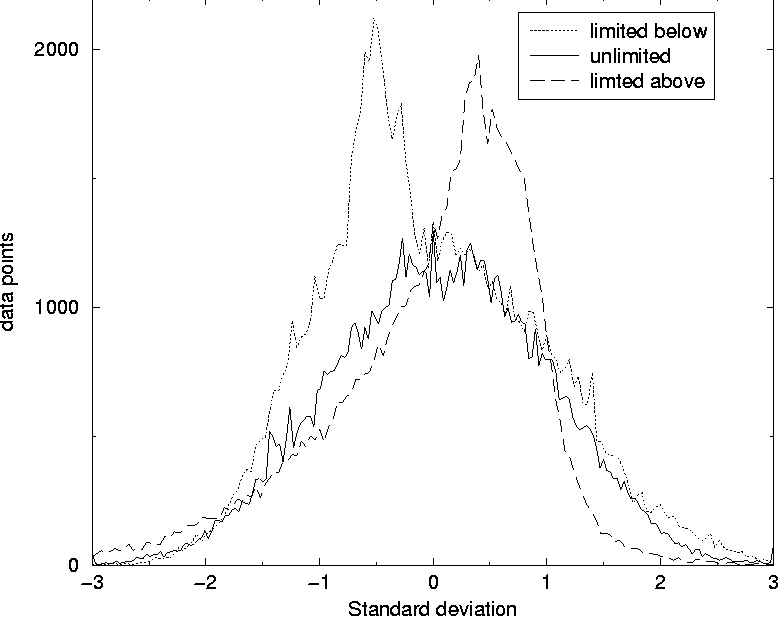 [5] Burgess, M., ``The Kinematics of Distributed Computer Transactions,'' International Journal of Modern Physics, Vol. C12, pp. 759-789, 2000. [6] Ousterhout, J. K., H. Da Costa, D. Harrison, J. A. Kunze, M. Kupfer, and J. G. Thompson, ``A Trace-driven Analysis of the Unix 4.2 BSD File System,'' ACM/SOSP, p. 15, 1985. [7] Baker, M. G., J. H. Hartman, M. D. Kupfer, K. W. Shirriff, and J. K. Ousterhout, ``Measurements of a Distributed File System,'' ACM/ SOSP, October, p. 198, 1991. [8] Park, A., and J. C. Becker, ``Measurements of the Paging Behavior of Unix,'' Performance Evaluation Review, Vol. 19, p. 216, 1991. [9] Hellerstein, J. L., F. Zhang, and P. Shahabuddin, ``An Approach to Predictive Detection for Service Management,'' Proceedings of IFIP/IEEE INM VI, p. 309, 1999. [10] Chen, J. Cradley, Y. Endo, D. Mazieres, A. Dias, M. Seltzer, and M. D. Smith, ``The Measured Performance of Personal Computer Operating Systems,'' ACM Transactions on Computing Systems and Proceedings of the Fifteenth ACM symposium on Operating System Principles, 1995. [11] Smith, A. J., ``Analysis of Long Term File Reference Patterns for Application to File Migration Algorithms,'' IEEE transactions on Software Engineering, Vol. SE-7, p. 403, 1981. [12] Leland, W. E., and T. J. Ott, ``Load Balancing Heuristics and Process Behavior,'' Performance Evaluation Review, Vol. 14, 54, 1986. [13] Harchol-Balter, M., and A. B. Downey, ``Exploiting Process Lifetime Distributions for Dynamic Load Balancing,'' Performance Evaluation Review, Vol. 24, 1996. [14] Borst, S. C., ``Optimal Probabilistic Allocation of Customer Types to Servers,'' Performance Evaluation Review, Vol. 23, p. 116, 1995. [15] Crovella, M. E., and A. Bestavros, ``Self-Similarity in World Wide Web Traffic: Evidence and Possible Causes,'' Performance Evaluation Review, Vol. 24, p. 160, 1996. [16] Willinger, W., V. Paxson, and M. S. Taqqu, ``Self-Similarity and Heavy Tails: Structural Modelling of Network Traffic,'' in A practical Guide to Heavy Tails: Statistical Techniques and Applications, pp. 27-53, 1996. [17] Fuchs, E., and P. E. Jackson, ``Estimates of Distributions of Random Variables for Certain Computer Communications Traffic Models,'' Communications of the ACM, Vol. 13, p. 752, 1970. [18] Berry, R. F., and J. L. Hellerstein, ``Characterizing and Interpreting Periodic Behavior in Computer Systems,'' Performance Evaluation Review, Vol. 20, p.241, 1992. [19] Glance, N., T. Hogg, and B. A. Huberman, ``Computational Ecosystems in a Changing Environment,'' International Journal of Modern Physics, Vol. C2, p. 735, 1991. [20] Law, Averill M., and W. David Kelton, Simulation Modeling and Analysis, McGraw-Hill, Boston, 2000. [21] Traugott, S., and J. Huddleston, ``Bootstrapping an Infrastructure,'' Proceedings of the Twelth Systems Administration Conference (LISA XII), USENIX Association, Berkeley, CA, p. 181, 1998. [22] Burgess, M., ``A Site Configuration Engine,'' Computing Systems, MIT Press, Cambridge, MA, Vol. 8, p. 309, 1995. | ||||||||||||||||||||||||||||||||||||||||||||||||||||||||||||||||||||||||||||||||||||||||||||||||||||||||||||||||||||||||||||||||||||||||||||||||||||||||||||||||||||||||||||||||||||||||||||||||||||||||||||||||||||||||||||||||||||||||||||||||||||||||||||||||||||||||||||||||||||||||||||||||||||||||||||||||
|
This paper was originally published in the
Proceedings of the LISA 2001 15th System Administration Conference, December 2-7, 2001, San Diego, California, USA.
Last changed: 2 Jan. 2002 ml |
|
