 |

The key component of our profiling architecture is a general-purpose profiling interface between the Java virtual machine and the front-end responsible for presenting the profiling information. A profiling interface, as opposed to direct profiling support in the virtual machine implementation, offers two main advantages:
First, profilers can present profiling information in different forms. For example, one profiler may simply record events that occur in the virtual machine in a trace file. Alternatively, another profiler may receive input from the user and display the requested information interactively.
Second, the same profiler can work with different virtual machine implementations, as long as they all support the same profiling interface. This allows tool vendors and virtual machine vendors to leverage each other's products effectively.
A profiling interface, while providing flexibility, also has potential shortcomings. On one hand, profiler front-ends may be interested in a diverse set of events that occur in the virtual machine. On the other hand, virtual machine implementations from different vendors may be different enough that it is impossible to expose all the interesting events through a general-purpose interface.
The contribution of our work is to reconcile these differences. We have designed a general-purpose Java Virtual Machine Profiler Interface (JVMPI) that is efficient and powerful enough to suit the needs of a wide variety of virtual machine implementations and profiler front-ends.
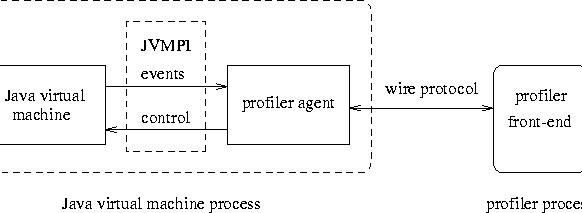
Figure 1 illustrates the overall architecture. The JVMPI is a binary function-call interface between the Java virtual machine and a profiler agent that runs in the same process. The profiler agent is responsible for the communication between the Java virtual machine and the profiler front-end. Note that although the profiler agent runs in the same process as the virtual machine, the profiler front-end typically resides in a different process, or even on a different machine. The reason for the separation of the profiler front-end is to prevent the profiler front-end from interfering with the application. Process-level separation ensures that resources consumed by the profiler front-end does not get attributed to the profiled application. Our experience shows that it is possible to write profiler agents that delegate resource-intensive tasks to the profiler front-end, so that running the profiler agent in the same process as the virtual machine does not overly distort the profiling information.
We will introduce some of the features of the Java virtual machine profiling interface in the remainder of this section, and discuss how such features are supported by the Java virtual machine in later sections.