 |
To evaluate the MBRP approach, we prototyped key components of a Web service utility (as depicted in Figure 1) and conducted initial experiments using Web traces and synthetic loads. The cluster testbed consists of load generating clients, a reconfigurable L4 redirecting switch (from [12]), Web servers, and network storage servers accessed using the Direct Access File System protocol (DAFS [13,24]), an emerging standard for network storage in the data center. We use the DAFS implementation from [24] over an Emulex cLAN network.
The prototype utility OS executive coordinates
resource allocation as described in
Section 4. It periodically observes
request arrival rates (![]() )
and
updates resource slices to adapt to changing conditions.
The executive implements its actions through two mechanisms.
First, it issues directives to the switch to configure the active
server sets for each hosted service; the switch distributes
incoming requests for each service evenly across its active
set. Second, it controls the resource shares
allocated to each service on each Web server.
)
and
updates resource slices to adapt to changing conditions.
The executive implements its actions through two mechanisms.
First, it issues directives to the switch to configure the active
server sets for each hosted service; the switch distributes
incoming requests for each service evenly across its active
set. Second, it controls the resource shares
allocated to each service on each Web server.
To allow external resource control, our prototype uses a new Web server that we call Dash [8]. Dash acts as a trusted component of the utility OS; it provides a protected, resource-managed execution context for services, and exports powerful resource control and monitoring interfaces to the executive. Dash incorporates a DAFS user-level file system client, which enables user-level resource management in the spirit of Exokernel [19], including full control over file caching and and data movement [24]. DAFS supports fully asynchronous access to network storage, enabling a single-threaded, event-driven Web server structure as proposed in the Flash Web server work [27]--hence the name Dash. In addition, Dash implements a decentralized admission control scheme called Request Windows [18] that approximates proportional sharing of storage server throughput. The details and full evaluation of Dash and Request Windows are outside the scope of this paper.
 |
 |
For our experiments,
the Dash and DAFS servers run on
SuperMicro SuperServer 6010Hs with 866 MHz Pentium-III Xeon CPUs;
the DAFS servers use one 9.1 GB 10,000 RPM Seagate Cheetah drive.
Dash controls memory usage as
reported in the experiments. Web traffic originates from
a synthetic load generator ([10]) or
Web trace replay as reported; the caching
profiles
![]() are known a priori and used to
parameterize the models. All machines run FreeBSD 4.4.
are known a priori and used to
parameterize the models. All machines run FreeBSD 4.4.
We first present a simple experiment
to illustrate the Dash resource
control and to validate the hit ratio model (Equation (2)).
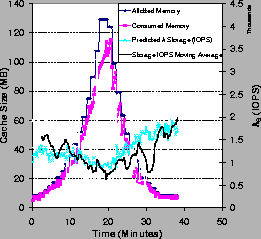
Figure 9 shows the predicted and observed
storage request rate ![]() in IOPS as the service's memory allotment M varies.
The Web load is an accelerated 40-minute segment of a
2001 IBM trace [12] with steadily increasing request
rate
in IOPS as the service's memory allotment M varies.
The Web load is an accelerated 40-minute segment of a
2001 IBM trace [12] with steadily increasing request
rate ![]() .
Larger M
improves the hit ratio for the Dash server
cache; this tends to reduce
.
Larger M
improves the hit ratio for the Dash server
cache; this tends to reduce ![]() ,
although
,
although ![]() reflects changes in
reflects changes in ![]() as well as hit ratio.
The predicted
as well as hit ratio.
The predicted ![]() approximates the observed I/O load;
the dip at t=30 minutes is due to a
transient increase in request locality, causing an unpredicted
transient improvement in cache hit ratio. Although the models
tend to be conservative in this example, the experiment demonstrates
the need for a safety margin to protect against transient deviations
from predicted behavior.
approximates the observed I/O load;
the dip at t=30 minutes is due to a
transient increase in request locality, causing an unpredicted
transient improvement in cache hit ratio. Although the models
tend to be conservative in this example, the experiment demonstrates
the need for a safety margin to protect against transient deviations
from predicted behavior.
 |
To illustrate the system's dynamic behavior in
storage-aware provisioning, we
conducted an experiment with two services with identical caching
profiles
![]() and response time targets, serving identical
synthetic load swells on a Dash server. The peak IOPS throughputs
available at the storage server for each service
(reflected in the
and response time targets, serving identical
synthetic load swells on a Dash server. The peak IOPS throughputs
available at the storage server for each service
(reflected in the ![]() parameters) are constrained at different
levels, with a more severe constraint for service 1.
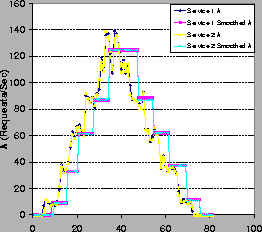
Figure 10 shows the arrival rates
parameters) are constrained at different
levels, with a more severe constraint for service 1.
Figure 10 shows the arrival rates ![]() and
the values smoothed by a ``flop-flip'' stepped filter [12] for
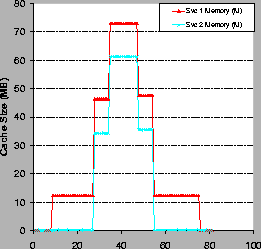
input to the executive. Figure 11 shows the
memory allotments for each service during the experiments, and
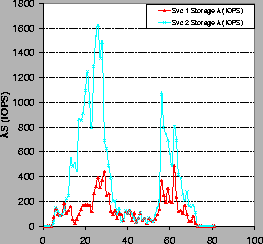
Figure 12 shows the resulting storage loads
and
the values smoothed by a ``flop-flip'' stepped filter [12] for
input to the executive. Figure 11 shows the
memory allotments for each service during the experiments, and
Figure 12 shows the resulting storage loads
![]() .
The storage constraints force the system to assign each
service more memory to meet its target; as load
increases, it allocates proportionally more memory to
service 1 because it requires a higher H to meet the same target.
As a result, service 1 shows a lower I/O load on its more constrained
storage server. This is an example of how the model-based
provisioning policies (here embodied in LocalAdjust) achieve similar
goals to storage-aware caching [16].
.
The storage constraints force the system to assign each
service more memory to meet its target; as load
increases, it allocates proportionally more memory to
service 1 because it requires a higher H to meet the same target.
As a result, service 1 shows a lower I/O load on its more constrained
storage server. This is an example of how the model-based
provisioning policies (here embodied in LocalAdjust) achieve similar
goals to storage-aware caching [16].
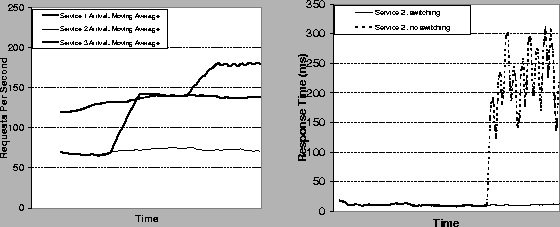
The last experiment uses a rudimentary assignment planner to illustrate the role of assignment in partitioning cluster resources for response time targets. We compared two runs of three services on two Dash servers under the synthetic loads shown on the left-hand side of Figure 13, which shows a saturating load spike for service 3. In the first run, service 1 is bound to server A and services 2 and 3 are bound to server B. This results in a response time jump for service 2, shown in the right-hand graph in Figure 13; since the system cannot meet targets for both services, it uses GroupAdjust to provision B's resources for the best average-case response time. The second run employs a simple bin-packing scheme to assign the provisioned resource slices to servers. In this run, the system reassigns service 2 to Awhen the load spike for service 3 exposes the local resource constraint on B; this is possible because Candidate determines that there are sufficient resources on A to meet the response time targets for both services 1 and 2. To implement this choice, the executive directs the switch to route requests for service 2 to A rather than B. This allows service 2 to continue meeting its target. This simple example shows the power of the model-based provisioning primitives as a foundation for comprehensive resource management for cluster utilities.