Wei Zheng,![]() Ricardo Bianchini,
Ricardo Bianchini,![]() G. John Janakiraman,
G. John Janakiraman,![]() Jose Renato Santos,
Jose Renato Santos,![]() and Yoshio Turner
and Yoshio Turner![]()
![]() Department of Computer Science
Department of Computer Science![]() HP Labs
HP LabsRutgers University
Hewlett-Packard Corporation
{wzheng,ricardob}@cs.rutgers.edu
{joserenato.santos,yoshio.turner}@hp.com
Managing data centers is a challenging endeavor, especially when done manually by system administrators. One of the main challenges is that performing many management tasks involves selecting a proper resource allocation or system configuration out of a potentially large number of possible alternatives. Even worse, evaluating each possible management decision often requires understanding its performance, availability, and energy consumption implications. For example, a common management task is to partition the system's resources across applications to optimize performance and/or energy consumption, as is done in server consolidation and virtual machine (VM) placement. Another example is the evaluation of software or hardware upgrades, which involves determining whether application or system behavior will benefit from the candidate upgrades and by how much. Along the same lines, capacity planning is a common management task that involves selecting a proper system configuration for a set of applications.
Previous efforts have automated resource-partitioning tasks using simple heuristics and/or feedback control, e.g. [1,6,18,21,28,29]. These policies repeatedly adjust the resource allocation to a change in system behavior, until their performance and/or energy goals are again met. Unfortunately, when this react-and-observe approach is not possible, e.g. when evaluating software or hardware upgrades, these policies cannot be applied.
In contrast, analytical modeling can be used to automate all of these management tasks. Specifically, modeling can be used to predict the impact of the possible management decisions or system configurations on performance, availability, and/or energy consumption. With these predictions, the management system can make the best decision. For example, researchers have built resource-partitioning systems for hosting centers that use models to predict throughput and response time, e.g. [9,27]. In addition, researchers have built systems that use models to maximize energy conservation in data centers, e.g. [7,13]. Finally, researchers have been building models that can predict the performance of Internet applications on CPUs with different characteristics [23]; such models can be used in deciding whether to upgrade the server hardware.
Performance models are often based on queuing theory, whereas availability models are often based on Markovian formalisms. Energy models are typically based on simple (but potentially inaccurate) models of power consumption, as a function of CPU utilization or CPU voltage/frequency. On the bright side, these models are useful in data center management as they provide insight into the systems' behaviors, can be solved quickly, and allow for large parameter space explorations. Essentially, the models provide an efficient way of answering ``what-if'' questions during management tasks.
Unfortunately, modeling has a few serious shortcomings. First, modeling consumes a very expensive resource: highly skilled human labor to produce, calibrate, and validate the models. Second, the models typically rely on simplifying assumptions. For example, memoryless arrivals is a common assumption of queuing models for Internet services [24]. However, this assumption is invalid when requests come mostly from existing sessions with the service. Another common simplifying assumption is the cubic relationship between CPU frequency and power consumption [7]. With advances in CPU power management, such as clock gating, the exact power behavior of the CPU is becoming more complex and, thus, more difficult to model accurately. Third, the models need to be re-calibrated and re-validated as the systems evolve. For example, the addition of new machines to a service requires queuing models to be calibrated and validated for them.
Given these limitations, in this paper we argue that actual experiments are a better approach than modeling for supporting many management tasks. Actual experiments exchange an expensive resource (human labor) for much cheaper ones (the time and energy consumed by a few machines in running the experiments). Moreover, they do not rely on simplifying assumptions or require calibration and validation. Thus, actual experiments are cheaper, simpler, and more accurate than models in their ability to answer ``what-if'' questions. We further argue that the experiments can be performed in a flexible, realistic, and transparent manner by leveraging current virtualization technology.
To support our claims in a challenging environment, we built JustRunIt, an infrastructure for experiment-based management of virtualized data centers hosting multiple Internet services. JustRunIt creates a sandboxed environment in which experiments can be run on a small number of machines (e.g., one machine per tier of a service) without affecting the on-line system. JustRunIt clones a small subset of the on-line VMs (e.g., one VM per tier of the service) and migrates them to the sandbox. In the sandbox, JustRunIt precisely controls the resources allocated to the VMs, while offering the same workload to them that is offered to similar VMs on-line. Workload duplication is implemented by JustRunIt's server proxies. For flexibility, the administrator can specify the resources (and the range of allocations) with which to experiment and how long experiments should be run. If there is not enough time to run all possible experiments (i.e., all combinations of acceptable resource allocations), JustRunIt uses interpolation between actual experimental results to produce the missing results but flags them as potentially inaccurate.
Automated management systems or the system administrator can use the JustRunIt results to perform management tasks on the on-line system. If any interpolated results are actually used by the system or administrator, JustRunIt runs the corresponding experiments in the background and warns the administrator if any experimental result differs from the corresponding interpolated result by more than a threshold amount.
To evaluate our infrastructure, we apply it to systems that automate two common management tasks: server consolidation/expansion and evaluation of hardware upgrades. Modeling has been used in support of both tasks [7,24], whereas feedback control is only applicable for some cases of the former [7]. JustRunIt combines nicely with both systems. Our evaluation demonstrates that JustRunIt can produce results realistically and transparently, enabling automated management systems to perform their tasks effectively. In fact, JustRunIt can produce system configurations that are as good as those resulting from idealized, perfectly accurate models, at the cost of the time and energy dedicated to experiments.
The remainder of the paper is organized as follows. The next section describes JustRunIt in detail. Section 3 describes the automated management systems that we designed for our two case studies. Section 4 presents our evaluation of JustRunIt and the results of our case studies. Section 5 overviews the related work. Finally, Section 6 draws our conclusions, discusses the limitations of JustRunIt, and mentions our future work.
Our target environment is virtualized data centers that host multiple independent Internet services. Each service comprises multiple tiers. For instance, a typical three-tier Internet service has a Web tier, an application tier, and a database tier. Each tier may be implemented by multiple instances of a software server, e.g. multiple instances of Apache may implement the first tier of a service. Each service has strict response-time requirements specified in SLAs (Service Level Agreements) negotiated between the service provider and the data center.
In these data centers, all services are hosted in VMs for performance and fault isolation, easy migration, and resource management flexibility. Moreover, each software server of a service is run on a different VM. VMs hosting software servers from different services may co-locate on a physical machine (PM). However, VMs hosting software servers from the same service tier are hosted on different PMs for high availability. All VMs have network-attached storage provided by a storage server.
|
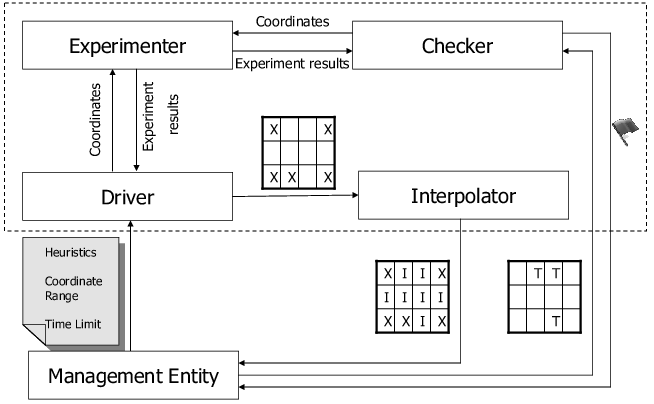
Figure 1 shows an overview of the system infrastructure of JustRunIt. There are four components: experimenter, driver, interpolator, and checker. The experimenter implements the VM cloning and workload duplication mechanism to run experiments. Each experiment tests a possible configuration change to a cloned software server under the current live workload. A configuration change may be a different resource allocation (e.g., a larger share of the CPU) or a different hardware setting (e.g., a higher CPU voltage/frequency). The results of each experiment are reported as the server throughput, response time, and energy consumption observed under the tested configuration.
The experiment driver chooses which experiments to run in order to efficiently explore the configuration parameter space. The driver tries to minimize the number of experiments that must be run while ensuring that all the experiments complete within a user-specified time bound. The driver and experimenter work together to produce a matrix of experimental results in the configuration parameter space. The coordinates of the matrix are the configuration parameter values for each type of resource, and the values recorded at each point are the performance and energy metrics observed for the corresponding resource assignments.
Blank entries in the matrix are filled in by the interpolator, based on linear interpolation from the experimental results in the matrix. The filled matrix is provided to the management entity-i.e., the system administrator or an automated management system-for use in deciding resource allocations for the production system.
If the management entity uses any of the interpolated performance or energy values, the checker invokes the experimenter to run experiments to validate those values. If it turns out that the difference between the experimental results and the interpolated results exceeds a user-specified threshold value, then the checker notifies the management entity.
We describe the design of each component of JustRunIt in detail in the following subsections.
To run experiments, the experimenter component of JustRunIt transparently clones a subset of the live production system into a sandbox and replays the live workload to the sandbox system. VM cloning instantly brings the sandbox to the same operational state as the production system, complete with fully warmed-up application-level and OS-level caches (e.g., file buffer cache). Thus, tests can proceed with low startup time on a faithful replica of the production system. By cloning only a subset of the system, JustRunIt minimizes the physical resources that must be dedicated to testing. Workload replay to the sandbox is used to emulate the timing and functional behavior of the non-duplicated portions of the system.

|
The use of JustRunIt in a typical virtualized data center is illustrated in Figure 2. The figure shows VMs of multiple three-tier services sharing each PM. Each service tier has multiple identically configured VMs placed on different PMs. (Note that VMs of one tier do not share PMs with VMs of other tiers in the figure. Although JustRunIt is agnostic to VM placement, this restriction on VM placement is often used in practice to reduce software licensing costs [18].) For simpler management, the set of PMs in each tier is often homogeneous.
The figure also shows one VM instance from each tier of service 2 being cloned into the sandbox for testing. This is just an example use of JustRunIt; we can use different numbers of PMs in the sandbox, as we discuss later. Configuration changes are applied to the clone server, and the effects of the changes are tested by replaying live traffic duplicated from the production system. The sandbox system is monitored to determine the resulting throughput, response time, and energy consumption. The experimenter reports these results to the driver to include in the matrix described in Section 2.2. If experiments are run with multiple service tiers, a different matrix will be created for each tier.
Although it may not be immediately obvious, the experimenter assumes that the virtual machine monitor (VMM) can provide performance isolation across VMs and includes non-work-conserving resource schedulers. These features are required because the experiments performed in the sandbox must be realistic representations of what would happen to the tested VM in the production system, regardless of any other VMs that may be co-located with it. We can see this by going back to Figure 2. For example, the clone VM from the application tier of service 2 must behave the same in the sandbox (where it is run alone on a PM) as it would in the production system (where it is run with A1, A3, or both), given the same configuration. Our current implementation relies on the latest version of the Xen VMM (3.3), which provides isolation for the setups that we consider.
Importantly, both performance isolation and non-work-conserving schedulers are desirable characteristics in virtualized data centers. Isolation simplifies the VM placement decisions involved in managing SLAs, whereas non-work-conserving schedulers allow more precise resource accounting and provide better isolation [18]. Most critically, both characteristics promote performance predictability, which is usually more important than achieving the best possible performance (and exceeding the SLA requirements) in hosting centers.
Cloning. Cloning is accomplished by minimally
extending standard VM live migration
technology [8,16]. The
Xen live migration mechanism copies dirty memory pages of a running VM
in the background until the number of dirty pages is reduced below a
predefined threshold. Then VM execution is paused for a short time
(tens of milliseconds) to copy the remaining dirty pages to the
destination. Finally, execution transfers to the new VM, and the
original VM is destroyed. Our cloning mechanism changes live
migration to resume execution on both the new VM and the original VM.
Since cloning is transparent to the VM, the clone VM inherits the same network identity (e.g., IP/MAC addresses) as the production VM. To avoid network address conflicts, the cloning mechanism sets up network address translation to transparently give the clone VM a unique external identity exposed to the network while concealing the clone VM's internal addresses. We implemented this by extending Xen's backend network device driver (``netback'') to perform appropriate address translations and protocol checksum corrections for all network traffic to and from the clone VM.
The disk storage used by the clone VMs must also be replicated. During the short pause of the production system VM at the end of state transfer, the cloning mechanism creates a copy-on-write snapshot of the block storage volumes used by the production VM, and assigns them to the clone VM. We implemented this using the Linux LVM snapshot capability and by exporting volumes to VMs over the network using iSCSI or ATA Over Ethernet. Snapshotting and exporting the storage volumes incurs only a sub-second delay during cloning. Storage cloning is transparent to the VMs, which see logical block devices and do not know that they are accessing network storage.
JustRunIt may also be configured not to perform VM cloning in the sandbox. This configuration allows it to evaluate upgrades of the server software (e.g., Apache), operating system, and/or service application (as long as the application upgrade does not change the application's messaging behavior). In these cases, the management entity has to request experiments that are long enough to amortize any cold-start caching effects in the sandbox execution. However, long experiments are not a problem, since software upgrades typically do not have stringent time requirements.
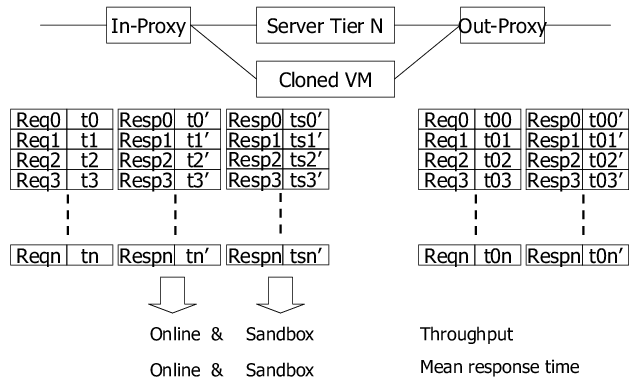
Proxies. To carry out testing, the experimenter
replays live workload to the VMs in the sandbox. Two low-overhead
proxies, called in-proxy and out-proxy, are inserted into
communication paths in the production system to replicate traffic to
the sandbox. The proxies are application protocol-aware and can be
(almost entirely) re-used across services that utilize the same
protocols, as we detail below. The in-proxy mimics the behavior of
all the previous tiers before the sandbox, and the out-proxy mimics
the behavior of all the following tiers. The local view of a VM, its
cloned sandbox VM, and the proxies is shown in Figure 3.
After cloning, the proxies create as many connections with the cloned VM as they have with the original VM. The connections that were open between the proxies and the original VM at the time it was cloned will timeout at the cloned VM. In fact, no requests that were active in the original VM at the time of cloning get successfully processed at the cloned VM.
The in-proxy intercepts requests from previous tiers to the tested VM.
When a request arrives, the in-proxy records the request (![]() in
Figure 3) and its arrival time (
in
Figure 3) and its arrival time (![]() ). The in-proxy
forwards the request to the on-line production system and also sends a
duplicate request to the sandbox for processing. To prevent the
sandbox system from running ahead of the production system, the
transmission of the duplicate request is delayed by a fixed time
interval (it is sufficient for the fixed time shift to be set to any
value larger than the maximum response time of the service plus the
cloning overhead). Both systems process the duplicated requests and
eventually generate replies that are intercepted by the in-proxy. For
the reply from the production system, the in-proxy records its arrival
time (
). The in-proxy
forwards the request to the on-line production system and also sends a
duplicate request to the sandbox for processing. To prevent the
sandbox system from running ahead of the production system, the
transmission of the duplicate request is delayed by a fixed time
interval (it is sufficient for the fixed time shift to be set to any
value larger than the maximum response time of the service plus the
cloning overhead). Both systems process the duplicated requests and
eventually generate replies that are intercepted by the in-proxy. For
the reply from the production system, the in-proxy records its arrival
time (![]() ) and forwards the reply back to the previous tier. Later,
when the corresponding reply from the sandbox arrives, the in-proxy
records its arrival time (
) and forwards the reply back to the previous tier. Later,
when the corresponding reply from the sandbox arrives, the in-proxy
records its arrival time (![]() ). The arrival times are used to
measure the response times of the production and sandbox systems.
). The arrival times are used to
measure the response times of the production and sandbox systems.
The production and sandbox VMs may need to send requests to the next
tier to satisfy a request from the previous tier. These (duplicated)
requests are intercepted by the out-proxy. The out-proxy records the
arrival times (![]() ) and content of the requests from the production
system, and forwards them to the next tier. The out-proxy also
records the arrival times (
) and content of the requests from the production
system, and forwards them to the next tier. The out-proxy also
records the arrival times (![]() ) and content of the corresponding
replies, and forwards them to the production system. When the
out-proxy receives a request from the sandbox system, it uses hash
table lookup to find the matching request that was previously received
from the production system. (Recall that the matching request will
certainly have been received because the replay to the sandbox is
time-shifted by more than the maximum response time of the service.)
The out-proxy transmits the recorded reply to the sandbox after a
delay. The delay is introduced to accurately mimic the delays of the
subsequent tiers and is equal to the delay that was previously
experienced by the production system (
) and content of the corresponding
replies, and forwards them to the production system. When the
out-proxy receives a request from the sandbox system, it uses hash
table lookup to find the matching request that was previously received
from the production system. (Recall that the matching request will
certainly have been received because the replay to the sandbox is
time-shifted by more than the maximum response time of the service.)
The out-proxy transmits the recorded reply to the sandbox after a
delay. The delay is introduced to accurately mimic the delays of the
subsequent tiers and is equal to the delay that was previously
experienced by the production system (![]() ) for the same
request-reply pair.
) for the same
request-reply pair.
At the end of an experiment, the in-proxy reports the throughput and response time results for the production and sandbox systems. The throughput for each system is determined by the number of requests successfully served from the tiers following the in-proxy. The response time for each system is defined as the delay after a request arrives to the in-proxy until its reply is received. Since out-proxies enforce that the delays of subsequent tiers are equal for the production and sandbox system, the difference of throughput and response time between the production and sandbox systems is the performance difference between the original VM and cloned VM.
The proxies can be installed dynamically anywhere in the system, depending on which VMs the management entity may want to study at the time. However, we have only implemented in-proxies and out-proxies for Web and application servers so far. Cross-tier interactions between proxies, i.e. the communication between the out-proxy of the Web tier and the in-proxy of the application tier, occur in exactly the same way as the communication between regular servers.
In future work, we plan to implement an in-proxy for database servers by borrowing code from the Clustered-JDBC (C-JDBC) database middleware [5]. Briefly, C-JDBC implements a software controller between a JDBC application and a set of DBMSs. In its full-replication mode, C-JDBC keeps the content of the database replicated and consistent across the DBMSs. During experimentation, our in-proxy will do the same for the on-line and sandboxed DBMSs. Fortunately, C-JDBC already implements the key functionality needed for cloning, namely the ability to integrate the sandboxed DBMS and update its content for experimentation. To complete our in-proxy, we plan to modify C-JDBC to record the on-line requests and later replay them to the sandboxed DBMS. We have modified C-JDBC in similar ways [17].
Non-determinism. A key challenge for workload replay
is to tolerate non-deterministic behavior in the production and
sandbox systems. We address non-determinism in three ways. First, to
tolerate network layer non-determinism (e.g., packet drops) the
proxies replicate application-layer requests and replies instead of
replicating network packets directly.
Second, the replay is implemented so that the sandboxed servers can process requests and replies in a different order than their corresponding on-line servers; only the timing of the message arrivals at the sandboxed servers is guaranteed to reflect that of the on-line servers. This ordering flexibility tolerates non-determinism in the behavior of the software servers, e.g. due to multithreading. However, note that this flexibility is only acceptable for Web and application-tier proxies, since requests from different sessions are independent of each other in those tiers. We will need to enforce ordering more strictly in the in-proxy for database servers, to prevent the original and cloned databases from diverging. Our in-proxy will do so by forcing each write (and commit) to execute by itself during experimentation only forcing a complete ordering between all pairs of read-write and write-write operations; concurrent reads will be allowed to execute in any order. We have successfully created this strict ordering in C-JDBC before [17] and saw no noticeable performance degradation for one of the services we study in this paper.
Third, we tolerate application-layer non-determinism by designing the proxies to be application protocol-aware (e.g., the Web server in-proxies understand HTTP message formats). The proxies embody knowledge of the fields in requests and replies that can have non-deterministic values (e.g., timestamps, session IDs). When the out-proxy sees a non-deterministic value in a message from the sandbox, the message is matched against recorded messages from the production system using wildcards for the non-deterministic fields.
Our study of two services (an auction and a bookstore) shows that our proxies effectively tolerate their non-determinism. Even though some messages in these services have identical values except for a non-deterministic field, our wildcard mechanism allows JustRunIt to properly match replies in the production and sandbox systems for two reasons. First, all replies from the sandbox are dropped by the proxies, preventing them from disrupting the on-line system. Second, using different replies due to wildcard mismatch does not affect the JustRunIt results because the replies are equivalent and all delays are still accounted for.
We plan to study non-determinism in an even broader range of services. In fact, despite our promising experience with the auction and bookstore services, some types of non-determinism may be hard for our proxies to handle. In particular, services that non-deterministically change their messaging behavior (not just particular fields or the destination of the messages) or their load processing behavior (e.g., via non-deterministic load-shedding) would be impossible to handle. For example, a service in which servers may send an unpredictable number of messages in response to each request cannot be handled by our proxies. We have not come across any such services, though.
Running experiments is not free. They cost time and energy. For this reason, JustRunIt allows the management entity to configure the experimentation using a simple configuration file. The entity can specify the tier(s) with which JustRunIt should experiment, which experiment heuristics to apply (discussed below), which resources to vary, the range of resource allocations to consider, how many equally separated allocation points to consider in the range, how long each experiment should take, and how many experiments to run. These parameters can directly limit the time and indirectly limit the energy consumed by the experiments, when there are constraints on these resources (as in Section 3.1). When experiment time and energy are not relevant constraints (as in Section 3.2), the settings for the parameters can be looser.
Based on the configuration information, the experiment driver directs the experimenter to explore the parameter space within the time limit. The driver starts by running experiments to fill in the entries at the corners of the result matrix. For example, if the experiments should vary the CPU allocation and the CPU frequency, the matrix will have two dimensions and four corners: (min CPU alloc, min CPU freq), (min CPU alloc, max CPU freq), (max CPU alloc, min CPU freq), and (max CPU alloc, max CPU freq). The management entity must configure JustRunIt so at least these corner experiments can be performed. After filling in the corner coordinates, the driver then proceeds to request experiments exactly in the middle of the unexplored ranges defined by each resource dimension. After those are performed, it recursively sub-divides the unexplored ranges in turn. This process is repeated until the number of experiments requested by the management entity have been performed or there are no more experiments to perform.
We designed two heuristics for the driver to use to avoid running unnecessary experiments along each matrix dimension. The two observations behind the heuristics are that: 1) beyond some point, resource additions do not improve performance; 2) the performance gain for the same resource addition to different tiers will not be the same, and the gains drop consistently and continually (diminishing returns).
Based on observation 1), the first heuristic cancels the remaining experiments with larger resource allocations along the current resource dimension, if the performance gain from a resource addition is less than a threshold amount. Based on observation 2), the second heuristic cancels the experiments with tiers that do not produce the largest gains from a resource addition. As we add more resources to the current tier, the performance gains decrease until some other tier becomes the tier with the largest gain from the same resource addition. For example, increasing the CPU allocation on the bottleneck tier, say the application tier, will significantly improve overall response time. At some point, however, the bottleneck will shift to other tiers, say the Web tier, at which point the driver will experiment with the Web tier and gain more overall response time improvement with the same CPU addition.
The interpolator predicts performance results for points in the matrix that have not yet been determined through experiments. For simplicity, we use linear interpolation to fill in these blanks, and we mark the values to indicate that they are just interpolated.
If the management entity uses any interpolated results, the checker tries to verify the interpolated results by invoking the experimenter to run the corresponding experiments in the background. If one of these background experimental results differs from the corresponding interpolated result by more than a user-specified threshold value, the checker raises a flag to the management entity to decide how to handle this mismatch.
The management entity can use this information in multiple ways. For example, it may reconfigure the driver to run more experiments with the corresponding resources from now on. Another option would be to reconfigure the range of allocations to consider in the experiments from now on.
Uses of JustRunIt. We expect that JustRunIt will be useful for many system management scenarios. For example, in this paper we consider resource management and hardware upgrade case studies. In these and other scenarios, JustRunIt can be used by the management entity to safely, efficiently, and realistically answer the same ``what-if'' questions that modeling can answer given the current workload and load intensity.
Moreover, like modeling, JustRunIt can benefit from load intensity prediction techniques to answer questions about future scenarios. JustRunIt can do so because its request replay is shifted in time and can be done at any desired speed. (Request stream acceleration needs to consider whether requests belong to an existing session or start a new session. JustRunIt can properly accelerate requests because it stores enough information about them to differentiate between the two cases.) Section 6 discusses how the current version of JustRunIt can be modified to answer ``what-if'' questions about different workload mixes as well.
Although our current implementation does not implement this functionality, JustRunIt could also be used to select the best values for software tunables, e.g. the number of threads or the size of the memory cache in Web servers. Modeling does not lend itself directly to this type of management task. Another possible extension could be enabling JustRunIt to evaluate the correctness of administrator actions, as in action-validation systems [15,17]. All the key infrastructure required by these systems (i.e., proxies, cloning, sandboxing) is already part of the current version of JustRunIt, so adding the ability to validate administrator actions should be a simple exercise. Interestingly, this type of functionality cannot be provided by analytic models or feedback control.
Obviously, JustRunIt can answer questions and validate administrator actions at the cost of experiment time and energy. However, note that the physical resources required by JustRunIt (i.e., enough computational resources for the proxies and for the sandbox) can be a very small fraction of the data center's resources. For example, in Figure 2, we show that just three PMs are enough to experiment with all tiers of a service at the same time, regardless of how large the production system is. Even fewer resources, e.g. one PM, can be used, as long as we have the time to experiment with VMs sequentially. Furthermore, the JustRunIt physical resources can be borrowed from the production system itself, e.g. during periods of low load.
In essence, JustRunIt poses an interesting tradeoff between the amount of physical resources it uses, the experiment time that needs to elapse before decisions can be made, and the energy consumed by its resources. More physical resources translate into shorter experiment times but higher energy consumption. For this reason, we allow the management entity to configure JustRunIt in whatever way is appropriate for the data center.
Engineering cost of JustRunIt. Building the JustRunIt
proxies is the most time-consuming part of its implementation. The
proxies must be designed to properly handle the communication
protocols used by services. Our current proxies understand the HTTP,
mod_jk, and MySQL protocols. We have built our proxies starting from
the publicly available Tinyproxy HTTP proxy daemon [2]. Each
proxy required only between 800 and 1500 new lines of C code. (VM
cloning required 42 new lines of Python code in the xend control
daemon and the xm management tool, whereas address translation
required 244 new lines of C code in the netback driver.) The vast
majority of the difference between Web and application server proxies
comes from their different communication protocols.
The engineering effort required by the proxies can be amortized, as they can be reused for any service based on the same protocols. However, the proxies may need modifications to handle any non-determinism in the services themselves. Fortunately, our experience with the auction and bookstore services suggests that the effort involved in handling service-level non-determinism may be small. Specifically, it took one of us (Zheng) less than one day to adapt the proxies designed for the auction to the bookstore. This is particularly promising in that he had no prior knowledge of the bookstore whatsoever.
One may argue that implementing JustRunIt may require a comparable amount of effort to developing accurate models for a service. We have experience with modeling the performance, energy, and temperature of server clusters and storage systems [4,13,12,19] and largely agree with this claim. However, we note that JustRunIt is much more reusable than models, across different services, hardware and software characteristics, and even as service behavior evolves. Each of these factors requires model re-calibration and re-validation, which are typically labor-intensive. Furthermore, for models to become tractable, many simplifying assumptions about system behavior (e.g., memoryless request arrivals) may have to be made. These assumptions may compromise the accuracy of the models. JustRunIt does not require these assumptions and produces accurate results.
As mentioned in the previous section, our infrastructure can be used by automated management systems or directly by the system administrator. To demonstrate its use in the former scenario, we have implemented simple automated management systems for two common tasks in virtualized hosting centers: server consolidation/expansion (i.e., partitioning resources across the services to use as few active servers as possible) and evaluation of hardware upgrades. These tasks are currently performed by most administrators in a manual, labor-intensive, and ad-hoc manner.
Both management systems seek to satisfy the services' SLAs. An SLA often specifies a percentage of requests to be serviced within some amount of time. Another possibility is for the SLA to specify an average response time (over a period of several minutes) for the corresponding service. For simplicity, our automated systems assume the latter type of SLA.
The next two subsections describe the management systems. However, before describing them, we note that they are not contributions of this work. Rather, they are presented simply to demonstrate the automated use of JustRunIt. More sophisticated systems (or the administrator) would leverage JustRunIt in similar ways.
Overview. The ultimate goal of our resource-management system is to consolidate the hosted services onto the smallest possible set of nodes, while satisfying all SLAs. To achieve this goal, the system constantly monitors the average response time of each service, comparing this average to the corresponding SLA. Because workload conditions change over time, the resources assigned to a service may become insufficient and the service may start violating its SLA. Whenever such a violation occurs, our system initiates experiments with JustRunIt to determine what is the minimum allocation of resources that would be required for the service's SLA to be satisfied again. Changes in workload behavior often occur at the granularity of tens of minutes or even hours, suggesting that the time spent performing experiments is likely to be relatively small. Nevertheless, to avoid having to perform adjustments too frequently, the system assigns 20% more resources to a service than its minimum needs. This slack allows for transient increases in offered load without excessive resource waste. Since the resources required by the service have to be allocated to it, the new resource allocation may require VM migrations or even the use of extra nodes.
Conversely, when the SLA of any service is being satisfied by more than a threshold amount (i.e., the average response time is lower than that specified by the SLA by more than a threshold percentage), our system considers the possibility of reducing the amount of resources dedicated to the service. It does so by initiating experiments with JustRunIt to determine the minimum allocation of resources that would still satisfy the service's SLA. Again, we give the service additional slack in its resource allocation to avoid frequent reallocations. Because resources can be taken away from this service, the new combined resource needs of the services may not require as many PMs. In this case, the system determines the minimum number of PMs that can be used and implements the required VM migrations.
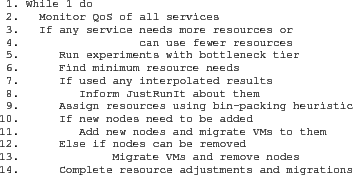
Details. Figure 4 presents
pseudo-code overviewing the operation of our management system. The
experiments with JustRunIt are performed in line 5.
The management system only runs experiments with one software server
of the bottleneck tier of the service in question. The management
system can determine the bottleneck tier by inspecting the resource
utilization of the servers in each tier. Experimenting with one
software server is typically enough for two reasons: (1) services
typically balance the load evenly across the servers of each tier; and
(2) the VMs of all software servers of the same tier and service are
assigned the same amount of resources at their PMs. (When at least
one of these two properties does not hold, the management system needs
to request more experiments of JustRunIt.) However, if enough nodes
can be used for experiments in the sandbox, the system could run
experiments with one software server from each tier of the service at
the same time.
The matrix of resource allocations vs. response times produced by JustRunIt is then used to find the minimum resource needs of the service in line 6. Specifically, the management system checks the results in the JustRunIt matrix (from smallest to largest resource allocation) to find the minimum allocation that would still allow the SLA to be satisfied. In lines 7 and 8, the system informs JustRunIt about any interpolated results that it may have used in determining the minimum resource needs. JustRunIt will inform the management system if the interpolated results are different than the actual experimental results by more than a configurable threshold amount.
In line 9, the system executes a resource assignment algorithm that will determine the VM to PM assignment for all VMs of all services. We model resource assignment as a bin-packing problem. In bin-packing, the goal is to place a number of objects into bins, so that we minimize the number of bins. We model the VMs (and their resource requirements) as the objects and the PMs (and their available resources) as the bins. If more than one VM to PM assignment leads to the minimum number of PMs, we break the tie by selecting the optimal assignment that requires the smallest number of migrations. If more than one assignment requires the smallest number of migrations, we pick the one of these assignments randomly. Unfortunately, the bin-packing problem is NP-complete, so it can take an inordinate amount of time to solve it optimally, even for hosting centers of moderate size. Thus, we resort to a heuristic approach, namely simulated annealing [14], to solve it.
Finally, in lines 10-14, the resource-allocation system adjusts the number of PMs and the VM to PM assignment as determined by the best solution ever seen by simulated annealing.
Comparison.
A model-based implementation for this management system would be
similar; it would simply replace lines 5-8 with a call to a
performance model solver.
Obviously, the model would have to have been created, calibrated, and
validated a priori.
A feedback-based implementation would replace lines 5-8 by a call to the controller to execute the experiments that will adjust the offending service. However, note that feedback control is only applicable when repeatedly varying the allocation of a resource or changing a hardware setting does not affect the on-line behavior of the co-located services. For example, we can use feedback control to vary the CPU allocation of a service without affecting other services. In contrast, increasing the amount of memory allocated to a service may require decreasing the allocation of another service. Similarly, varying the voltage setting for a service affects all services running on the same CPU chip, because the cores in current chips share the same voltage rail. Cross-service interactions are clearly undesirable, especially when they may occur repeatedly as in feedback control. The key problem is that feedback control experiments with the on-line system. With JustRunIt, bin-packing and node addition/removal occur before any resource changes are made on-line, so interference can be completely avoided in most cases. When interference is unavoidable, e.g. the offending service cannot be migrated to a node with enough available memory and no extra nodes can be added, changes to the service are made only once.
Overview. For our second case study, we built a management system to evaluate hardware upgrades. The system assumes that at least one instance of the hardware being considered is available for experimentation in the sandbox. For example, consider a scenario in which the hosting center is considering purchasing machines of a model that is faster or has more available resources than that of its current machines. After performing experiments with a single machine of the candidate model, our system determines whether the upgrade would allow servers to be consolidated onto a smaller number of machines and whether the overall power consumption of the hosting center would be smaller than it currently is. This information is provided to the administrator, who can make a final decision on whether or not to purchase the new machines and ultimately perform the upgrade.
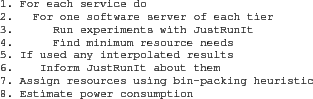
Details. Figure 5 presents
pseudo-code overviewing our update-evaluation system. The experiments
with JustRunIt are started in line 3. For this system, the matrix
that JustRunIt produces must include information about the average
response time and the average power consumption of each resource
allocation on the upgrade-candidate machine. In line 4, the system
determines the resource allocation that achieves the same average
response time as on the current machine (thus guaranteeing that the
SLA would be satisfied by the candidate machine as well). Again, the
administrator configures the system to properly drive JustRunIt and
gets informed about any interpolated results that are used in line 4.
By adding the extra 20% slack to these minimum requirements and running the bin-packing algorithm described above, the system determines how many new machines would be required to achieve the current performance and how much power the entire center would consume. Specifically, the center power can be estimated by adding up the power consumption of each PM in the resource assignment produced by the simulated annealing. The consumption of each PM can be estimated by first determining the ``base'' power of the candidate machine, i.e. the power consumption when the machine is on but no VM is running on it. This base power should be subtracted from the results in the JustRunIt matrix of each software server VM. This subtraction produces the average dynamic power required by the VM. Estimating the power of each PM then involves adding up the dynamic power consumption of the VMs that would run on the PM plus the base power.
Comparison.
Modeling has been used for this management task [7]. A
modeling-based implementation for our management system would replace
lines 2-6 in Figure 5 with a call to a performance
model solver to estimate the minimum resource requirements for each
service. Based on these results and on the resource assignment
computed in line 7, an energy model would estimate the energy
consumption in line 8. Again, both models would have to have been
created, calibrated, and validated a priori. In contrast,
feedback control is not applicable to this management task.
|
|
Our hardware comprises 15 HP Proliant C-class blades interconnected by a Gigabit Ethernet switch. Each server has 8 GBytes of DRAM, 2 hard disks, and 2 Intel dual-core Xeon CPUs. Each CPU has two frequency points, 2 GHz and 3 GHz. Two blades with direct-attached disks are used as network-attached storage servers. They export Linux LVM logical volumes to the other blades using ATA over Ethernet. One Gbit Ethernet port of every blade is used exclusively for network storage traffic. We measure the energy consumed by a blade by querying its management processor, which monitors the peak and average power usage of the entire blade.
Virtualization is provided by XenLinux kernel 2.6.18 with the Xen VMM [3], version 3.3. For improving Xen's ability to provide performance isolation, we pin Dom0 to one of the cores and isolate the service(s) from it. Note, however, that JustRunIt does not itself impose this organization. As JustRunIt only depends on the VMM for VM cloning, it can easily be ported to use VMMs that do not perform I/O in a separate VM.
We populate the blade cluster with one or more independent instances of an on-line auction service. To demonstrate the generality of our system, we also experiment with an on-line bookstore. Both services are organized into three tiers of servers: Web, application, and database tiers. The first tier is implemented by Apache Web servers (version 2.0.54), the second tier uses Tomcat servlet servers (version 4.1.18), and the third tier uses the MySQL relational database (version 5.0.27). (For performance reasons, the database servers are not virtualized and run directly on Linux and the underlying hardware.) We use LVS load balancers [30] in front of the Web and application tiers. The service requests are received by the Web servers and may flow towards the second and third tiers. The replies flow through the same path in the reverse direction.
We exercise each instance of the services using a client emulator. The auction workload consists of a ``bidding mix'' of requests (94% of the database requests are reads) issued by a number of concurrent clients that repeatedly open sessions with the service. The bookstore workload comprises a ``shopping mix'', where 20% of the requests are read-write. Each client issues a request, receives and parses the reply, ``thinks'' for a while, and follows a link contained in the reply. A user-defined Markov model determines which link to follow. The code for the services, their workloads, and the client emulator are from the DynaServer project [20] and have been used extensively by other research groups.
Our overhead evaluation seeks to answer two questions: (1) Does the overhead of JustRunIt (proxies, VM cloning, workload duplication, and reply matching) degrade the performance of the on-line services? and (2) How faithfully do servers in the sandbox represent on-line servers given the same resources?
To answer these questions, we use our auction service as implemented by one Apache VM, one Tomcat VM, and MySQL. Using a larger instance of the service would hide some of the overhead of JustRunIt, since the proxies only instrument one path through the service. Each of the VMs runs on a different blade. We use one blade in the sandbox. The two proxies for the Web tier run on one of the blades, whereas those for the application tier run on another. The proxies run on their own blades to promote performance isolation for the auction service. In all our experiments, the time shift used by JustRunIt is 10 seconds behind the on-line service.
|
|
Overhead on the on-line system? To isolate the
overhead of JustRunIt on the on-line service, we experiment with three
scenarios: (1) Plain - no proxies are installed; (2) ProxiesInstalled
- proxies are installed around the Web and application servers, but
they only relay the network traffic; and (3) JustRunIt - proxies are
installed around the Web and application servers and perform all the
JustRunIt functionality.
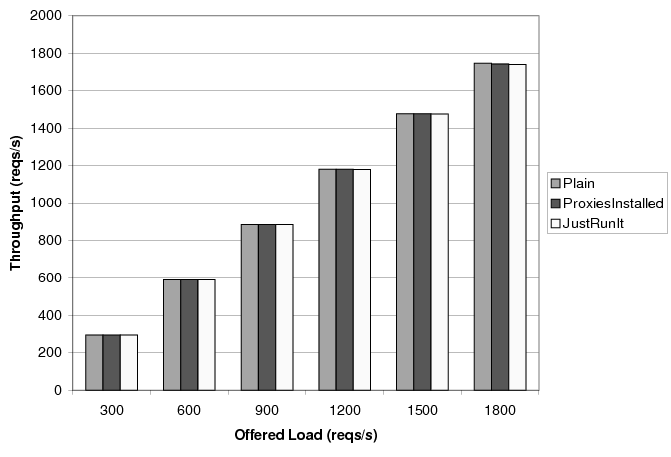
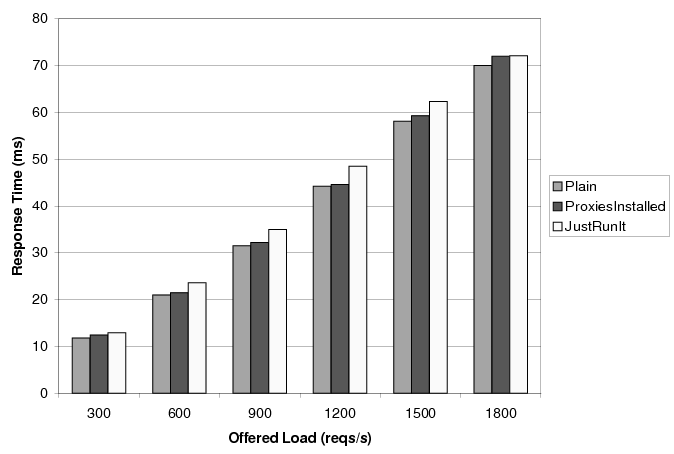
Figures 6 and 7 depict the average throughput and response time of the on-line service, respectively, as a function of the offered load. We set the CPU allocation of all servers to 100% of one core. In this configuration, the service saturates at 1940 requests/second. Each bar corresponds to a 200-second execution.
Figure 6 shows that JustRunIt has no effect on the throughput of the on-line service, even as it approaches saturation, despite having the proxies for each tier co-located on the same blade.
Figure 7 shows that the overhead of JustRunIt is
consistently small (![]() ) across load intensities. We are
currently in the process of optimizing the implementation to reduce
the JustRunIt overheads further. However, remember that the overheads
in Figure 7 are exaggerated by the fact that, in these
experiments, all application server requests are exposed to the
JustRunIt instrumentation. If we had used a service with 4
application servers, for example, only roughly 25% of those requests
would be exposed to the instrumentation (since we only need proxies
for 1 of the application servers), thus lowering the average overhead
by 75%.
) across load intensities. We are
currently in the process of optimizing the implementation to reduce
the JustRunIt overheads further. However, remember that the overheads
in Figure 7 are exaggerated by the fact that, in these
experiments, all application server requests are exposed to the
JustRunIt instrumentation. If we had used a service with 4
application servers, for example, only roughly 25% of those requests
would be exposed to the instrumentation (since we only need proxies
for 1 of the application servers), thus lowering the average overhead
by 75%.
Performance in the sandbox? The results above isolate
the overhead of JustRunIt on the on-line system. However, another
important consideration is how faithful the sandbox execution is to
the on-line execution given the same resources. Obviously, it would
be inaccurate to make management decisions based on sandboxed
experiments that are not very similar to the behavior of the on-line
system.
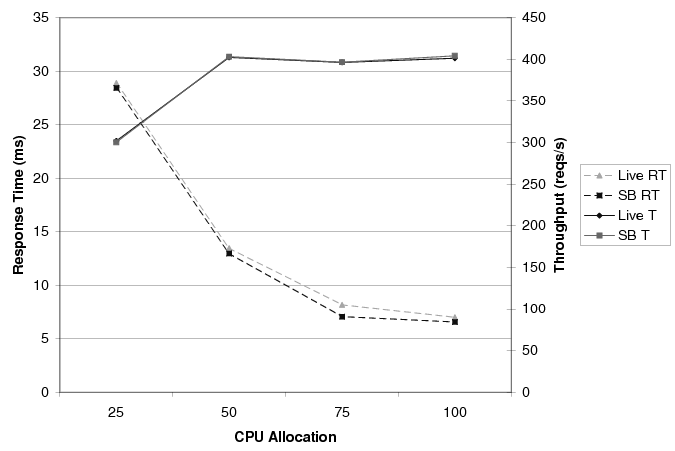
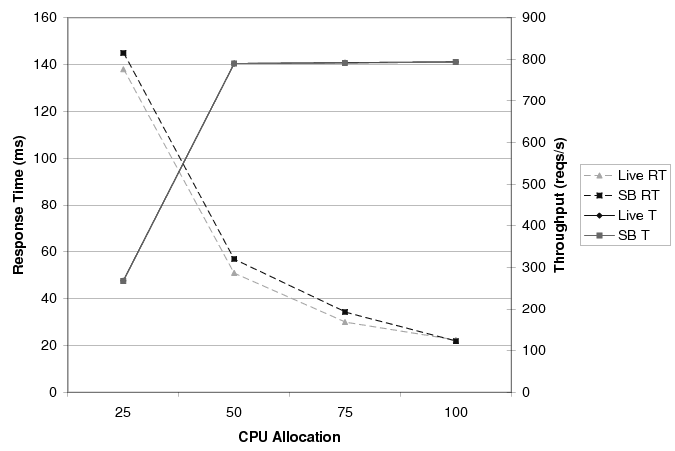
Figures 8 and 9 compare the performance of the on-line application server (labeled ``Live'') to that of the sandboxed (labeled ``SB'') application server at 500 requests/second and 1000 requests/second, respectively. In both figures, response times (labeled ``RT'') and throughputs (labeled ``T'') are measured at the application server's in-proxy. Again, each result represents the average performance over 200 seconds.
As one would expect, the figures show that increasing the CPU allocation tends to increase throughputs and reduce response times. The difference between the offered load and the achieved throughput is the 20% of requests that are served directly by the Web server and, thus, do not reach the application server's in-proxy. More interestingly, the figures clearly show that the sandboxed execution is a faithful representation of the on-line system, regardless of the offered load.
The results for the Web tier also show the sandboxed execution to be accurate. Like the application-tier results, we ran experiments with four different CPU allocations, under two offered loads. When the offered load is 500 reqs/s, the average difference between the on-line and sandboxed results is 4 requests/second for throughput and 1 ms for response time, across all CPU allocations. Even under a load of 1000 requests/second, the average throughput and response time differences are only 6 requests/second and 2 ms, respectively.
Our experiments with the bookstore service exhibit the same behaviors as in Figures 6 to 9. The throughput is not affected by JustRunIt and the overhead on the response time is small. For example, under an offered load of 300 requests/second, JustRunIt increases the mean response time for the bookstore from 18 ms to 22 ms. For 900 requests/second, the increase is from 54 ms to 58 ms. Finally, our worst result shows that JustRunIt increases the mean response time from 90 ms to 100 ms at 1500 requests/second.
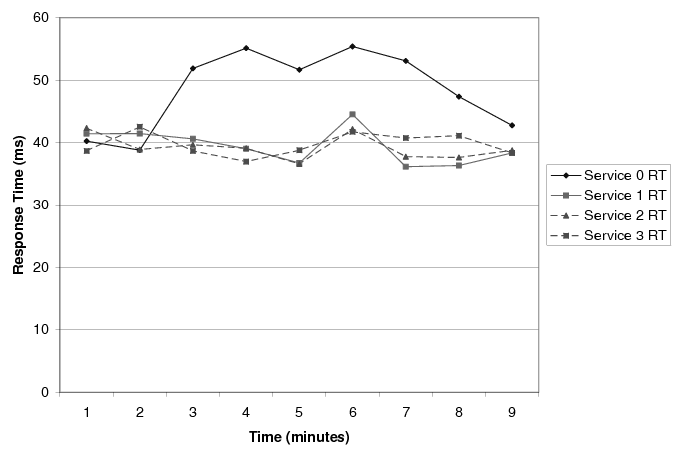
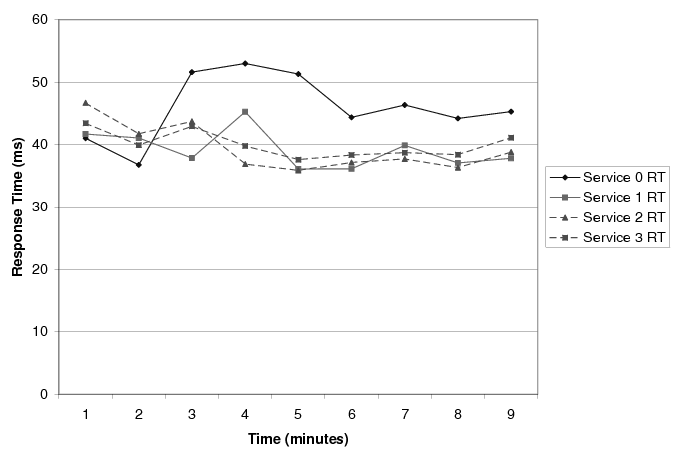
As mentioned before, we built an automated resource manager for a virtualized hosting center that leverages JustRunIt. To demonstrate the behavior of our manager, we created four instances of our auction service on 9 blades: 2 blades for first-tier servers, 2 blades for second-tier servers, 2 blades for database servers, and 3 blades for storage servers and LVS. Each first-tier (second-tier) blade runs one Web (application) server from each service. Each server VM is allocated 50% of one core as its CPU allocation. We assume that the services' SLAs require an average response time lower than 50 ms in every period of one minute. The manager requested JustRunIt to run 3 CPU-allocation experiments with any service that violated its SLA, for no longer than 3 minutes overall. A 10th blade is used for the JustRunIt sandbox, whereas 2 extra blades are used for its Web and application-server proxies. Finally, 2 more blades are used to generate load.
Figure 10 shows the response time of each service during our experiment; each point represents the average response time during the corresponding minute. We initially offered 1000 requests/second to each service. This offered load results in an average response time hovering around 40 ms. Two minutes after the start of the experiment, we increase the load offered to service 0 to 1500 requests/second. This caused its response time to increase beyond 50 ms during the third minute of the experiment. At that point, the manager started JustRunIt experiments to determine the CPU allocation that would be required for the service's application servers (the second tier is the bottleneck tier) to bring response time back below 50 ms under the new offered load. The set of JustRunIt experiments lasted 3 minutes, allowing CPU allocations of 60%, 80%, and 100% of a core to be tested. The values for 70% and 90% shares were interpolated based on the experimental results.
Based on the response-time results of the experiments, the manager determined that the application server VMs of the offending service should be given 72% of a core (i.e., 60% of a core plus the 20% of 60% = 12% slack). Because of the extra CPU allocation requirements, the manager decided that the system should be expanded to include an additional PM (a 15th blade in our setup). To populate this machine, the manager migrated 2 VMs to it (one from each PM hosting application server VMs). Besides the 3 minutes spent with experiments, VM cloning, simulated annealing, and VM migration took about 1 minute altogether. As a result, the manager was able to complete the resource reallocation 7 minutes into the experiment. The experiment ended with all services satisfying their SLAs.
Comparison against highly accurate modeling. Figure
11 shows what the system behavior would be if
the resource manager made its decisions based on a highly accurate
response-time model of our 3-tier auction service. To mimic such a
model, we performed the JustRunIt experiments with service 0 under the
same offered load of Figure 10 for all CPU allocations
off-line. These off-line results were fed to the manager during the
experiment free of any overheads. We assumed that the model-based
manager would require 1 minute of resource-usage monitoring after the
SLA violation is detected, before the model could be solved. Based on
the JustRunIt results, the manager made the same decisions as in
Figure 10.
The figure shows that modeling would allow the system to adjust 2 minutes faster. However, developing, calibrating, and validating such an accurate model is a challenging and labor-intensive proposition. Furthermore, adaptations would happen relatively infrequently in practice, given that (1) it typically takes at least tens of minutes for load intensities to increase significantly in real systems, and (2) the manager builds slack into the resource allocation during each adaptation. In summary, the small delay in decision making and the limited resources that JustRunIt requires are a small price to pay for the benefits that it affords.
We also experimented with our automated system for evaluating hardware upgrades in a virtualized hosting center. To demonstrate the behavior of our system, we ran two instances of our auction service on the same number of blades as in our resource manager study above. However, we now configure the blades that run the services to run at 2 GHz. The blade in the JustRunIt sandbox is set to run at 3 GHz to mimic a more powerful machine that we are considering for an upgrade of the data center. We offer 1000 requests/second to each service. We also cap each application server VM of both services at 90% of one core; for simplicity, we do not experiment with the Web tier, but the same approach could be trivially taken for it as well.
During the experiment, the management system requested JustRunIt to run 4 CPU-allocation experiments for no longer than 800 seconds overall. (Note, though, that this type of management task does not have real-time requirements, so we can afford to run JustRunIt experiments for a much longer time.) Since each server is initially allocated 90% of one core, JustRunIt is told to experiment with CPU allocations of 50%, 60%, 70%, and 80% of one core; there is no need for interpolation. The management system's main goal is to determine (using simulated annealing) how many of the new machines would be needed to achieve the same response time that the services currently exhibit. With this information, the energy implications of the upgrade can be assessed.
Based on the results generated by JustRunIt, the management system decided that the VMs of both services could each run at 72% CPU allocations (60% of one core plus 12% slack) at 3 GHz. For a large data center with diverse services, a similar reduction in resource requirements may allow for servers to be consolidated, which would most likely conserve energy. Unfortunately, our experimental system is too small to demonstrate these effects here.
In summary, the results above demonstrate that the JustRunIt overhead is small, even when all requests are exposed to our instrumentation. In real deployments, the observed overhead will be even smaller, since there will certainly be more than one path through each service (at the very least to guarantee availability and fault-tolerance). Furthermore, the results show that the sandboxed execution is faithful to the on-line execution. Finally, the results demonstrate that JustRunIt can be effectively leveraged to implement sophisticated automated management systems. Modeling could have been applied to the two systems, whereas feedback control is applicable to resource management (in the case of the CPU allocation), but not upgrade evaluation. The hardware resources consumed by JustRunIt amount to one machine for the two proxies of each tier, plus as few as one sandbox machine. Most importantly, this overhead is fixed and independent of the size of the production system.
Modeling, feedback control, and machine learning for managing data centers. State-of-the-art management systems rely on analytical modeling, feedback control, and/or machine learning to at least partially automate certain management tasks. As we have mentioned before, modeling has complexity and accuracy limitations, whereas feedback control is not applicable to many types of tasks. Although machine learning is useful for certain management tasks, such as fault diagnosis, it also has applicability limitations. The problem is that machine learning can only learn about system scenarios and configurations that have been seen in the past and about which enough data has been collected. For example, it applies to neither of the tasks we study in this paper. Nevertheless, machine learning can be used to improve the interpolation done by JustRunIt, when enough data exists for it to derive accurate models.
JustRunIt takes a fundamentally different approach to management; one in which accurate sandboxed experiments replace modeling, feedback control, and machine learning.
Scaling down data centers. Gupta et al.
[10] proposed the DieCast approach for scaling down a
service. DieCast enables some management tasks, such as predicting
service performance as a function of workload, to be performed on the
scaled version. Scaling is accomplished by creating one VM for each
PM of the service and running the VMs on an off-line cluster that is
an order of magnitude smaller than the on-line cluster. Because of
the significant scaling in size, DieCast also uses time dilation
[11] to make guest OSes think that they are running on much
faster machines. For a 10-fold scale down, time dilation extends
execution time by 10-fold.
DieCast and JustRunIt have fundamentally different goals and resource requirements. First, JustRunIt targets a subset of the management tasks that DieCast does; the subset that can be accomplished with limited additional hardware resources, software infrastructure, and costs. In particular, JustRunIt seeks to improve upon modeling by leveraging native execution. Because of time dilation, DieCast takes excessively long to perform each experiment. Second, JustRunIt includes infrastructure for automatically experimenting with services, as well as interpolating and checking the experimental results. Third, JustRunIt minimizes the set of hardware resources that are required by each experiment without affecting its running time. In contrast, to affect execution time by a small factor, DieCast requires an additional hardware infrastructure that is only this same small factor smaller than the entire on-line service.
Sandboxing and duplication for managing data centers.
A few efforts have proposed related
infrastructures for managing data centers. Specifically,
[15,17] considered validating operator actions in
an Internet service by using request duplication to a sandboxed
extension of the service. For each request, if the replies generated
by the on-line environment and by the sandbox ever differ during a
validation period, a potential operator mistake is flagged. Tan et al. [25] considered a similar infrastructure for verifying
file servers.
Instead of operator-action validation in a single, non-virtualized Internet service, our goal is to experimentally evaluate the effect of different resource allocations, parameter settings, and other potential system changes (such as hardware upgrades) in virtualized data centers. Thus, JustRunIt is much more broadly applicable than previous works. As a result, our infrastructure is quite different than previous systems. Most significantly, JustRunIt is the first system that may explore a large number of scenarios that differ from the on-line system, while extrapolating results from the experiments that are actually run, and verifying its extrapolations if necessary.
Selecting experiments to run. Previous works have
proposed sophisticated approaches for selecting the experiments to run
when benchmarking servers [22] or optimizing their
configuration parameters [26,31]. Such approaches
are largely complementary to our work. Specifically, they can be used
to improve experiment-based management in two ways: (1) automated
management systems can use them to define/constrain the parameter
space that JustRunIt should explore; or (2) they can be used as new
heuristics in JustRunIt's driver to eliminate unnecessary experiments.
This paper introduced a novel infrastructure for experiment-based management of virtualized data centers, called JustRunIt. The infrastructure enables an automated management system or the system administrator to answer ``what-if'' questions experimentally during management tasks and, based on the answers, select the best course of action. The current version of JustRunIt can be applied to many management tasks, including resource management, hardware upgrades, and software upgrades.
Limitations.
There are three types of ``what-if'' questions that sophisticated
models can answer (by making simplifying assumptions and costing
extensive human labor), whereas JustRunIt currently cannot. First,
service-wide models can answer questions about the effect of a service
tier on other tiers. In the current version of JustRunIt, these
cross-tier interactions are not visible, since the sandboxed virtual
machines do not communicate with each other.
Second, models that represent request mixes at a low enough level can answer questions about hypothetical mixes that have not been experienced in practice. Currently, JustRunIt relies solely on real workload duplication for its experiments, so it can only answer questions about request mixes that are offered to the system. Nevertheless, JustRunIt can currently answer questions about more or less intense versions of real workloads, which seems to be a more useful property.
Finally, models can sometimes be used to spot performance anomalies, although differences between model results and on-line behavior are often due to inaccuracies of the model. Because JustRunIt uses complete-state replicas of on-line virtual machines for greater realism in its experiments, anomalies due to software server or operating system bugs cannot be detected.
Future work. We plan to extend JustRunIt to allow
cross-tier communication between the sandboxed servers. This will
allow the administrator to configure sandboxing with or without
cross-tier interactions. We also plan to create infrastructure to
allow experimentation with request mixes other than those observed
on-line. The idea here is to collect a trace of the on-line workload
offered to one server of each tier, as well as the state of these
servers. Later, JustRunIt could install the states and replay the
trace to the sandboxed servers. During replay, the request mix could
be changed by eliminating or replicating some of the traced sessions.
Finally, we plan to build an in-proxy for a database server, starting
with code from the C-JBDC middleware.
We would like to thank our shepherd, John Dunagan, and the anonymous reviewers for comments that helped improve this paper significantly. This research was partially supported by Hewlett-Packard and by NSF grant #CSR-0509007.
This document was generated using the LaTeX2HTML translator Version 2002-2-1 (1.71)
Copyright © 1993, 1994, 1995, 1996,
Nikos Drakos,
Computer Based Learning Unit, University of Leeds.
Copyright © 1997, 1998, 1999,
Ross Moore,
Mathematics Department, Macquarie University, Sydney.
The command line arguments were:
latex2html -split 0 -show_section_numbers -local_icons -no_navigation paper.tex
The translation was initiated by Wei Zheng on 2009-04-16