|
USENIX 2006 Annual Technical Conference Refereed Paper
[USENIX 2006 Annual Technical Conference Technical Program]
Replay Debugging for Distributed Applications
Dennis Geels Gautam Altekar Scott Shenker Ion Stoica University of California, Berkeley
{geels, galtekar, shenker, istoica}@cs.berkeley.edu
Abstract:
We have developed a new replay debugging tool, liblog, for
distributed C/C++ applications. It logs the execution of deployed
application processes and replays them deterministically, faithfully
reproducing race conditions and non-deterministic failures, enabling
careful offline analysis.
To our knowledge, liblog is the first replay tool
to address the requirements of large distributed systems: lightweight
support for long-running programs, consistent replay of arbitrary
subsets of application nodes, and operation in a mixed environment of
logging and non-logging processes. In addition, it requires no
special hardware or kernel patches, supports unmodified application
executables, and integrates GDB into the replay mechanism for
simultaneous source-level debugging of multiple processes.
This paper presents liblog's design, an evaluation of its runtime
overhead, and a discussion of our experience with the tool to date.
1 Introduction
Over the past few years, research has produced new algorithms for
routing overlays, query processing engines, byzantine fault-tolerant
replication, and distributed hash tables. Popular software like
peer-to-peer file sharing applications suggests that interest in
distributed applications is not restricted to academic circles.
But debugging is hard. Debugging distributed applications is harder
still, and debugging distributed applications deployed across the
Internet is downright daunting. We believe that the development
of new services has been held back by this difficulty and that
more powerful debugging tools are needed.
A distributed application is a collection of processes running on
machines spread across a network (for our purposes, the Internet).
The individual processes may be analyzed independently, and debugging
existing tools can catch common ``local'' errors such as unsafe memory
accesses and thread synchronization errors. Unfortunately, these tools
do not address the new problems that arise when the processes are
composed across an unpredictable and lossy network. Races between
network messages produce non-deterministic behaviour. Message delay
and failure ensure that the aggregate application state is only rarely
globally consistent.
Simulation and small-scale test deployments help developers evaluate
aggregate system behaviour in a relatively easy environment. With a
simulator, the developer has full power to repeat the same
execution across multiple experiments, and the state of each
application process is available locally for examination. Test
deployments complement simulation by adding more realistic network and
host machine behaviour. Using local clusters and small, or even
emulated, networks, developers may carefully control the degree of
realism exposed to their applications.
However, once deployed, distributed applications will reach
states that were not tested, and the underlying network will fail in
ways that the developer did not anticipate. Long-running services are
particularly prone to the slow-developing and non-deterministic,
low-probability faults that resist detection during the testing phase.
And once the application is deployed, race conditions and internal
state are difficult to observe. Developers rely on application-level
logging and printf statements, but these techniques only help
if the developer chooses to expose the affected internal state before
the fault manifests. These types of bugs are generally impossible
to reproduce locally, where analysis would be simpler. This
limited visibility is the core problem for debugging
distributed applications. We have developed a new debugging tool,
liblog, to address it.
1.1 Requirements
We designed this tool to help fix non-deterministic
failures in deployed, distributed applications. This goal imposed
several requirements on our design.
Deterministic Replay:
First and foremost, deployed applications need logging and
replay. Normal debuggers monitor an application's execution
synchronously, so that the process can be paused immediately when a
failure, signal, or breakpoint occurs. This approach is infeasible
for real, deployed systems for three reasons. First, the latency of a
synchronous connection to a remote debugger would significantly slow
down the application. Second, pausing the process (or processes, if
the developer wished to look at global state) at breakpoints would be
unacceptable for real, deployed services, which interact continuously
with peer services and clients. Third, real networks are not stable
enough to maintain a persistent connection to each process.
Thus debugging must be asynchronous. Each process records its execution
to a local log, with sufficient detail such that the same execution
can be replayed later. We should follow the same code paths during
replay, see the file and network I/O, and even reproduce signals and
other IPC. The replay could run in parallel with the
original execution, after the original process dies, or even on a
completely different machine.
Continuous Logging:
In order to record the manifestation of slow-developing and
non-deterministic, low-probability faults, the logging infrastructure
must remain active at all times. We must operate under the assumption
that more bugs are always waiting. Also, any slight perturbations in
application behaviour imposed by the debugger becomes the ``normal''
behaviour. Removing it then would be a perturbation that might
activate so-called ``heisenbugs''.
If the debugging system required significant resources, the cost in
performance (or faster hardware) might be prohibitive. Fortunately,
many types of distributed applications consume relatively few local
resources themselves. Whereas network bandwidth and latency might be
precious, we often have extra CPU cycles and disk space to accommodate
our logging tools. In particular, if we confine ourselves to a small
processing budget, the network will remain the performance bottleneck,
and the application will exhibit little slowdown.
Consistent Group Replay:
We are particularly interested in finding distributed bugs,
such as race conditions and incorrect state propagation. This kind of
error may be difficult or impossible to detect from the state of any
one process. For example, transient routing loops are only visible
when the aggregate state of multiple routers is considered.
So we must be able to see snapshots of the state across multiple
processes and to trace message propagation from machine to machine.
Naturally, true snapshots are impossible without synchronized clocks
(cf. [Lam78]), but we can require that each machine is
replayed to a consistent point, where no message is received
before it has been sent.
Mixed environment:
Most applications will not run our software, particularly client
software and supporting services like DNS. This fact becomes a
problem if we require coordination from communication peers during
logging or replay, as we generally must in order to satisfy the
previous requirement (consistent replay). Since we do not operate in
a closed system, our tools must understand the difference between
cooperating and non-cooperating peers and treat each appropriately.
1.2 Contributions
The primary contribution of our work is the design and evaluation of a
debugging tool, liblog, that satisfies each of these requirements.
Previous projects have developed logging and replay tools that focus
on either low overhead or providing consistent replay, but we have
addressed both. Furthermore, to the best of our knowledge, liblog
is the first tool that (1) provides consistent replay in a mixed
environment, or (2) allows consistent replay for arbitrary subsets of
application processes.
In addition, liblog requires neither special hardware support nor
patches to privileged system software. Also, it operates on unmodified
C/C++ application binaries at runtime, without source code annotations
or special compilation tools. Multithreading, shared memory, signals,
and file and network I/O all work transparently.
Finally, we designed liblog to be simple to use. Logging only
requires running our start-up script on each machine. Our replay
tools make debugging as easy as using GDB for local applications: they
automate log collection, export the traditional GDB interface to the
programmer, and even extend that interface to support consistent
replay of multiple processes and tracking messages across machines.
We built liblog by combining existing technology in new ways and
extending the state of the art as necessary. In the following
sections, we will present an overview of the resulting design
(Section 2) and then explain in more detail the new
technical challenges that arose, along with our solutions
(Section 3).
1.3 Is liblog Right For You?
We designed liblog with lightweight distributed applications like
routing overlays in mind. We assume that the host machines have
spare resources--specifically CPU, memory, network, and disk--that we
can apply to our debugging efforts.
Although it can correctly log and replay general C/C++ applications,
the runtime overhead imposed could outweigh the benefits for
resource-intensive systems like streaming video servers or heavily
multithreaded databases. We quantify this overhead in
Section 4.
2 Design
In this section we present an overview of liblog's design,
highlighting the decisions that we made in order to satisfy the
requirements listed above.
2.1 Shared Library Implementation
The core of our debugging tool is a shared library (the eponym
liblog), which intercepts calls to libc (e.g., select,
gettimeofday) and logs their results. Our start-up scripts
use the LD_PRELOAD linker variable to interpose liblog
between libc and the application and its other libraries (see
Figure 1). liblog runs on Linux/x86 computers and
supports POSIX C/C++ applications.
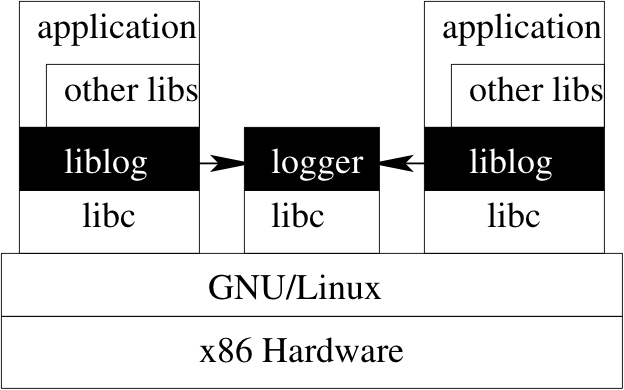
Figure 1: Logging: liblog intercepts calls to libc
and sends results to logger process. The latter asynchronously
compresses and writes the logs to local storage.
We chose to build a library-based tool because operating in the
application's address space is efficient. Neither extra context switches
nor virtualization layers are required. Alternative methods like
special logging
hardware [NM92, XBH03, NPC05] or
kernel modifications [TH00, SKAZ04] can be
even faster, but we found these solutions too restrictive for a tool
that we hope to be widely adopted and deployed.
Another promising alternative is to run applications on a virtual
machine and then to log the entire
VM [KDC05, SH, HH05]. We rejected it
because we believe that VM technology is still too difficult to deploy
and too slow for most deployed services.
On the other hand, there are serious drawbacks of a library
implementation. First, several aspects of observing and controlling
applications are more difficult from within the address space,
most notably supporting multiple threads and shared memory. We will
discuss these challenges in Section 3.
Fundamentally, however, operating in the application's address space
is neither complete (we cannot replay all non-determinism) nor sound
(internal state may become corrupted, causing mistakes). We will
discuss such limitations in Section 4.
Nevertheless we believe that the combined efficiency and ease of use
of a library-based logging tool makes this solution the most
useful.
2.2 Message Tagging and Capture
The second defining aspect of our logging tool is our approach to
replaying network communication. We log the contents of all
incoming messages so that
the receiving process can be replayed independently of the sender.
This flexibility comes at the cost of significant log space
(cf. Section 5) but is well justified.
Previous projects have tried the alternative, replaying all
processes and regenerating message contents on the sender. We cannot
do so because we operate in a mixed environment with non-logging
processes. Even cooperating application logs may be unavailable for
replay due to intervening disk or network failure.
So far we satisfy one requirement, but we must be able to
coordinate these individual replays in order to provide another,
Consistent Group Replay. For this purpose, we embed 8-byte Lamport
clocks [Lam78] in all outgoing messages during
execution and then use these virtual clocks to schedule replay. The
clock update algorithm ensures that the timestamps in each log entry
respect the ``happens-before'' relationship. They also provide a
convenient way to correlate message transmission and reception events,
so we can trace communication from machine to machine.
To make the virtual clocks more intuitive, we advance them at
the rate of the local machine clock. If the machine clocks happen to
be synchronized to within one network RTT, the virtual clocks will
match exactly.
2.3 Central Replay
Our third major design decision was to enable off-site replay. Rather
than restart each process in situ, a central console
automatically downloads the necessary logs and checkpoints and
instantiates each replay process locally. Local replay removes the
network delay from the control loop, making it feasible to operate on
distributed state and to step across processes to follow messages.
The costs are several: first, the network bandwidth consumed by
transferring logs may exceed that required to control a remote
debugger. Second, the hardware and system software on the replay
machine must match the original host; currently we support only
GNU/Linux/x86 hosts. Third, we
must log data read from the local file system (as with network
messages) because the files may not be available on the replay
machine. This technique also obviates maintaining a versioned
file system or undoing file modifications. Finally,
building a migratable checkpoint system is challenging. We consider
the first two costs to be acceptable and will discuss our solution to
the last
challenge in Section 3.6.
3 Challenges
In this section we will discuss the technical challenges we faced when
building our logging and replay system. Most are new problems caused
by our user-level implementation and/or message annotations; previous
projects did not address them because their focus allowed for
different design choices.
3.1 Signals and Thread Replay in Userland
As we noted earlier, logging and replaying applications at the libc
level assumes that they only interact with their environment through
that interface and that, outside of libc calls, the application
execution is deterministic. This assumption fails when multiple
threads execute concurrently on the same address space. The value
read from a shared variable depends on the order in which competing
threads modify it; every write could be a race condition. The same
problem arises when multiple processes share memory segments or when
signal handlers (effectively another thread) access global variables.
To make replay deterministic in these cases, we must either intercept
and replay the value of each read from shared memory, or we
must replay each read and write in the same order, so races
resolve identically. The former option is too invasive and requires
log bandwidth proportional to the memory access stream. The latter is
still expensive, but the cost can be reduced significantly by logging only the
order and timing of thread context switches. If we assume a single
processor, or artificially serialize thread operation, then identical
thread schedules produce identical memory access patterns.
The challenge in our case was to record and replay thread schedules
using only our user-level shared library. The task is relatively
simple for kernel- or VM-based tools, but user-level libraries
generally have no ability even to observe context
switches among kernel threads, much
less control them. We believe that liblog is the first to address
the problem.
Our solution effectively imposes a user-level cooperative scheduler on
top of the OS scheduler. We use a pthread mutex to block all but one
thread at a time, ignoring conflicting context switches by the
kernel. The active thread only surrenders the lock at libc call
points, as part of our logging wrapper, and the next active thread
logs the context switch before continuing. Processes that share
memory are handled identically. Similarly, signals are queued and
delivered at the next libc call.
Restricting context switches to our wrapper functions provides a
convenient point to repeat the switches during replay, but the change
to thread semantics is not fully transparent. In particular, we
cannot support applications that intentionally use tight infinite
loops, perhaps as part of a home-grown spin lock, because other
threads will not have any opportunity to acquire our scheduling lock.
Delaying signals may affect applications more, although we note that
the kernel already tries to perform context switches and to deliver
signals at syscall boundaries, so the impact of our solution may not
be pronounced. We have not yet quantified the degree to which the
schedule we impose differs from a normal one.
3.2 Unsafe Memory Access
Another potential source of non-determinism arises when an application
reads from uninitialized (but allocated) heap memory or beyond the end
of the stack. The contents of these memory regions are not well
defined for C applications, and in practice they change between
execution and replay. One could argue that accessing these regions
could be considered incorrect behaviour, but it is legal, reasonably
safe, and present even in robust software like
OpenSSL [SSL].
Much of the change in memory between logging and replay is due to the
logging tool itself, which calls different functions during replay,
leaving different stack frames and allocating different memory on the
heap. One can significantly minimize the tool's memory footprint, as
stressed in Jockey [Sai05], but it can never be
completely eliminated by a library-based debugging tool. Internal
memory use by libc will always differ because its calls are elided
during replay, so malloc may return different memory to the
application.
Our solution is simpler: we merely zero-fill all memory returned by
malloc (effectively replacing it with calloc) as
well as stack frames used by our libc wrappers. Thus, uninitialized
reads replay deterministically, even if malloc returns a
different region. This solution still fails if the application
depends on the actual address, for example, as a key for a hash table.
Also, it is very difficult to protect a library-based tool from
corruption by stray memory writes into the tool's heap. A virtual
machine-based alternative would avoid this problem. Also, one could
imagine disabling write access to the liblog's memory each time
control returns to the application. Instead, we rely on dedicated
memory-profiling tools like
Purify [Pur] and
Valgind [nVa] to catch these various memory
errors, so that we can focus on efficient logging.
3.3 Consistent Replay for TCP
As described in Section 2.2, we annotate all network
messages between application processes with Lamport clocks so that we
can replay communicating peers consistently. For datagram protocols
like UDP, we use simple encapsulation: we prepend a few bytes to each
packet, and remove them on reception. We pass a
scatter/gather array to sendmsg to avoid extra copies.
Annotating byte streams like TCP is more complicated, because
timestamps must be added throughout the stream, at the boundary of
each sent data chunk. But the receiver need not consume bytes in the
same batches; it often will read all available data, be it more or
less than the contents of a single send payload.
Our solution is a small (3-state) state machine for each incoming TCP
connections (see Figure 2). Once the stream has been
verified as containing annotations, the state machine alternates
reading annotations and reading application data until the calling
function has enough data or the socket is drained. Each state
transition requires a separate call to read the underlying stream; we
cannot simply read extra bytes and extract the annotations, because we
cannot anticipate how far to read. We do not know the frequency of
future annotations, and attempting to read more data than necessary
may cause the application to block needlessly. It is always
possible that more bytes will not arrive.
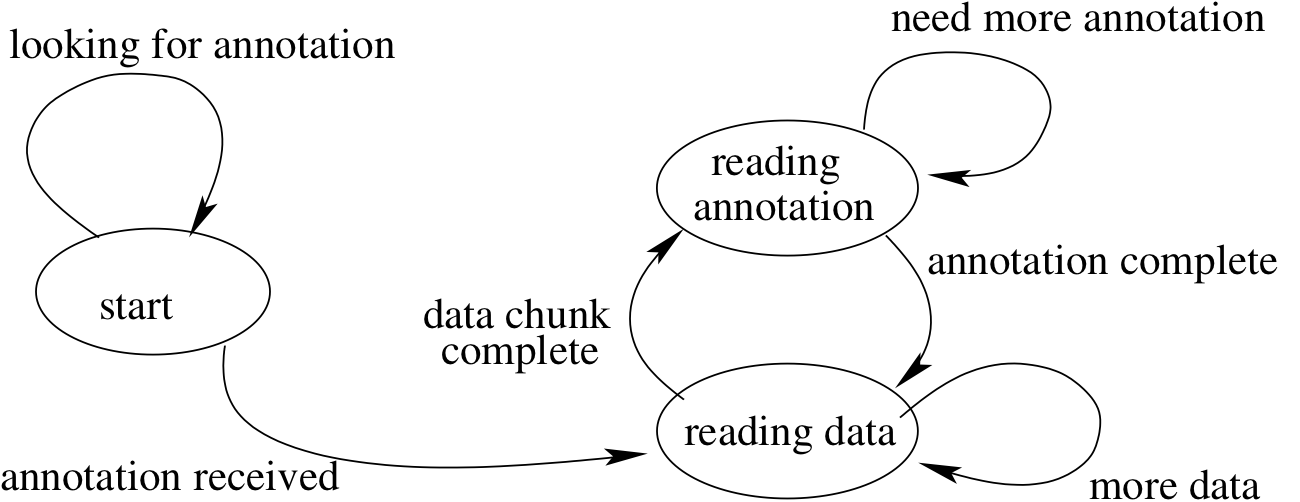
Figure 2: Receiving Annotated TCP: Detecting and
extracting Lamport clocks from incoming byte streams requires
additional bookkeeping.
If multiple annotations are consumed by a single read call,
we log the most recent timestamp, as it supersedes the others.
Naturally, we remember the stream state between calls so that we may
continue even if the last read attempt ended in the middle of an
annotation.
3.4 Finding Peers in a Mixed Environment
Embedding annotations in messages also complicates interaction with
non-logging processes such as third-party clients, DNS and database
servers, or, if liblog is only partially deployed, even fellow
application processes. These non-loggers do not expect the annotations
and would reject or (worse yet) misinterpret the message. We believe
that this problem is the reason that no previous logging tool has
supported consistent replay in a mixed environment.
We must either send annotations that will be safely ignored by
non-logging processes or discover whether a remote peer expects
annotations and omit them when appropriate. The former option could
be implemented using either IP options1 or the
out-of-band (OOB) channel for TCP connections, but either method
would conflict with networks that already used these paths. Also, we
have seen evidence that adding IP options has a negative impact on
application traffic, and OOB does not help UDP traffic (nor
incompatible TCP implementations).
We opted for a safer, but slower, solution. The logger on each
machine tracks the local ports opened by logging processes and listens
on a globally well-known port (currently 5485). This approach fails
to fully support applications hidden behind NAT-enabled firewalls, but
it could easily replaced by a more sophisticated discovery mechanism.
Each liblog-enabled process then
queries the remote logger (via TCP) before sending the first
datagram or opening a TCP connection. The query contains the
destination port and protocol of interest and asks whether that port
is currently assigned to a logging process.
If the application receives a negative reply, or none at all, that
packet flow will not be annotated. Replies are cached for the
duration of a stream, or 30 seconds for datagram sockets, to amortize
the query latency overhead. Currently, we wait a maximum of 2 seconds
for a query, but that maximum is only reached if the remote machine
has no logger and does not reset our TCP request. But this case
does happen frequently for firewall-protected machines, so we cache
information on dropped queries for up to 5 minutes.
3.5 Replaying Multiple Processes
The real power of replay debugging depends on the ability to set
breakpoints, to pause execution, and to observe internal application state,
just as one can in normal debuggers. Rather than develop new
technology with its own interface, we decided to adapt the GNU
debugger [GDB]. GDB
provides a powerful and familiar interface for controlling application
execution and accessing internal state by symbolic names.
Unfortunately, GDB, like many debuggers, can only control a single
process. Replaying multiple processes, or even children created with
fork, requires multiple instances of the debugger. Our
challenge was to coordinate them, multiplexing their input and output
to the programmer and scheduling the application execution so that
replay is consistent.
We use a two-tiered approach to controlling the replay processes.
Threads within a process group are multiplexed by the same scheduling
locks used during logging (cf. Section 3.1), always
choosing the next thread based on the schedule stored in the log.
These locks also block a newly fork-ed process until we
attach a new GDB instance to it.
Across process groups, consistent replay is enforced by our replay
console, a small Python [Py] application.
For each application process, the console uses GDB to set breakpoints
in key libreplay functions. These pause execution at each libc
call, allowing us to schedule the next process or to download the next
set of logs.
The replay console provides a single interface to the programmer,
passing commands through to GDB and adding syntax for broadcasting
commands to multiple processes. It also allows advanced
programmability by interacting directly with the underlying Python
interpreter.
3.6 Migratable Checkpoints
Replaying application processes centrally, offline, makes the debugger
more responsive and makes it feasible to operate on distributed
application state. But restarting processes on a new machine is
tricky. The two main challenges are first, to copy the state of the
original application into a live process on the new machine, and
second, to reconcile this new process with the debugger (GDB).
Our checkpoint mechanism is based on the
ckpt [Ckp] library
from the University of Wisconsin. This library reads the
/proc/ filesystem to build a list of allocated memory regions
for the application and then writes all such memory to a checkpoint
file. For replay, a small bootstrap application reads that file and
overwrites its own memory contents, adjusting memory allocations as
necessary.
First we extended ckpt to handle the kernel-level thread
state for multi-threaded applications, which was simplified by our
user-level scheduler. A thread saves its state before relinquishing
the CPU, so at any time we have the state of all inactive threads
stored in our tables.
Next we added support
for shared memory regions: each process in a group checkpoints its
private memory, and one ``master'' process writes and restores the
shared memory for everyone.
Integrating checkpoint support to GDB required additional work.
Starting the process within GDB is problematic because the
symbol tables of the bootstrap program and the restored application do
not generally agree, or even necessarily overlap, and GDB does not
support symbol tables moving during runtime. Even if we use the
original application to bootstrap the process, GDB becomes confused
when shared libraries are restored at new locations.
To solve this problem, we added a new method
for finding the in-memory symbol table of a running application (by
reading the r_debug.r_brk field), ignoring the conflicting
information from the local executable file. It is then sufficient to
attach to the restored application and to invoke this new symbol
discovery method.
Our modifications required adding approximately 50 lines of code,
including comments, to one source file in GDB. Most of those
lines comprise the new function for locating the symbol table.
4 Limitations
There are several limitations to our debugging tool, both fundamental
and mundane.
Log storage
The biggest reason for a developer to not use liblog with
an application is the large amount of log data that must be written
to local disk. Log storage is a fundamental problem for any
deterministic replay system, but our approach to handling I/O
(cf. Section 2) renders liblog infeasible for
high-throughput applications. Every Megabyte read from the network or
disk must be logged (compressed) to the local disk, consuming space
and disk bandwidth. This approach is acceptable for relatively
lightweight applications like routing overlays, consuming only a few
megabytes per hour, but is probably
unrealistic for streaming video or database applications. We will
quantify the problem in Section 5.
Host requirements
Our basic logging strategy only addresses POSIX applications and
operating systems that support run-time library interposition. In
practice, our OS options are restricted even further, to recent
Linux/x86 kernels (2.6.10+) and GNU system software (only libc 2.3.5
has been tested). These limitations are imposed by our borrowed
checkpointing code and compatibility issues with our modified version
of GDB.
Scheduling semantics
As explained in Section 3.1, liblog's user-level
scheduler only permits signal delivery and context switches at libc
function calls. The OS generally tries to do the same, so most
applications will not notice a significant difference.
However, we are assuming that applications make these calls fairly
regularly. If one thread enters a long computation period, or a
home-grown spin lock implemented with an infinite loop, liblog will
never force that thread to surrender the lock, and signals will never
be delivered. We are exploring solutions to this problem.
Network overhead
Our network annotations consume approximately 16 bytes per message,
which may be significant for some applications. The first 4 bytes
constitute a ``magic number'' that helps us detect incoming
annotations, but this technique is not perfect. Thus another
limitation is that streams or datagrams that randomly begin with the
same sequence of 4 bytes may be incorrectly classified by liblog
and have several bytes removed. This probability is low (1 in 232
for random messages), and is further mitigated by additional validity
checks and information remembered from previous messages in a flow,
but false positives are still possible.
Limited consistency
Fundamentally, consistent replay in a mixed environment is not
guaranteed to be perfectly consistent. A message flow between two
application processes loses its timing information if the flow is
relayed by a non-logging third party. Then, if the virtual clocks
for the two processes are sufficiently skewed, it is possible to
replay message transmission after its reception. The
probability of this scenario decreases rapidly as the application's
internal traffic patterns increase in density, which keeps the
virtual clocks loosely synchronized.
Completeness
Finally, as mentioned earlier, library-based tools are neither
complete nor sound, in the logical sense of the words. They are
incomplete because they cannot reproduce every possible source of
non-determinism. liblog addresses non-determinism from system
calls, from thread interaction, and, to a lesser extent, from unsafe
memory accesses. Jockey [Sai05] focuses on a different
set of sources, reducing changes to the heap and adding binary
instrumentation for intercepting non-deterministic x86 instructions
like rdtsc and, potentially, int.
Unfortunately, logging libraries will never succeed in making the
replay environment exactly identical to the original environment
because they operate inside the application's address space. The
libraries run different code during logging and during replay, so
their stack and heap differ. Theoretically, an unlucky or determined
application could detect the difference and alter its behaviour.
Soundness
We say logging libraries are unsound because, as part of the
application, they may be corrupted. We hope that applications have
been checked for memory bugs that could cause stray writes to
liblog's internal memory, but C is inherently unsafe and mistakes
may happen. We do assume the application is imperfect, after all.
Furthermore, libraries are susceptible to mistakes or crashes by the
operating system, unlike hardware solutions or virtual machines
(although even virtual machines generally rely on the correctness of a
host OS).
Fortunately, these theoretical limitations have little practical
impact. Most applications are simple enough for liblog to capture
all sources of non-determinism, and simple precautions to segregate
internal state from the application's heap are usually sufficiently
safe. Indeed, most debuggers (including GDB) are neither sound nor
complete, but they are still considered useful.
5 Evaluation
We designed liblog to be sufficiently lightweight so that
developers would leave it permanently enabled on their
applications. In this section, we attempt to quantify the overhead
imposed by liblog, both to see whether we reached this goal and to
help potential users estimate the impact they might see on their
own applications.
We start by measuring the runtime latency added by our libc
wrappers and its effect on network performance. TCP throughput and
RTT are not noticeably affected. A second set of experiments measures
the storage overhead consumed by checkpoints and logs.
All experiments were performed on a
Dual 3.06GHz Pentium 4 Xeon (533Mhz FSB)
with 512K L2 cache, 2GB of RAM, 80GB 7500 rpm ATA/100 disk,
and Broadcom 1000TX gigabit Ethernet.
5.1 Wrapper Latency
To measure the processing overhead of liblog, we first analyzed the
latency added to each libc call.
Figure 3 shows the latency for a few
representative wrappers.
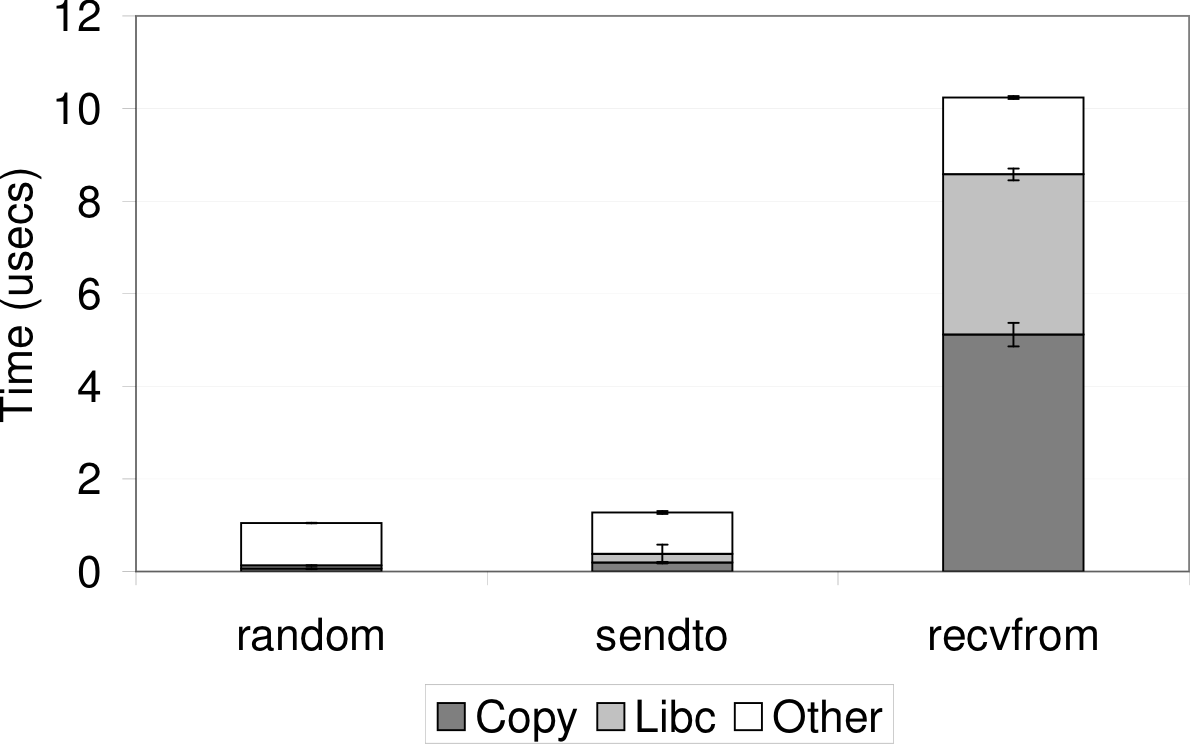
Figure 3: Wrapper Overhead: time required to intercept
and log libc functions. The copy region measures the time
taken to write the bytes to a shared memory region monitored by the
logger, and other includes the overhead of intercepting the
calls an our internal bookkeeping. The libc region measures
the time taken for the underlying library call to complete.
The wrappers add approximately 1 microsecond to the function
random, which shows the minimum amount of work each wrapper
must do to intercept the call and to write a log entry. The sendto
wrapper is slightly slower as it includes the amortized cost of querying the
destination to determine whether to send annotations
(cf. Section 3.4). The ``copy'' phase is also
longer, because we store the outgoing message address and port to
facilitate message tracing. The recvfrom overhead is higher
still because it must extract the Lamport clock annotation from the
payload and copy the message data to the logs.
5.2 Network Performance
Next we measured the impact of liblog on network performance.
First we wrote a small test application that sends UDP datagrams as
fast as possible. Figures 4 and 5
show the maximum packet rate and throughput for increasing datagram
sizes. With liblog enabled, each rate was reduced by approximately
18%.
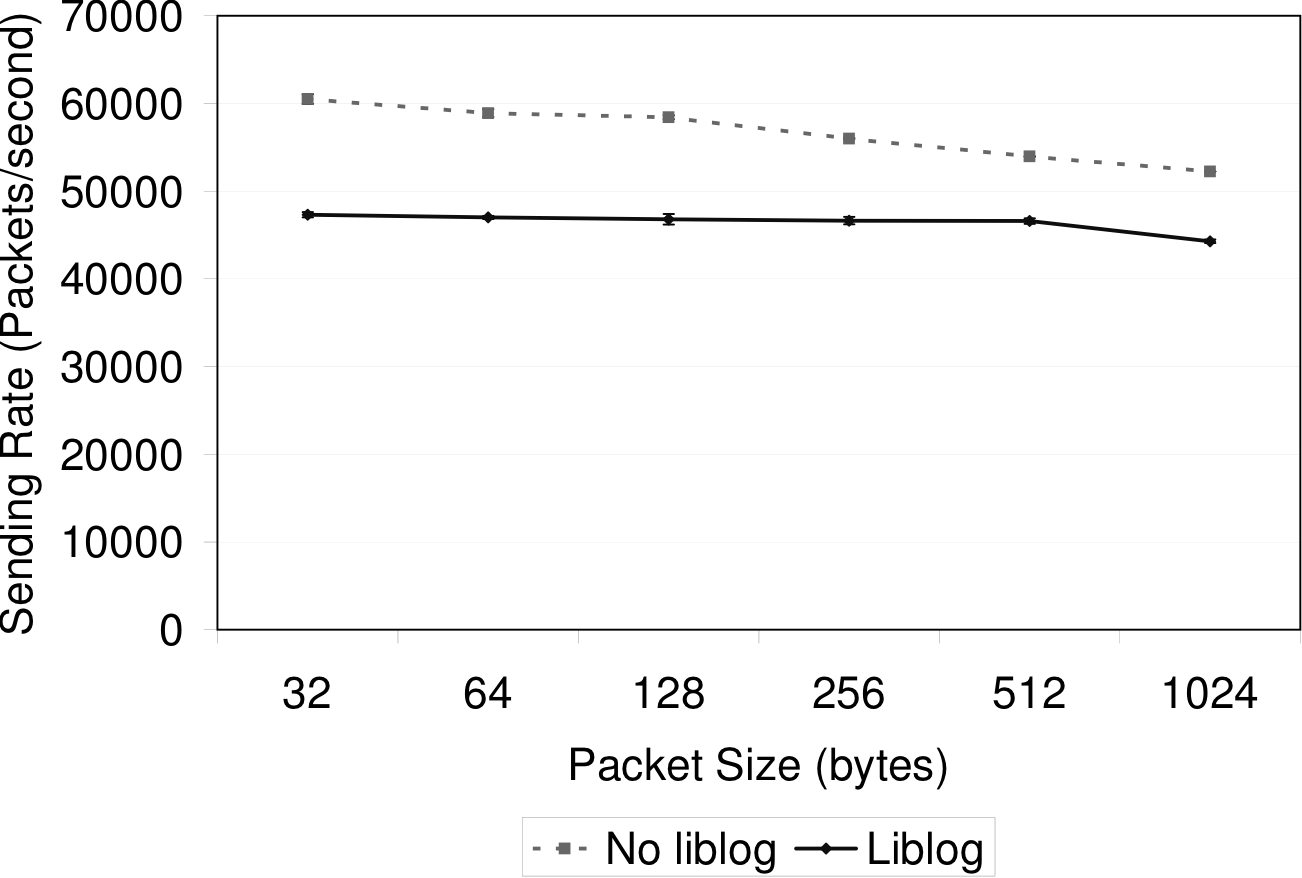
Figure 4: Packet rate reduction: Maximum UDP send rate for various datagram sizes. The maximum standard deviation over all points is
1.3 percent of the mean.
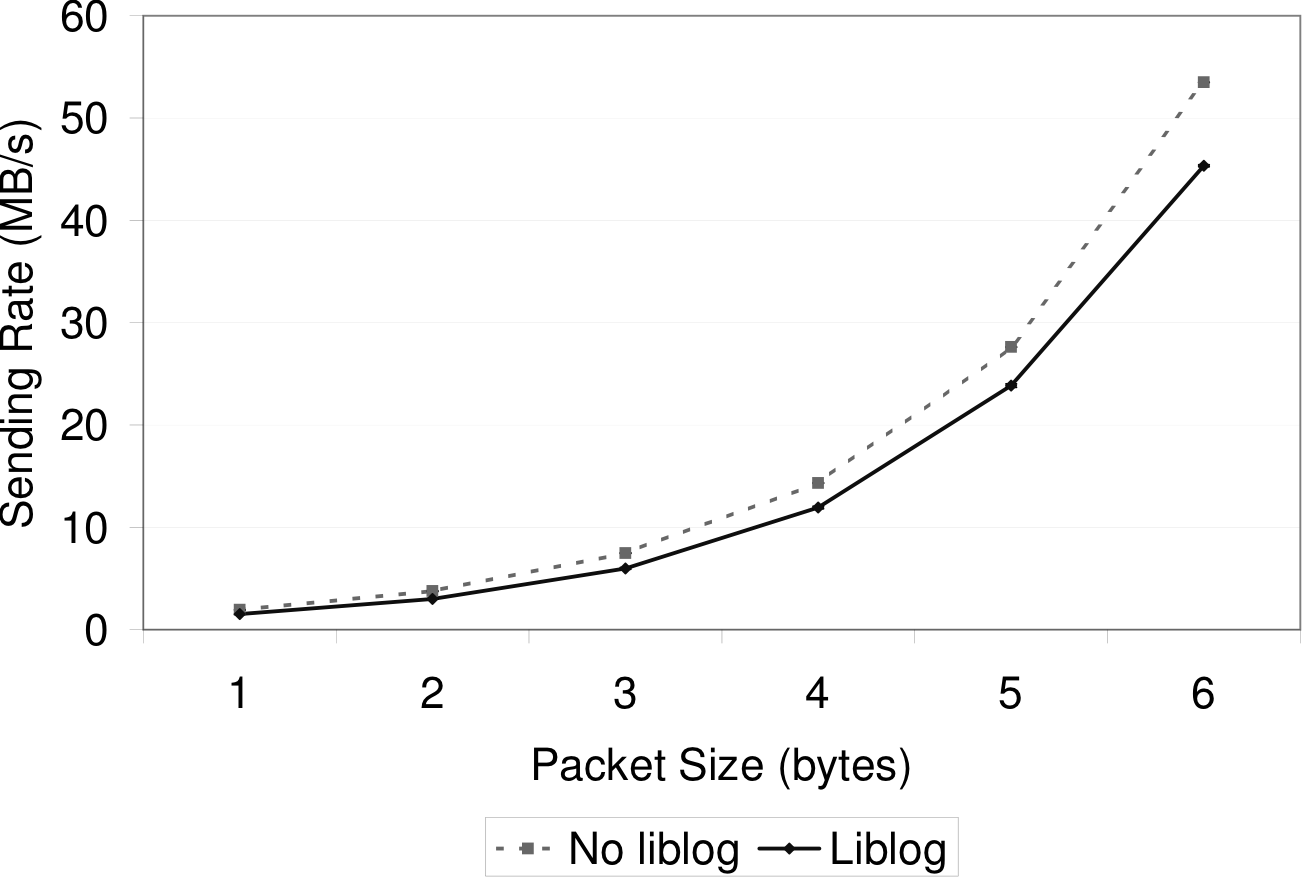
Figure 5: UDP bandwidth: Maximum UDP send throughput for
various datagram sizes. The maximum standard deviation over all
points is 1.3 percent of the mean.
For TCP throughput, we measured the time required for wget to
download a 484 MB binary executable from various web servers.
Figure 6 shows that liblog
hinders wget when downloading the file over a gigabit ethernet
link, but the reduction in throughput is negligible when the
maximum available throughput is lowered. Even the relatively fast
100 MBps link to our departmental web server can be filled using liblog.
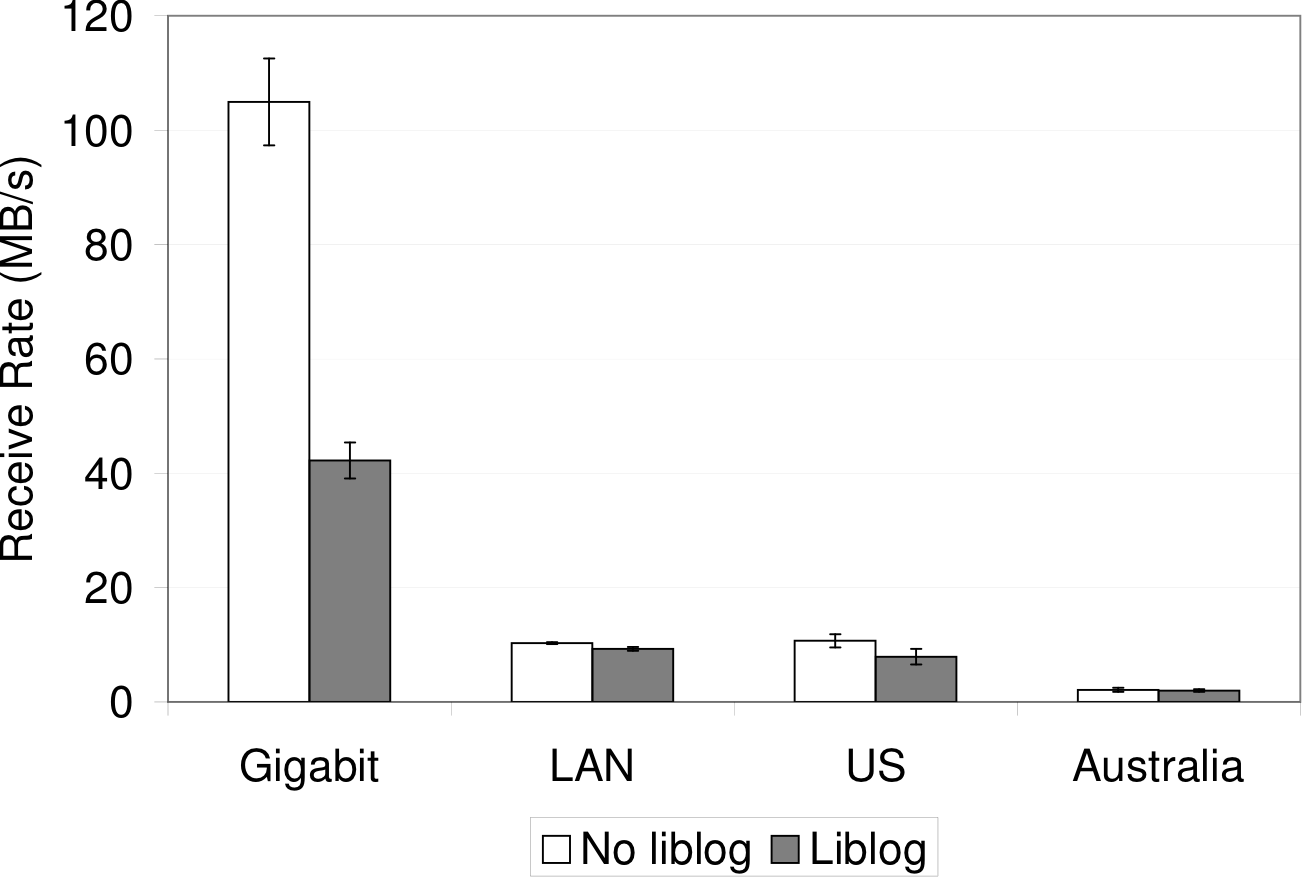
Figure 6: TCP throughput for wget downloading a
484MB file. Each pair of bars represents a different web server location.
Finally, Figure 7 shows the round-trip time (RTT) measured
by lmbench to the local host and to a machine on a nearby
network. The gigabit ethernet test shows that liblog adds a few wrappers
worth of latency to each RTT, as expected. On a LAN, the RTT overhead is
so small that the difference is hard to discern from the graph.
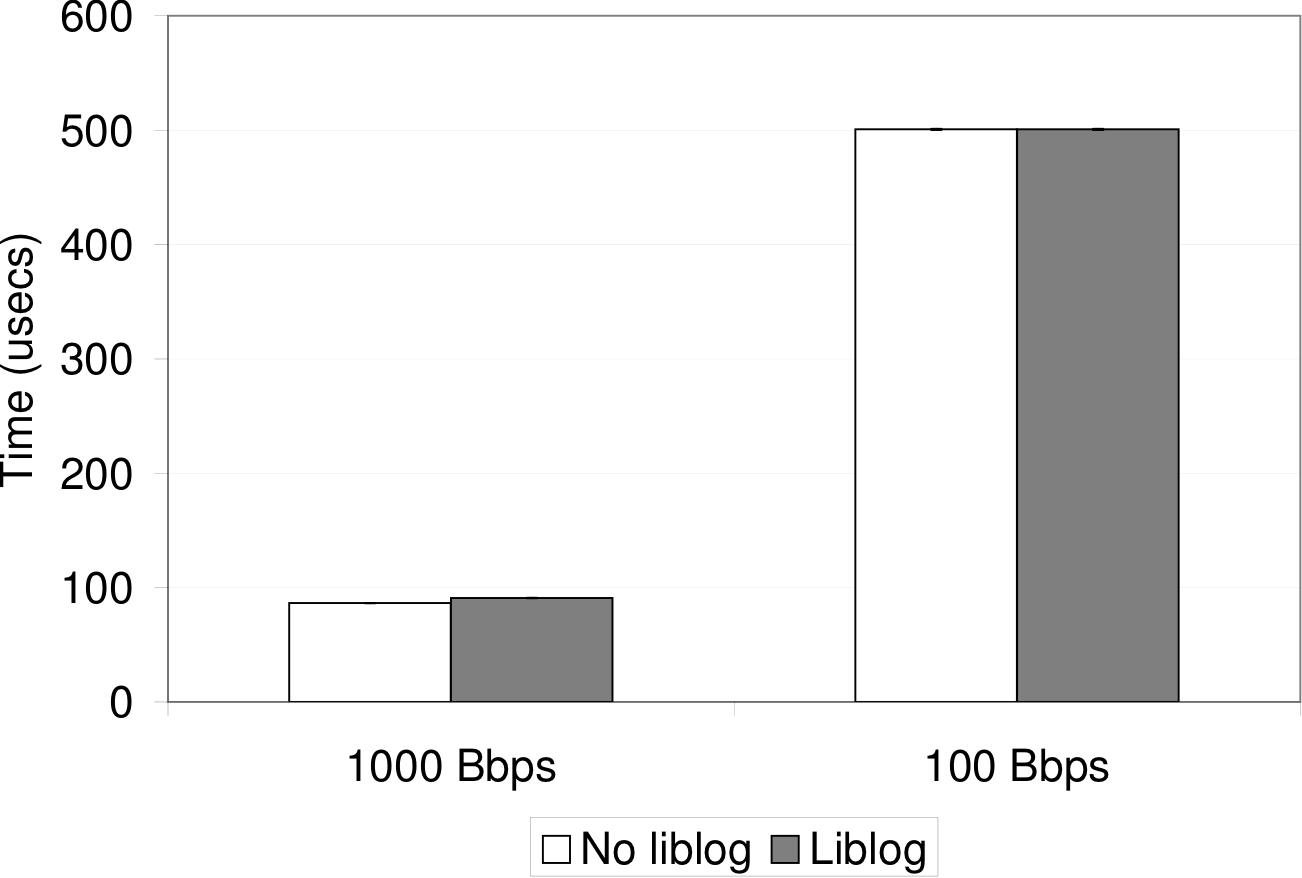
Figure 7: RTT overhead: measured by lmbench.
The error bars cannot be seen in these graphs because the standard
deviation is negligible.
5.3 Log Bandwidth
The amount of log space required depends greatly on the frequency of
libc calls made by an application, as well as on the throughput and
content of its network traffic, because incoming message contents are
saved.
To give an idea of the storage rates one might expect, we first
measured the average log growth rate of the applications we use
ourselves: I3/Chord and the OCALA proxy. For this experiment, we
started a small I3 network on PlanetLab and attached a single local
proxy. No additional workload was applied, so the processes were only
sending their basic background traffic. We also show the logging
rates for wget downloading an executable file when we
artificially limit its download rate to simulate applications with
various network throughput. Figure 8 shows the
(compressed) log space required per hour for each application. This
rate varies widely across applications and correlates directly with
network throughput. We have found the 3-6 MB/hour produced by our
own applications to be quite manageable.
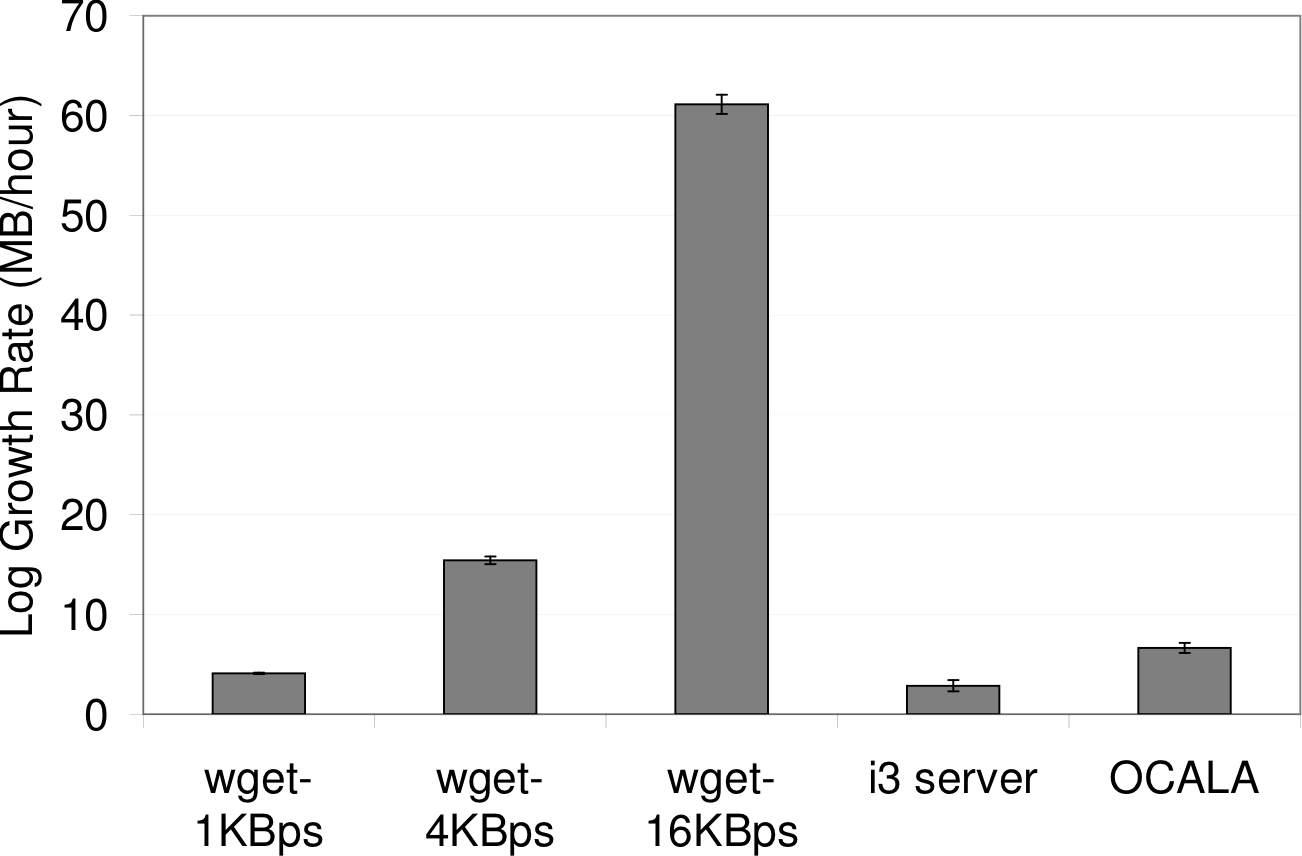
Figure 8: Log bandwidth: Log size written per hour for
various applications. The bottom three columns correspond to
wget with the specified cap on its download rate.
Figure 9 illustrates the degree to which message
contents affect the total log size. We limited wget to a
1 KB/s download rate and downloaded files of various entropy. The
first file was zero-filled to maximize compressibility. Then we
chose two real files: File A is a binary executable and File B is a
liblog checkpoint. Finally, we try a file filled with random
numbers, which, presumably, is incompressible. The
difference between zero and full entropy is over an order of
magnitude, although most payloads are presumably somewhere in the
middle.
Figure 9: Log entropy: Log size written by wget
depends on compressibility of incoming data.
5.4 Checkpoint Overhead
Finally, we measured the checkpoint latency (Figure 10) and size
(Figure 11) for a few of our test applications. The
checkpoint size depends on the amount of the application's address
space that is in use. The checkpoint latency is dominated by the time
required to copy the address space to file system buffers, which is
directly proportionally to the (uncompressed) checkpoint size. These
costs can be amortized over time by tuning the checkpoint frequency.
The trade-off for checkpoint efficiency is slower replay, because more
execution must be replayed on average before reaching the point of
interest.
Figure 10: Checkpoint Latency: time taken to dump
memory to checkpoint file for various applications.
Figure 11: Checkpoint Size: total and compressed size of
checkpoints for various applications.
5.5 Evaluation Summary
These experiments suggest that the CPU overhead imposed by liblog
is sufficiently small for many environments and has little affect on
network performance. Logging could consume considerable disk space
(and disk bandwidth), but the distributed applications we are familiar
with (I3/Chord and OCALA) could store logs for a week or two, given
1GB of storage. Checkpoints also consume a noticeable amount of
space, but writing one once an hour is probably sufficient for most
cases.
6 Experience
We have been working on liblog for over a year, but we completed
the prototype described in this paper only a few weeks ago. In the
intervening time, we have used the tool on distributed applications with
which we are familiar, namely
I3/Chord [SAZ+02] and the OCALA
proxy [JKK+06]. We have already
discovered several errors in these applications. In this section, we
will describe how liblog helped in these cases, along with a few
stories from earlier prototypes and work debugging liblog itself.
6.1 Programming Errors
To start, we found a few simple mistakes that had escaped detection
for months. The first, inserted accidentally by one of this paper's
authors over a year ago, involved checking Chord timeouts by calling
gettimeofday within a ``MAX'' macro that evaluated its
arguments twice. The time changed between calls, so the
value returned was not always still the maximum.
We also found an off-by-one error in code that assumed 1-based arrays
and timer initialization code that did not add struct timeval
microseconds properly, both in OCALA's I3 library.
The off-by-one error normally had no visible effect but occasionally
caused the proxy to choose a distant, high-latency gateway. The two
timer-related errors only manifested occasionally but would cause
internal events to trigger too late, or too early, respectively.
These bugs had escaped earlier testing because they were
non-deterministic and relatively infrequent. But once we noticed the
problems, liblog was able to deterministically replay the exact
execution paths so that we could step through the offending code in GDB
and watch the problem unfold.
6.2 Broken Environmental Assumptions
Perhaps more interesting are bugs caused not by programmer mistakes
but rather by correct implementation based on faulty assumptions. To
illustrate, here are two problems in Chord we had found with an
earlier liblog prototype.
The first problem is common in peer-to-peer systems, and was discussed
along with solutions in a later paper [FLRS05].
Basically, many network overlays like Chord assume that the underlying
IP network is fully connected, modulo transient link failures. In
practice, some machine pairs remain permanently disconnected due to
routing policy restrictions and some links experience unexpected
partial failure modes, such as transient asymmetry. Both problems cause
routing inconsistencies in Chord, and both were witnessed by liblog
in a network deployed across PlanetLab [PL].
Rather than finding a coding error in the application, replay showed
us code that worked as designed. Our project is focused on
application debugging, and we do not attempt to debug the underlying
network; nevertheless, our logs clearly showed the unexpected
message-loss patterns. Of course the problem had not been detected using
simulation, because the simulator made the same assumptions about the
network as the application.
A second assumption we had made was that our application processes
would respond to keep-alive messages promptly. Chord includes RTT
estimation and timeout code based on TCP, which expects a reasonable
amount variance. On PlanetLab, however, high CPU load occasionally
causes processes to freeze for several seconds, long enough for
several successive pings to time out. Chord then incorrectly
declared peers offline and potentially misrouted messages.
Upon inspection, liblog showed us that the
timeout code was operating correctly, and the message tracing
facilities detected the keep-alive responses arriving at the correct
machines, although long after they had been considered lost. The
virtual clock timestamps let us correlate otherwise-identical
messages, as well as detect the long delay in between system calls on
the pinged machine.
6.3 Broken Usage Assumptions
We found two problems with the OCALA proxy's overlay client
initialization code, both caused by sensitivity to the bootstrap
gateway list. Like those of the previous section, these ``bugs'' were
not programming errors per se, but rather user errors (providing an
imperfect configuration list) or design flaws (not tolerating user
error).
One phase of startup involves pinging these gateways and triangulating
the local machine's latitude and longitude based on the response
times. We noticed that the proxy occasionally made a very poor
estimate of local coordinates, which then caused a poor (high latency)
choice of primary gateways.
We investigated the phenomenon by setting breakpoints in the relevant
methods and stepping through the replay. We noticed first that very
few points were used for triangulation. We then moved
backwards in the execution to find that only a small number of
pings were sent and that the proxy did not wait long enough for most the
replies. If care is taken to nominate only lightly loaded gateways,
triangulation works fine. If not, as in our case, performance suffers
until periodic maintenance routines manage to choose a better gateway,
which could take hours.
We also discovered that the proxy client is very trusting of liveness
information contained in the initial gateway list. Normally this list
is continually updated by an independent process so that only active
gateways are included. If the list becomes stale, as we
unintentionally allowed, the proxy could waste minutes trying to
contact dead I3 servers before finally connecting.
We diagnosed the problem by replaying and comparing the paths taken by
two executions: one which exhibited the interminable timeouts and one
which lucked upon a good subset of gateways immediately. This problem
could easily be dismissed as invalid usage. Nevertheless, solving it
relied on our ability to deterministically replay the random choices
made during the gateway selection process.
6.4 Self-Debugging
The program we have spent the most time debugging recently is liblog
itself. Because the tools run as shared libraries in the application
address space, we are able to use GDB to set breakpoints and to step
through our own code during replay, just like the supposed target
application. We used this ability to fix programming errors in our message
annotation layer and our remote discovery service. Deterministic
replay also made it easy to find faults in our replay console because each
log provided a repeatable test case.
Some bugs in liblog, such as incomplete libc wrappers, manifest
as non-determinism during replay. Ironically, this non-determinism
made them easy to detect because we could step through the execution
at the point where the original execution and replay diverged in order
to isolate the failure. This approach also led us to realize the
problem of applications accessing undefined heap and stack memory.
6.5 Injected Bugs
Our tool is interactive, aiding a human programmer but requiring
their domain knowledge and expertise. We find it difficult to
quantify the benefit liblog provides because the user injects a large
amount of variability into the process. Ideally, we will be able to
compile a large library of ``real'' bugs that exist in tested and used
applications for some time before being fixed with liblog. But
this process is slow and unpredictable.
Projects that develop automated analytic techniques often pull known
errors from bug databases and CVS histories in order to quantify how
many of the problems can be re-fixed with their tools. This path is
also available to use, but the results would be somewhat suspect as
the human tester may have some prior knowledge of old bugs.
Similar doubts may arise if one set of programmers manually introduces
errors into a current application code base for testing by an
independent second group. This trick has the benefit of testing our
tools on bugs that are arbitrarily complex or slow to develop.
While we wait for our library of real bugs to grow, we have decided to
try both of these somewhat-artificial testing methods. So far we have
only started on the latter, with one author injecting an error into
the I3/Chord code base while the other uses liblog to isolate and
fix it. Preliminary results suggest that the task is equivalent to
debugging Chord in a local simulator. We plan to have more results in
this vein soon.
7 Related Work
Deterministic replay has been a reasonably active research subject for
over two decades. Most of this work centered on efficient logging for
multiprocessors and distributed shared memory computers; for an
overview of the field we recommend an early survey by Dionne et
al [DFD96] and later ones by
Huselius [Hus02] and Cornelis et
al [CGC+03].
None of these previous projects focused on deployed, distributed
applications or addressed the technical challenges raised by that set
of requirements. In particular, our support of consistent group replay
in a mixed environment is unique, and we are the first to address the
challenges described in Section 3, such as
supporting multithreaded applications without kernel support.
On the other hand, the core techniques of logging and replay have been
explored thoroughly, and we borrowed or reinvented much from earlier
projects. Specifically, Lamport clocks [Lam78] have
been used for consistent replay of MPI [RBdK99] and
distributed shared memory [RZ97]. Replaying
context switches to enforce deterministic replay in multithreaded apps
was based on DejaVu [KSC00], which built the technique
into a Java Virtual Machine. Finally, some projects have
integrated GDB and extended its interface to include replay
commands [SKAZ04, KDC05], but only
liblog seamlessly provides consistent replay across multiple
processes.
Our library-based implementation most closely resembles
Jockey [Sai05]; they also have simple binary-rewriting
functionality to detect use of non-deterministic applications.
Flashback [SKAZ04] also has many similarities,
but they chose to modify the host OS. Their modifications enable very
efficient checkpoints and (potentially) simplified thread support. We
chose instead to implement all of liblog at user level in order to maximize
its portability and to lower barriers to use on shared infrastructure.
Also, our support for multiple threads, migratable checkpoints, and
consistent replay across machines makes liblog more appropriate for
distributed applications.
The DejaVu project [KSC00] shared our
goal of replaying distributed applications. Like liblog, they
support multithreaded applications and consistently replay
socket-based network communication. Unlike liblog, they targeted
Java applications and built a modified Java Virtual Machine. Thus they
addressed a very different set of implementation challenges. Also,
they do not support consistent replay in a mixed environment, although
they do sketch out a potential solution.
8 Conclusion
We have designed and built liblog, a new logging and replay tool
for deployed, distributed applications. We have already found it to
be useful and would like to share the tool with others in the
distributed systems community. A software distribution package and more
information is available at https://research.geels.org:8080/.
We have plans for a few additional improvements to liblog, both to
reduce its runtime overhead and to remove some of the limitations listed
in Section 4. Meanwhile, we hope to receive
feedback from the community that will help us improve its usability.
Our ongoing research plan views liblog as a platform for building
further analysis and failure detection tools. Specifically, replaying
multiple processes together provides a convenient arena for analyzing
distributed state. We see great potential for consistency checking
and distributed predicate evaluation tools.
References
- [CGC+03]
-
Frank Cornelis, Andy Georges, Mark Christiaens, Michiel Ronsse, Tom Ghesquiere,
and Koen De Bosschere.
A taxonomy of execution replay systems.
In Proceedings of International Conference on Advances in
Infrastructure for Electronic Business, Education, Science, Medicine, and
Mobile Technologies on the Internet, 2003.
- [Ckp]
-
Ckpt project website.
https://www.cs.wisc.edu/ zandy/ckpt/.
- [DFD96]
-
Carl Dionne, Marc Feeley, and Jocelyn Desbiens.
A taxonomy of distributed debuggers based on execution replay.
In Proceedings of the International Conference on Parallel and
Distributed Processing Techniques and Applications, Sunnyvale, CA, August
1996.
- [FLRS05]
-
Michael J. Freedman, Karthik Lakshminarayanan, Sean Rhea, and Ion Stoica.
Non-transitive connectivity and dhts.
In Proceedings of WORLDS, December 2005.
- [GDB]
-
Gnu debugger website.
https://gnu.org/software/gdb/.
- [HH05]
-
Alex Ho and Steven Hand.
On the design of a pervasive debugger.
In Proceedings of the International Symposium on Automated
Analysis-Driven Debugging, September 2005.
- [Hus02]
-
Joel Huselius.
Debugging parallel systems: A state of the art report.
Technical Report MDH-MRTC-63/2002-1-SE, Maelardalen Real-Time
Research Centre, September 2002.
- [JKK+06]
-
Dilip Joseph, Jayanthkumar Kannan, Ayumu Kubota, Karthik Lakshminarayanan, Ion
Stoica, and Klaus Wehrle.
Ocala: An architecture for supporting legacy applications over
overlays.
In Proceedings of NSDI, May 2006.
- [KDC05]
-
Samuel T. King, George W. Dunlap, and Peter M. Chen.
Debugging operating systems with time-traveling virtual machines.
In Proceedings of the USENIX 2005 Annual Technical Conference,
June 2005.
- [KSC00]
-
Ravi Konuru, Harini Srinivasan, and Jong-Deok Choi.
Deterministic replay of distributed java applications.
In Proceedings of International Parallel and Distributed
Processing Symposium, May 2000.
- [Lam78]
-
Leslie Lamport.
Time, clocks, and the ordering of events in a distributed system.
Communications of the ACM, 21(7):558--565, July 1978.
- [NM92]
-
Robert H. B. Netzer and Barton P. Miller.
Optimal tracing and replay for debugging message-passing parallel
programs.
In Proceedings of the International Conference on
Supercomputing, November 1992.
- [NPC05]
-
Satish Narayanasamy, Gilles Pokam, and Brad Calder.
Bugnet: Continuously recording program execution for deterministic
replay debugging.
In 32nd International Symposium on Computer Architecture, 2005.
- [nVa]
-
Valgrind project website.
https://valgrind.org/.
- [PL]
-
Planet-lab project website.
https://planet-lab.org/.
- [Pur]
-
Purify website.
https://ibm.com/software/awdtools/purify/.
- [Py]
-
Python project website.
https://python.org/.
- [RBdK99]
-
Michiel Ronsse, Koenraad De Bosschere, and Jacques Chassin de Kergommeaux.
Execution replay for an mpi-based multi-threaded runtime system.
In Proceedings of the International Conference Parallel
Computing, 1999.
- [RZ97]
-
Michiel Ronsse and Willy Zwaenepoel.
Execution replay for treadmarks.
In Proceedings of EUROMICRO Workshop on Parallel and Distributed
Processing, January 1997.
- [Sai05]
-
Yasushi Saito.
Jockey: A user-space library for record-replay debugging.
In Proceedings of the International Symposium on Automated
Analysis-Driven Debugging, September 2005.
- [SAZ+02]
-
Ion Stoica, Daniel Adkins, Shelley Zhuang, Scott Shenker, and Sonesh Surana.
Internet indirection infrastructure.
In Proceedings of ACM SIGCOMM, August 2002.
- [SH]
-
Simics hindsight.
https://www.virtutech.com/products/simics-hindsight.html.
- [SKAZ04]
-
Sudarshan M. Srinivashan, Srikanth Kandula, Christopher R. Andrews, and
Yuanyuan Zhou.
Flashback: A lightweight extension for rollback and deterministic
replay for software debugging.
In Proceedings of the USENIX 2004 Annual Technical Conference,
June 2004.
- [SSL]
-
Openssl project website.
https://openssl.org/.
- [TH00]
-
Henrik Thane and Hans Hansson.
Using deterministic replay for debugging of distributed real-time
systems.
In Proceedings of 12th Euromicro Conference on Real-Time
Systems, June 2000.
- [XBH03]
-
Min Xu, Rastislav Bodik, and Mark Hill.
A flight data recorder for enabling fullsystem multiprocessor
deterministic replay.
In 30th International Symposium on Computer Architecture, 2003.
- 1
- See RFC 791
This document was translated from LATEX by
HEVEA.
|