
|
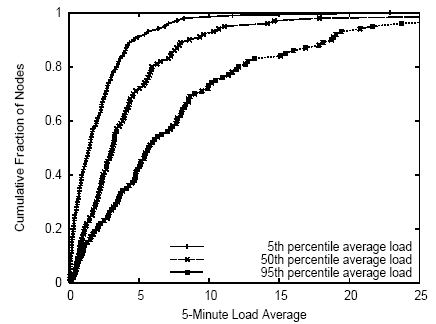
Figure 2: CDF of node loads at three representative moments in the trace: when load averaged across all nodes was ``typical'' (median), ``low'' (5th percentile), and ``high'' (95th percentile).
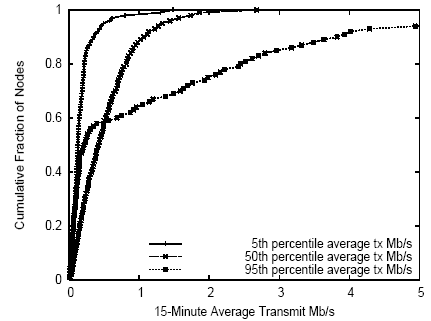
Figure 3: CDF of node 15-minute transmit bandwidths at three representative moments in the trace: when node transmit bandwidth averaged across all nodes was ``typical'' (median), ``low'' (5th percentile), and ``high'' (95th percentile). We found similar results for 15-minute receive bandwidth.
Table 1 shows that static per-node PlanetLab node characteristics are fairly homogeneous across nodes. However, dynamic resource demands are heavy and vary over both space and time. To quantify such variation, we consider the 5-minute load average on all PlanetLab nodes at three instants in our 6-month trace. These instants correspond to an instant of low overall platform utilization, an instant of typical platform utilization, and an instant of high platform utilization. Figure 2 shows a CDF of the 5-minute load average across all nodes at three separate moments in time: the time when the load averaged across all nodes was the 5th percentile of such averages over the entire trace (low platform utilization), the time when the load averaged across all nodes was the the median of such averages over the entire trace (typical platform utilization), and the time when the load averaged across all nodes was the 95th percentile of such averages over the entire trace (high platform utilization). Analogously, Figure 3 shows a CDF of the 15-minute average transmit bandwidth across all nodes at three different moments: low, typical, and high utilization of platform-wide transmit bandwidth. Results for receive bandwidth were similar.
We see that load varies substantially across nodes independent of overall system utilization, while network bandwidth utilization varies substantially across nodes primarily when the platform as a whole is using significantly higher-than-average aggregate bandwidth. This suggests that load is always a key metric when making application placement decisions, whereas available per-node network bandwidth is most important during periods of peak platform bandwidth utilization. Note that periods of low platform bandwidth utilization may be due to low aggregate application demand or due to inability of the network to satisfy demand.
Not only per-node attributes, but also inter-node characteristics,
vary substantially across nodes. Figure 4 shows
significant diversity in latency and available bandwidth
among pairs
of PlanetLab nodes.
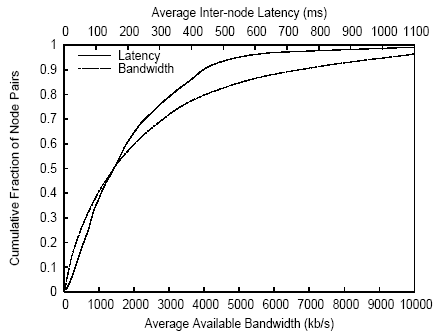
Figure 4: CDF of node-pair latencies and available bandwidths over the entire trace.
Furthermore, we find that PlanetLab nodes exhibit a wide range of MTTFs and MTTRs. Figure 5 shows MTTF and MTTR based on ``uptime'' measurements recorded by nodes. We declare that a node has failed when its uptime decreases between two measurement intervals. We declare the node to have failed at the time we received the last measurement report with a monotonically increasing uptime, and to have recovered at t_report - delta(t_up), where t_report is the time we receive the measurement report indicating an uptime less than the previous measurement report, and delta(t_up) is the uptime measurement in that report. Computing MTTF and MTTR based on ``all-pairs pings'' data, with a node declared dead if no other node can reach it, yields similar results. Compared to the uptime-based approach, MTTF computed using pings is slightly lower, reflecting situations where a node becomes disconnected from the network but has not crashed, while MTTR computed using pings is slightly higher, reflecting situations in which some time passes between a node's rebooting and the restarting of network services.
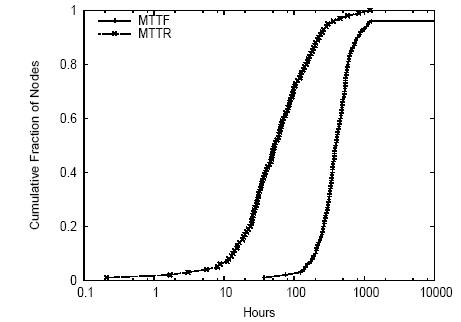
Figure 5: CDF of MTTF and MTTR based on ``uptime.'' These curves show median availability of 88% and 95th percentile availability of 99.7%.
These observations of substantial heterogeneity across node and node-pair attributes suggest that there is much available resource diversity for a service placement mechanism to exploit.