
Finally we investigate the predictability of host resources over time. We focus on predicting host 5-minute load average and 15-minute bandwidth average, over periods of 5 minutes and 1 hour.
The most well-known step-ahead predictors in the context of wide-area
platforms are those implemented in the Network Weather
Service (NWS) [29]. Although originally designed to predict network
characteristics, they have also been used to predict host CPU
load [31]. We consider the following NWS predictors:
last value, exponentially-
weighted moving average (EWMA), median,
adaptive median, sliding window average,
adaptive average, and running average. For each prediction strategy
and host, we compute the average absolute value prediction error for
that host across all time intervals, and the standard deviation of the
prediction errors for that host. Table 3 shows the
average bandwidth prediction error and average load prediction error for the median
host using the three NWS techniques that performed best for our
dataset (last, EWMA, and median). We also show results for a ``dynamic tendency'' predictor,
which predicts that a series of measurements that has been increasing
in the recent past will continue to increase, and a series that has
been decreasing in the recent past will continue to
decrease [31]. The 5-minute and one-hour predictors
operate identically except that the input to the one-hour predictors
is the average value over each one-hour period, while the input to the
5-minute predictor is each individual measurement in our trace.
We find that the ``last value'' predictor performs well over time periods of an hour, confirming and extending our findings from Figures 12 and 13 that load and network bandwidth usage remain relatively stable over periods of an hour. However, as we can see from Figures 2 and 3, the system undergoes dramatic and unpredictable resource demand variations over longer time scales.
The ``dynamic tendency'' and ``last value'' predictors perform the best of all predictors we considered, for the following reason. All other predictors (EWMA, median, adaptive median, sliding window average, adaptive average, and running average) predict that the next value will return to the mean or median of some multi-element window of past values. In contrast, the dynamic tendency predictor predicts that the next value will continue along the trend established by the multi-element window of past values. The ``last value'' predictor falls between these two policies: it keeps just one element of state, predicting simply that the next value will be the same as the last value. PlanetLab load and network utilization values tend to show a mild tendency-based pattern--if the load (or network utilization) on a node has been increasing in the recent past, it will tend to continue increasing, and vice-versa. As a result, the dynamic tendency and last value predictors perform the best. Our results resemble those in [31], which showed errors in the 10-20% range for both last-value and dynamic tendency predictors, in a study of loads from more traditional servers.
|
Analogous to using a machine's last load value as a prediction of its next load value, we might use a node's historical MTTF (MTTR) to predict its future MTTF (MTTR). To evaluate the effectiveness of this technique, we split the trace of node failures and recoveries that we used in Section 3.1 into two halves. For each node, we calculate its MTTF and MTTR during the first half of the trace. We predict that its MTTF (MTTR) during the second half will be the same as its MTTF (MTTR) during the first half, and calculate the percentage error that this prediction yields. Figure 20 shows a CDF of the fraction of nodes for which this predictor yields various prediction errors. We find substantial prediction error (greater than 100%) for only about 20% of nodes, suggesting that historical node MTTF and MTTR are reasonable criteria for ranking the quality of nodes when considering where to deploy an application. On the other hand, this prediction technique does not yield extremely accurate predictions--for MTTF, error for the median node is 45%, and for MTTR, error for the median node is 87%.
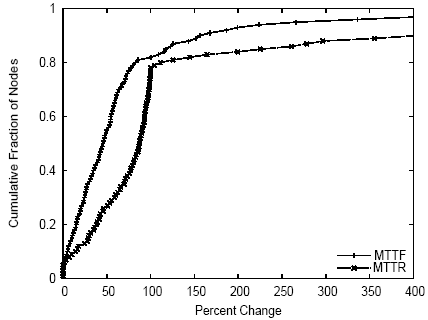
Figure 20: Prediction error for MTTF and MTTR.
Finally, we examine the periodicity of resource availability. Periodicity on the time scale of human schedules is a common form of medium-term temporal predictability. It is often found in utilization data from servers hosting applications with human-driven workloads. For example, a web site might see its load dip when it is nighttime in the time zones where the majority of its users reside, or on weekends. We therefore examined our PlanetLab traces for periodicity of per-node load and network bandwidth usage over the course of a day and week. We found no such periodicity for either attribute. In fact, on average, the load or network bandwidth usage on a node at time t was less closely correlated to its value at time t+24 hours than it was to its value at a random time between t and t+24 hours. Likewise, on average, the load or network bandwidth usage on a node at time t was less closely correlated to its value at time t+1 week than it was to its value at a random time between t and t+1 week.
The lack of daily and weekly periodicity on PlanetLab can be explained by the wide geographic distribution of application deployers and the users of the deployed services such as those studied earlier in this paper. Further, load on PlanetLab tends to increase substantially around conference deadlines, which happen on yearly timescales (beyond the granularity of our trace) rather than daily or weekly ones. In sum, we find that resources values are more strongly correlated over short time periods than over medium or long-term ones.
David Oppenheimer 2006-04-14