As a qualitative argument, we note that without an explicit energy-related abstraction similar to currentcy, it is difficult to articulate precisely what residual energy means or identify means to enforce a target battery lifetime. Monitoring the state of the battery as a separate device-specific resource offers little in the way of control over the resource. Thus, there is no ``traditional'' baseline policy with which it makes sense to compare. We compare against the original currentcy allocation [22] with its battery-level feedback mechanism that adaptively adjusts overall allocation levels. In that original policy, residual energy accumulates if a task does not spend all of its currentcy and has exceeded its currentcy cap causing that unspent currentcy to be lost. We show that the original approach is less effective in reclaiming residual energy than explicit currentcy conservation.
To evaluate the benefits of currentcy conservation we use a workload consisting of the gqview image viewer and ijpeg. Gqview is set to autobrowse mode where it continuously loads each of 12 images in a directory with a 10 second pause between each image. The images are copies of a high fidelity 0.5MB jpeg file, differing only in that each image has a unique number. The computationally intensive ijpeg is run in a loop to continuously execute the SPEC command line, encoding and decoding an image from the reference data set residing in memory (SPEC command line options: -GO.findoptcomp vigo.ppm).
For this experiment, we set the target battery lifetime at 90 minutes, and set desired shares of 66.6% for gqview and 33.3% for ijpeg. These allocation settings correspond to an overall average power of 12000mW with 8000mW and 4000mW for gqview and ijpeg, respectively. This represents an overly generous allocation to gqview which needs less than an average of 7000mW (c.f., Figure 3a). Ijpeg, on the other hand, can easily consume up to 15.55W in the absence of other constraints.
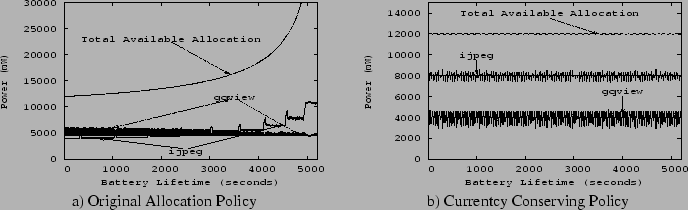 |
Figure 1 shows our results. These plots show how the total allocation (presented in mW) changes over the lifetime of the battery. They also show the average power consumption of our two applications for the three managed devices. The per-epoch measurements have been smoothed using a centered moving average over a window of twenty-one data points.
From these data, we make several observations. First, for the original allocation policy (Figure 1a) we see that the total power available for allocation (the top curve) increases dramatically near the end of the target battery lifetime. There is approximately 6.7% of the original battery capacity remaining at the end. The simple redistribution approach that returns gqview's unused currentcy (beyond the task's cap) to the overall energy resource initially spreads the excess over a large number of epochs, but as the target battery lifetime approaches there is less time over which to spread the excess. Intuitively, each epoch consumes only a fraction of the total excess and thus available energy continues to grow. In addition, gqview still receives its share of the increasing overall allocation that it does not need.
The second observation we make based from Figure 1a is that as time progresses, gqview's average power consumption (the middle line exhibiting some degree of scatter) decreases over time despite the increase in total availability. This is because the increase in available currentcy enables ijpeg (the bottom solid line that steps up toward the end of the lifetime) to consume more and more CPU time with the baseline CPU scheduling, undermining gqview's ability to execute when it needs to in order to consume its currentcy.
Figure 1b shows the average power consumption of gqview and ijpeg when using the currentcy conserving allocation. We see that there is no significant change in the available allocation as we near the end of the target lifetime. Little residual energy capacity remains (less than 1%). By exploiting information in tasks' currentcy budgets, the currentcy conserving allocation policy successfully utilizes the available energy as compared to the approach that reacts to observed excess battery capacity. Formal analysis of these policies, using control systems theory, reveals that the original policy is unstable while the currentcy-conserving policy is stable.
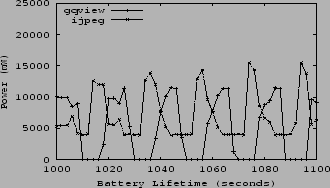
There are variations in the power consumption of both applications due to gqview's execution variation that are not captured in the smoothed plots. To provide a better understanding of the simultaneous execution of ijpeg and gqview, Figure 2 presents the power consumption in each epoch over a 100 second time interval. This figure shows that when gqview is idle (i.e., during ``think'' time with zero power consumption) ijpeg can consume maximum CPU power. However, when gqview is active, ijpeg is limited to its 4000mW allocation. There is a brief delay in this transition that occurs while ijpeg's currentcy cap is adjusted. We observe that the power consumption of both gqview and ijpeg can exceed their allocation share because of currentcy accumulating up to their caps.