
To simulate heavy small-file system loads we use the PostMark benchmark [2]. PostMark was designed to create a large pool of continually changing files and to measure the transaction rates for a workload approximating a large Internet e-mail server.
We use the default PostMark configuration parameters. The initial number of files created is 500. Files range between 500 bytes and 9.77 kilobytes in size. PostMark then performs 500 transactions on each file. Block sizes for reads and writes are 512 bytes and UNIX buffered I/O is used. We run each PostMark test 10 times and take the average.
We compare three versions of DisCFS to FFS, NFSv2 and NFSv3. DisCFS_NK is a crippled version of our system offering no security; no KeyNote queries are made. Instead, full access is returned for every file. DisCFS_COLD is a fully functional system, but the server was restarted between each successive run of the benchmark. Results for DisCFS_WARM reflect the effects of using a cache of 1024 policy results and not restarting the server between successive runs of the benchmark.
 |
Figure 8 shows results for the average creation rate (files/second) for files created before other transactions were performed and the average deletion rate (files/second) for files deleted after all other transactions were performed. When PostMark creates a file, it selects a random initial size, and writes text from a random pool up to the chosen length. File deletion selects a random file from the list of active files and deletes it. The performance of DisCFS_NK is approximately equivalent to NFSv2 when the credential processing overhead is eliminated. DisCFS_COLD results show that the credential processing overhead is significant. Performance drops by more than 50%. This is not surprising because upon each file creation the DisCFS server must create a new credential, sign it and evaluate it in the KeyNote session. Upon each deletion a query must determine whether the operation should be permitted. As the DisCFS server begins to service most requests from the cache after the first run of PostMark, numbers for DisCFS_WARM return to just below the performance of DisCFS_NK.
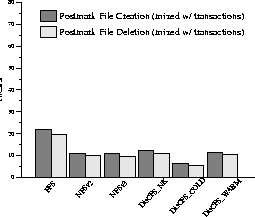 |
Figure 9 also presents average file creation and deletion rates, but in this case the files are created and deleted during a sequence of other transactions. As expected, overall performance drops compared to the previous isolated case, but DisCFS performance remains the same in relation to NFSv2 performance.
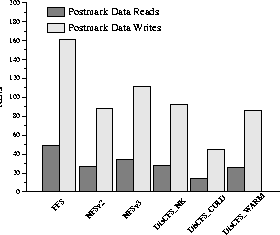 |
Finally, results presented in Figure 10 reflect system data throughput. For the read test, PostMark opens a randomly selected file and reads the entire file into memory using the configured block size (512 bytes). For the append test, PostMark opens a random file, seeks to the end of it, and writes a random amount of data. As expected, the throughput for writes is better than for reads because writes go through the buffer cache. Performance of DisCFS is again comparable to NFSv2 when the credential overhead is eliminated artificially (DisCFS_NK), or by caching ( DisCFS_WARM). With a cold cache (DisCFS_COLD) the performance drops by more than half due to the frequent KeyNote queries.
We use the top utility to monitor CPU utilization during the PostMark benchmarks. The NFSv2, NFSv3 and DisCFS_NK servers utilize less than 1% of the CPU. Utilization for DisCFS_COLD reaches up to 60% during the file creation test due to the number of cryptographic operations the server must perform. Caching brings the number down to 4% for DisCFS_WARM.
To explore the overhead of credential handling imposed by real world applications, we time a recursive grep for ifdefs in every file of the OpenBSD kernel source tree. We conduct the test with a cache size of 128 policy results and a pool of 5000 sessions. The cache contains the permission bits returned by previous policy lookups. The DisCFS server adds credential assertions to a session. Having more sessions helps to distribute them and speeds up the query evaluation. We use three versions of our system: DisCFS with full credential functionality (DisCFS1), DisCFS with no signature verification of the credentials (i.e., all credentials are trusted) (DisCFS2), and finally a version of DisCFS that does not use credentials at all and just returns full access for every file (DisCFS3). We summarize our results in Figure 11.
![\begin{figure}
\scalebox{0.7}{
\begin{barenv}
\setyaxis{0}{100}{10}\setyname{Tim...
...1.44}{6}[\texttt{NFSv2}]
\bar{31.83}{5}[\texttt{NFSv3}]\end{barenv}}\end{figure}](img11.gif) |
The total number of files accessed is 5236. By comparing the access times of DisCFS1 and DisCFS3 we see that the overhead per file is less than 3.5 ms. This overhead is caused by the credential processing and signature verification. Note that this is a worst-case scenario, since our test accessed every file exactly once. During a normal session, we expect that users will make multiple accesses to the files they have attached, thus amortizing the verification overheads over the lifetime of their session. Additionally, while the DisCFS overhead may be significant in the local area network access scenario, in accesses over a wide area network the verification overheads become less significant.
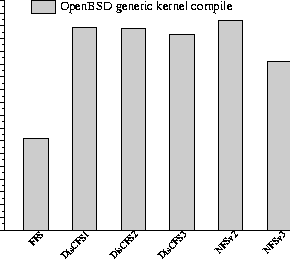
As a more representative test, we compare the time to compile the OpenBSD kernel over the local filesystem (FFS), NFSv2, NFSv3, and the three versions of DisCFS. This experiment involves access control decisions for approximately 4500 source and 2600 generated files (object and header files, as well as the produced kernel image). We show our results in Figure 12. As expected, the local filesystem is the fastest; however, the cost of the full DisCFS implementation (including signature verification and complete policy evaluation per file access) is negligible, compared to the plain NFSv2 case. (Notice that DisCFS seems to be slighly faster than NFSv2. The primary reason for this is the greatly simplified code running on the DisCFS server, which is effectively a very minimal NFS server.) The overhead due to credential signature verification, i.e., the difference between DisCFS1 and DisCFS2, is just 4 seconds. The overhead of using credentials, i.e., the difference between DisCFS1 and DisCFS3 is about 30 seconds. The access control costs that are more evident in Figure 11 are amortized over the actual operation of the system. This conclusion matches our previous experience in evaluating the relative costs of security mechanisms: although cryptographic (or other) costs may seem high when viewed in the context of a micro-benchmark, their impact during regular user activities is minimal [22].
 |
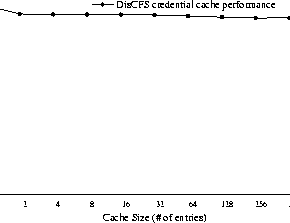
In our last experiment, we evaluate how different cache sizes affect DisCFS performance in our compilation experiment. In Figure 13, we see that increasing the cache size results in a gradual improvement, leveling off at about 256 entries. Even limited caching of policy decisions improves performance by more than 5%. Inevitably this will vary depending on the file access patterns and an extensive evaluation of optimum cache size is beyond the scope of this paper. However, we believe that it is beneficial to include even a small cache for keeping recent policy results.
 |