


Next: Properties
Up: Server Access Pattern
Previous: Temporal Locality
Figure:
Access and block distribution among different
frequencies. A point  on the block percentage curve
indicates that
on the block percentage curve
indicates that  % of total number of blocks are accessed
at least
% of total number of blocks are accessed
at least  times, while a point
  on the
access percentage curve represents that
on the
access percentage curve represents that  of total number of
accesses are to blocks accessed at least times.
of total number of
accesses are to blocks accessed at least times.
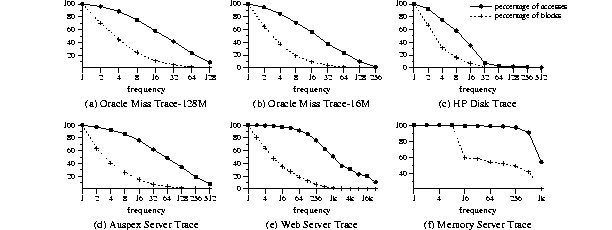 |
Next, we examined the behavior of server buffer cache accesses in terms of
frequency. While it is clear that server buffer cache accesses represent
misses from client buffer caches, the distribution of access frequencies
among blocks remains uncertain. If the distribution is even, then
most replacement algorithms will perform similarly to or worse than
LRU. If the distribution is uneven, then a good replacement algorithm
will keep frequently accessed blocks in a server buffer cache. Past
studies [11,38] have shown that blocks are typically
referenced unevenly: a
few blocks are hot (frequently accessed), some blocks are warm, and
most blocks are cold (infrequently accessed). Is this also true for
server buffer caches?
Our hypothesis is that both hot and cold blocks will be referenced
less frequently in server buffer caches, because hot blocks will stay
in client buffer caches most of the time and cold blocks will be
accessed infrequently by definition. If this hypothesis is true, the
access frequency distributions at server buffer caches should be
uneven, though probably not as uneven as those at client buffer
caches. A good server buffer cache replacement algorithm should be
able to identify warm blocks and keep them in server buffer caches for
a longer period of time than others.
In order to understand the frequency distributions of reference
sequences seen at server buffer caches, we examined the relationship
between access distribution and block distribution for different
frequencies. Similar to most cache studies, frequency here means the
number of accesses. Figure 4 shows, for a given frequency ,
the percentage of total number of blocks accessed at least
times. It also shows the percentage of total accesses to those types
of blocks. Notice that the number of blocks accessed at least  times includes blocks accessed at least
  times (
 ). This
explains why all the curves always decrease gradually. The access
percentage curves decrease similarly for the same reason.
For all four traces, the access percentage curves decrease more slowly
than the block percentage curves, indicating that a large percentage
of accesses are to a small percentage of blocks. For example, in the
Oracle Miss Trace-128M, around 60% accesses are made to less than 10%
blocks, each of which are accessed at least 16 times. This shows that
the access frequency distribution among blocks at server buffer caches
is uneven. In other words, a subset of blocks are accessed more
frequently than others even though the average temporal distance
between two correlated accesses in this subset is very large
(Figure 3). Thus, if the replacement algorithm can
selectively keep those blocks for a long period of time, it will
significantly reduce the number of misses, especially when the server
buffer cache size is small.
). This
explains why all the curves always decrease gradually. The access
percentage curves decrease similarly for the same reason.
For all four traces, the access percentage curves decrease more slowly
than the block percentage curves, indicating that a large percentage
of accesses are to a small percentage of blocks. For example, in the
Oracle Miss Trace-128M, around 60% accesses are made to less than 10%
blocks, each of which are accessed at least 16 times. This shows that
the access frequency distribution among blocks at server buffer caches
is uneven. In other words, a subset of blocks are accessed more
frequently than others even though the average temporal distance
between two correlated accesses in this subset is very large
(Figure 3). Thus, if the replacement algorithm can
selectively keep those blocks for a long period of time, it will
significantly reduce the number of misses, especially when the server
buffer cache size is small.
Next: Properties
Up: Server Access Pattern
Previous: Temporal Locality
Yuanyuan Zhou
2001-04-29