
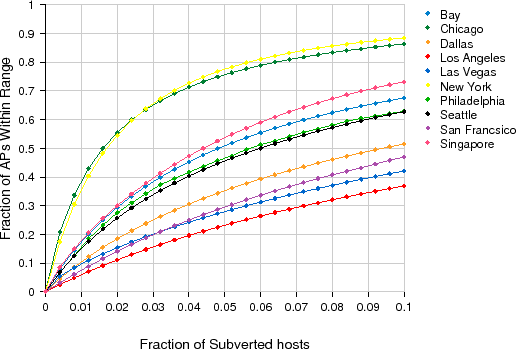
We determine how effective an attacker can be in tracking users using a botnet consisting of wifi-enabled hosts within a metropolitan area. For this purpose, we rely on the same wifi maps used for analyzing the worm and spoofing attacks. The effectiveness of a tracknet can be expressed in terms of coverage, that is, the fraction of wireless LANs that are within range from a given set of subverted nodes participating in the tracknet. The feasibility of a tracknet also relates to the number of subverted nodes that the attacker needs to obtain in order to achieve a certain level of coverage. As the attacker may have little control over which hosts to subvert (or buy access to) and where they are located, in each experiment we assume a random subset of hosts on the wifi map. As MAC addresses are exposed even when the network uses WEP or 802.11i encryption, we consider all access points regardless of whether they are open or protected - in other words, a tracker can monitor any network within range.
The results for 10 metro areas are shown in Figure 6. We observe that the fraction of subverted hosts needed to track users is relatively modest: with hosts on just 1% of all APs in a dense area, a tracknet can cover between 5% and 40% of all traffic. As expected, full coverage is not easy to achieve, but having trackers on around 7% can reach between 30% and 80% coverage. As with the worm and spoofing threats, the high density of Chicago and NYC make them particularly susceptible to this attack: less than 1,000 zombies are sufficient to cover 40% of the APs.
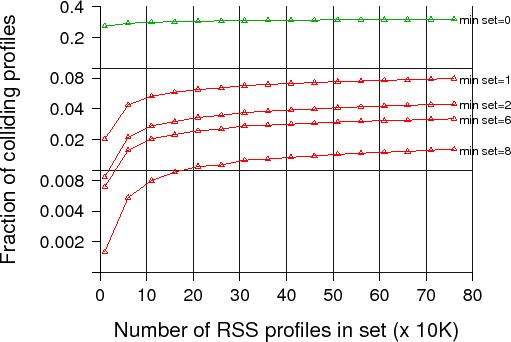
At the time of writing this paper, all MAC addresses are exposed, but it is worth investigating whether using disposable MAC addresses would help address this problem. As discussed previously, we are particularly concerned about other high-information-leak profiling techniques that could essentially offer uniquely identifying information equivalent to a MAC address. We focus on RSS feeds as one emerging source of leaks, and try to quantify the ability of an attacker to use this information for tracking purposes. For this purpose, we have obtained from an online service provider the set of RSS feeds that users are subscribed to, for around 100,000 users. The size of the dataset is important as we seek to measure the uniqueness of each RSS profile. We therefore measure for each user, whether any other users have the same exact profile, in which case we say that we have a profile collision (which could make tracking information ambiguous and confusing to the attacker). As some users have empty or very small profiles, we expect more collisions there, and we therefore compute collision statistics for those users with at least a minimum number of feeds in their RSS set.
The results are presented in Figure 7. As expected for a minimum RSS set of zero, that is, no constraints, the fraction of users with colliding profiles is around 30% - most of them are users with an empty profile. Removing only those that have an empty profile, that is, focusing on a minimum set of one entry, the collision probability is 0.02 to 0.07, significantly lower and reasonable enough to allow a tracknet to identify a user with high confidence, especially given that this information can be correlated with other data. For users with more substantial RSS feeds, the collision probability is between 0.002 and 0.01, indicating highly unique profiles. The scaling behavior of collision statistics is of particular importance here: we see that collision probability increases with the number of RSS profiles in the dataset, yet the difference seems to be small between a database of 50K users and a database of 100K users. If a tracknet is supposed to cover a whole city, the number of profiles can be much larger than the set we considered here, but our results suggest that collision probability is unlikely to worsen significantly. Furthermore, when a user's RSS fingerprint is coupled with location information such as mobility patterns, this set can be reduced even further.
|
|