
 |
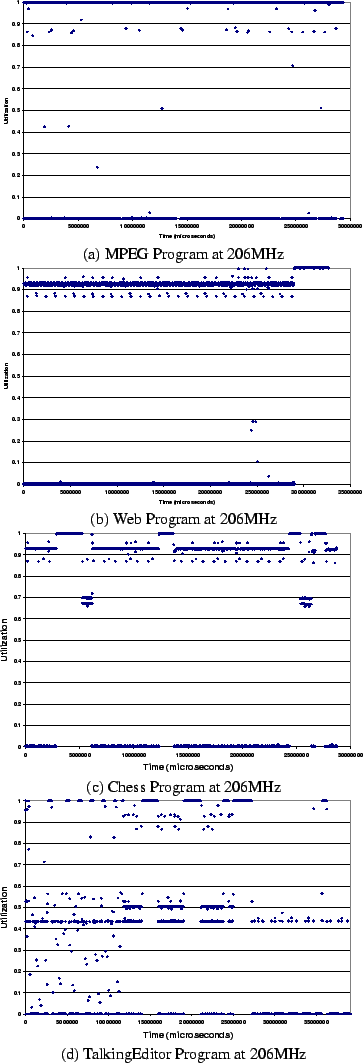
Figure 3 presents plots of the processor utilization over time for each of the benchmark applications. This information was gathered using the on-line process logging facility that we added to the kernel. Due to kernel memory limitations, we could only capture a subset of the process behavior. Each application was able to run at 132MHz and still meet any user interaction constraints (i.e. the application did not appear to behave any differently).
|
The utilization is computed for each 10ms scheduling quantum. We used the same 10ms interval for logging that is used for scheduling within Linux. Since most processes compute for several quanta before yielding, the system is usually either completely idle or completely busy during a given quantum. Some processes execute for only a short time then yield the processor prior to the end of their scheduling quanta; for example, the Java implementation we used has a 30ms I/O polling loop - thus, when the Java system is ``idle,'' there is a constant polling action every 30ms that takes about a millisecond to complete.
The behavior of the applications is difficult to predict, even for applications that should have very predictable behavior and each application appears to run at a different time-scale. The MPEG application renders at 15 frames/sec; there are 450 frames in the 30 second interval shown in Figure 3. Each frame is rendered in 67ms or just under 7 scheduling quanta. Any scheduling mechanism attempting to use information from a single frame (as opposed to a single quanta) would need to examine at least 7 quanta. Other applications have much coarser behavior. For example, the TalkingEditor application consumes varying amount of CPU time until the text is being loaded for speech synthesis. The bursty behavior prior to the speech synthesis results from dragging images, JIT'ing applications and opening files. Following this are long bursts of computation as the text is actually synthesized and send to the OSS-compatible sound driver. Finally, more cycles are taken by the sound driver. Thus, this application is bursty at a higher level.
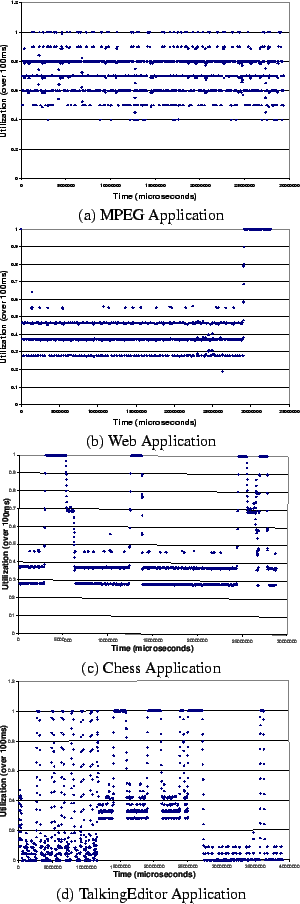
For most applications, patterns in the utilization are easier to see if you plot the utilization using a 100ms moving average, as shown in Figure 4. The MPEG application, in Figure 4(a), is still very sporadic because of inter-frame variation; for MPEG, there is even significant variance in CPU utilization (60-80%) when considering a 1 second moving average (not shown). The Chess and TalkingEditor applications show patterns influenced by user interaction. It's clear from Figure 4(c) that utilization is low when the user is thinking or making a move and that utilization reaches 100% when Crafty is planning moves. Likewise, Figure 4(d) shows the aforementioned pattern of synthesis and sound rendering.