To determine the failure properties of local DNS infrastructure, we systematically measure DNS lookup times on many PlanetLab nodes. In particular, across 40 North American sites, we perform a query once per second. We ask these nodes to resolve each other's names, all of which are cacheable, with long time-to-live (TTL) values of no less than 6 hours. Lookup times for these requests should be minimal, on the order of a few milliseconds, since they can be served from the local nameserver's cache. This diagnostic workload is chosen precisely because it is trivially cacheable, making local infrastructure failures more visible and quantifiable. Evaluation of DNS performance on live traffic, with and without CoDNS, is covered in Section 5.
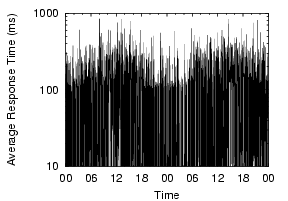
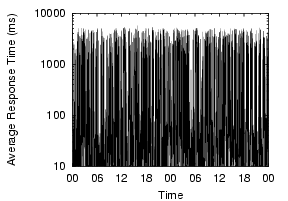
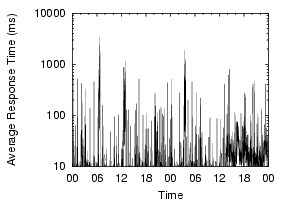
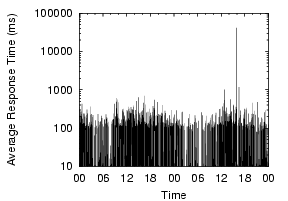
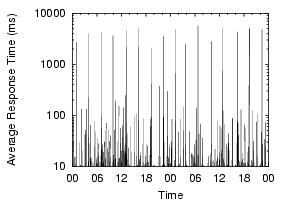
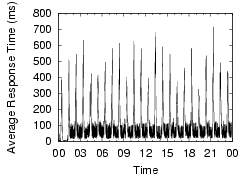
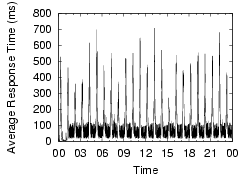
Our measurements show that local DNS lookup times are generally good,but often degrade dramatically, and that this instability is widespread and frequent. To illustrate the widespread nature of the problem and its magnitude, Figure 1 shows the lookup behavior over a two-day period across a number of PlanetLab nodes. Each point shows the per-minute average response time of name lookups. All the nodes in the graph show some sort of problems in DNS lookups during the period, with lookups often taking thousands of milliseconds.
|
These problems are not consistent with simple configuration problems, but appear to be usage-induced or triggered by activity on the nameserver nodes. For example, the Cornell node consistently shows DNS problems, with more than 20% of lookups showing high lookup times of over five seconds, the default timeout in the client's resolver library. These failed lookups are eventually retried at the campus's second nameserver, masking the first nameserver's failures. Since the first nameserver responds to 80% of queries in a timely manner, it is not completely misconfigured. Very often throughout the day, it simply stops responding, driving the per-minute average lookup times close to five seconds. The Harvard node also displays generally bad behavior. While most lookups are fine, a few failed requests every minute substantially increase the per-minute average. The Stanford node's graph shows periodic spikes roughly every three hours. This phenomenon is long-term, and we suspect the nameserver is being affected by heavy cron jobs. The Michigan node shows a 90 minute DNS problem, driving its generally low lookup times to above one second.
Although the average lookup times appear quite high at times, the individual lookups are mostly fast, with a few very slow lookups dominating the averages. Figure 2(a) displays the cumulative distribution function (CDF) of name lookup times over the same two days. With the exception of the Cornell node, 90% of all requests take less than 100ms on all nodes, indicating that caching is effective and that avaerage-case latencies are quite low. Even the Cornell node works well most of the time, with over 80% of lookups are resolved within 6ms.
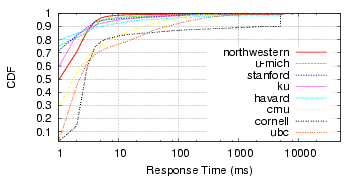 (a) Fraction of Lookups
Taking < Xms
|
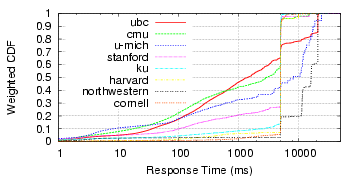 (b) Fraction of the Sum
of Lookups Taking < X ms
|
However, slow lookups dominate the total time spent waiting on DNS, and are large enough to be noticeable by end users. In Figure 2(b), we see the lookups shown by their contribution to the total lookup time, which indicates that a small percentage of failure cases dominates the total time. This weighted CDF shows, for example, that none of the nodes crosses the 0.5 value before 1000ms, indicating that more than 50% of the lookup time is spent on lookups taking more than 1000ms. If we assume that a well-behaving local nameserver can serve cached responses in 100ms, then the figures are even more dramatic. This data, shown in Table 1, shows that slow lookups comprise most of the lookup time.
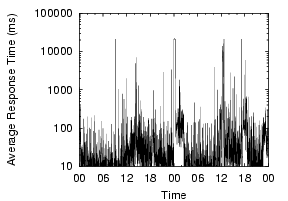
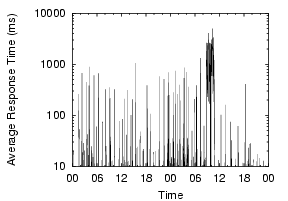
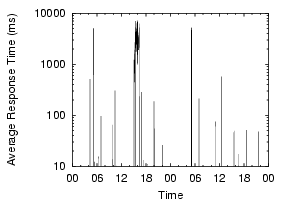
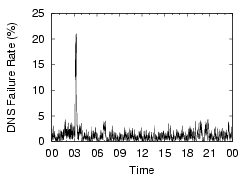
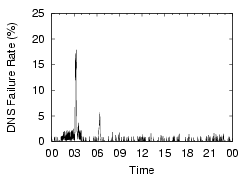
These measurements show that client-side DNS infrastructure problems are significant and need to be addressed. If we can reduce the amount of time spent on these longer cases, particularly in the failures that require the local resolver to retry the request, we can dramatically reduce the total lookup times. Furthermore, given the sharp difference between ``good'' and ``bad'' lookups, we may also be able to ensure a more predictable (and hence less annoying) user experience. Finally, it is worth noting that these problems are not an artifact of PlanetLab - in all cases, we use the site's local nameservers, on which hundreds or thousands of other non-PlanetLab machines depend. The PlanetLab nodes at a site see similar lookup times and failure rates, despite the fact that their other workloads may be very different. Examples from two sites are shown in Figure 3, and we can see that the nodes at a site see similar DNS performance. This observation further enhances our claim that the problems are site-wide, and not PlanetLab-specific.
|