Black-box and Gray-box Strategies for Virtual Machine Migration
Timothy Wood, Prashant Shenoy, Arun Venkataramani, and Mazin Yousif
Univ. of Massachusetts Amherst
Intel, Portland
Virtualization can provide significant benefits in data centers by enabling virtual
machine migration to eliminate hotspots. We present Sandpiper, a system that automates
the task of monitoring and detecting hotspots, determining a new mapping of physical to
virtual resources and initiating the necessary migrations.
Sandpiper implements a black-box approach that is fully OS- and application-agnostic
and a gray-box approach that exploits OS- and application-level statistics.
We implement our techniques in Xen and conduct a detailed evaluation using a mix of
CPU, network and memory-intensive applications. Our results show that Sandpiper
is able to resolve single server hotspots within 20 seconds and scales well to
larger, data center environments.
We also
show that the gray-box approach can help Sandpiper make more informed
decisions, particularly in response to memory pressure.
1 Introduction
Data centers--server farms that run networked applications--have
become popular in a variety of domains such as web hosting, enterprise
systems, and e-commerce sites.
Server resources in a data center are multiplexed across multiple
applications--each server runs one or more applications and
application components may be distributed across multiple servers.
Further, each application sees dynamic workload fluctuations
caused by incremental growth, time-of-day effects, and flash crowds [1].
Since applications need to operate above a certain performance level
specified in terms of a service level agreement (SLA), effective
management of data center resources while meeting SLAs is a complex
task.
One possible approach for reducing management complexity is to employ
virtualization. In this approach, applications run on virtual
servers that are constructed using virtual machines, and one or more
virtual servers are mapped onto each physical server in the system.
Virtualization of data center resources provides numerous benefits. It
enables application isolation since malicious or greedy applications
can not impact other applications co-located on the same physical server.
It enables server consolidation and provides better multiplexing of
data center resources across applications. Perhaps the biggest advantage of
employing virtualization is the ability to flexibly remap physical
resources to virtual servers in order to handle workload dynamics. A
workload increase can be handled by increasing the resources allocated
to a virtual server, if idle resources are available on the physical
server, or by simply migrating the virtual server to a less loaded
physical server. Migration is transparent to the applications and
all modern virtual machines support this
capability [6,15]. However, detecting workload hotspots and initiating a
migration is currently handled manually. Manually-initiated migration
lacks the agility to respond to sudden workload changes;
it is also error-prone since each reshuffle might require
migrations or swaps of multiple virtual servers to rebalance system load.
Migration is further complicated by the need
to consider multiple resources--CPU, network, and memory--for
each application and physical server.
To address this challenge, this paper studies automated black-box and
gray-box strategies for virtual machine migration in large data
centers. Our techniques automate the tasks of monitoring system
resource usage, hotspot detection, determining a new mapping and
initiating the necessary migrations. More importantly, our black-box
techniques can make these decisions by simply observing each virtual
machine from the outside and without any knowledge of the application
resident within each VM. We also present a gray-box approach that
assumes access to a small amount of OS-level statistics in addition to
external observations to better inform the migration algorithm. Since
a black-box approach is more general by virtue of being
OS and application-agnostic, an important aspect of our research is
to understand if a black-box approach alone is sufficient and
effective for hotspot detection and mitigation.
We have designed and implemented the Sandpiper system to support either
black-box, gray-box, or combined techniques.
We seek to identify
specific limitations of the black-box approach and understand how a gray-box approach
can address them.
Sandpiper implements a hotspot detection algorithm that
determines when to migrate virtual machines, and a hotspot
mitigation algorithm that determines what and where to migrate
and how much to allocate after the migration. The hotspot
detection component employs a monitoring and profiling engine that
gathers usage statistics on various virtual and physical servers and
constructs profiles of resource usage. These profiles are used in
conjunction with prediction techniques to detect hotspots in the
system. Upon detection, Sandpiper's migration manager is invoked for
hotspot mitigation. The migration manager employs provisioning
techniques to determine the resource needs of overloaded VMs and uses
a greedy algorithm to determine a sequence of moves or swaps
to migrate overloaded VMs to underloaded servers.
We have implemented our techniques using the Xen virtual machine
[3]. We conduct a detailed experimental evaluation on a
testbed of two dozen servers using a mix of CPU-,
network- and memory-intensive applications. Our results show
that Sandpiper can alleviate single server hotspots in less than 20s
and more complex multi-server hotspots in a few minutes. Our results
show that Sandpiper imposes negligible overheads and that gray-box
statistics enable Sandpiper to make better migration decisions when
alleviating memory hotspots.
The rest of this paper is structured as follows. Section
2 presents some background, and Sections
3-6 present our design of
Sandpiper. Section 7 presents our implementation and
evaluation. Finally, Sections 8 and
9 present related work and our conclusions, respectively.
2 Background and System Overview
Existing approaches to dynamic provisioning have either focused on
dynamic replication, where the number of servers allocated to
an application is varied, or dynamic slicing, where the
fraction of a server allocated to an application is varied; none have
considered application migration as an option for dynamic
provisioning, primarily since migration is not a feasible option in
the absence of virtualization. Since migration is transparent to
applications executing within virtual machines, our work considers
this third approach--resource provisioning via dynamic migrations in
virtualized data centers. We present Sandpiper1, a system for automated migration of virtual
servers in a data center to meet application SLAs. Sandpiper assumes
a large cluster of possibly heterogeneous servers. The hardware
configuration of each server--its CPU, network interface, disk and
memory characteristics--is assumed to be known to Sandpiper. Each
physical server (also referred to as a physical machine or PM) runs a
virtual machine monitor and one or more virtual machines. Each
virtual server runs an application or an application component (the
terms virtual servers and virtual machine are used interchangeably).
Sandpiper currently uses Xen to implement such an architecture. Each
virtual server is assumed to be allocated a certain slice of the
physical server resources.
In the
case of CPU, this is achieved by assigning a weight to the virtual
server and the underlying Xen CPU scheduler allocates CPU bandwidth in
proportion to the weight. In case of the network interface, Xen is yet to
implement a similar fair-share scheduler; a best-effort FIFO scheduler is currently
used and Sandpiper is designed to work with this constraint.
In case of memory, a slice is assigned by allocating a certain amount of RAM to
each resident VM. All storage is assumed to be on a network file
system or a storage area network, thereby
eliminating the need to move disk state during VM migrations [6].
Figure 1:
The Sandpiper architecture.
![\includegraphics[height=1.75in]{charts/sysdiagram}](img5.png) |
Sandpiper runs a component called the nucleus on each physical
server; the nucleus runs inside a special virtual server (domain 0 in Xen)
and is responsible for gathering resource usage statistics on that
server (see Figure 1). It employs a monitoring engine that gathers processor, network
interface and memory swap statistics for each virtual server. For
gray-box approaches, it implements a daemon within each virtual server
to gather OS-level statistics and perhaps application logs.
The nuclei periodically relay these statistics to the Sandpiper
control plane. The control plane runs on a distinguished
node and implements much of the intelligence in Sandpiper. It
comprises three components: a profiling engine, a hotspot detector and
a migration manager (see Figure 1). The profiling engine uses the statistics from
the nuclei to construct resource usage profiles for each
virtual server and aggregate profiles for each physical server.
The hotspot detector continuously monitors these usage profiles
to detect hotspots --informally, a hotspot is
said to have occurred if the aggregate usage of any resource
(processor, network or memory) exceeds a threshold or if SLA violations occur for a ``sustained''
period. Thus, the hotspot detection component determines when to
signal the need for migrations and invokes the migration manager upon
hotspot detection, which attempts hotspot mitigation via dynamic migrations. It implements
algorithms that determine what virtual servers to migrate from
the overloaded servers, where to move them, and how much
of a resource to allocate the virtual servers once the migration is
complete (i.e., determine a new resource allocation to meet the target
SLAs). The migration manager assumes that the virtual machine monitor
implements a migration mechanism that is transparent to applications
and uses this mechanism to automate migration decisions; Sandpiper
currently uses Xen's migration mechanisms that were presented in [6].
3 Monitoring and Profiling in Sandpiper
This section discusses online monitoring and profile generation
in Sandpiper.
The monitoring engine is responsible for tracking the processor, network
and memory usage of each virtual server. It also tracks the total resource usage
on each physical server by aggregating the usages of resident VMs.
The monitoring engine tracks the usage of each resource over a measurement
interval  and reports these statistics to the control plane at the end of each
interval.
and reports these statistics to the control plane at the end of each
interval.
In a pure black-box approach, all usages must be inferred solely from
external observations and without relying on OS-level support
inside the VM. Fortunately, much of the required information can be
determined directly from the Xen hypervisor or by monitoring events
within domain-0 of Xen. Domain-0 is a distinguished VM in Xen that is
responsible for I/O processing; domain-0 can host device drivers and act as a
``driver'' domain that processes I/O requests from other domains
[3,9]. As a result, it is possible to track network and disk I/O
activity of various VMs by observing the driver activity
in domain-0 [9]. Similarly, since CPU scheduling is implemented in
the Xen hypervisor, the CPU usage of various VMs can be
determined by tracking scheduling events in the hypervisor [10].
Thus, black-box monitoring can be implemented
in the nucleus by tracking various domain-0 events and without modifying any virtual server.
Next, we discuss CPU, network and memory monitoring using this approach.
CPU Monitoring: By instrumenting the Xen hypervisor, it is possible to
provide domain-0 with access to CPU scheduling events which
indicate when a VM is scheduled and
when it relinquishes the CPU. These events are tracked to determine the duration for
which each virtual machine is scheduled within each measurement interval
.
The Xen 3.0 distribution includes a monitoring application called XenMon [10] that
tracks the CPU usages of the resident virtual machines using this approach;
for simplicity, the monitoring engine employs a modified version of XenMon to gather CPU usages
of resident VMs over a configurable measurement interval
.
It is important to realize that these statistics do not capture the
CPU overhead incurred for processing disk and network I/O requests;
since Xen uses domain-0 to process disk and network I/O
requests on behalf of other virtual machines, this processing
overhead gets charged to the CPU utilization of domain 0. To properly
account for this request processing ovehead, analogous to proper
accounting of interrupt processing overhead in OS kernels, we must
apportion the CPU utilization of domain-0 to other virtual machines.
We assume that the monitoring engine and the nucleus impose negligible
overhead and that all of the CPU usage of domain-0 is primarily due to
requests processed on behalf of other VMs. Since domain-0 can also track
I/O request events based on the number of memory page exchanges between domains,
we determine the number of disk and network I/O
requests that are processed for each VM. Each VM is then charged a
fraction of domain-0's usage based on the proportion of the total I/O
requests made by that VM. A more precise approach requiring a modified scheduler
was proposed in [9].
Network Monitoring:
Domain-0 in Xen implements the network interface driver and all other domains
access the driver via clean device abstractions. Xen uses a virtual
firewall-router (VFR) interface; each domain attaches one or more virtual interfaces to
the VFR [3]. Doing so enables Xen to multiplex all its virtual interfaces onto the
underlying physical network interface.
Consequently, the monitoring engine can conveniently monitor each VM's
network usage in Domain-0.
Since each virtual interface looks like a
modern NIC and Xen uses Linux drivers, the
monitoring engines can use the Linux /proc interface (in particular
/proc/net/dev) to monitor the number of
bytes sent and received on each interface. These statistics are
gathered over interval
and returned
to the control plane.
Memory Monitoring: Black-box monitoring of memory is
challenging since Xen allocates a user-specified amount of memory
to each VM and requires the OS within the VM to manage that memory;
as a result, the memory utilization is only known to the OS within each VM. It is possible to
instrument Xen to observe memory accesses within each VM through the
use of shadow page tables, which is used by Xen's migration
mechanism to determine which pages are dirtied during migration.
However, trapping each memory access results in a significant application slowdown and is only
enabled during migrations[6].
Thus, memory usage statistics are not directly available and must be inferred.
The only behavior that is visible externally is swap
activity. Since swap partitions reside on a network disk, I/O
requests to swap partitions need to be processed by domain-0 and can
be tracked. By tracking the reads and writes to each swap partition
from domain-0, it is possible to detect memory pressure within each
VM. The recently proposed Geiger system has shown that such passive
observation of swap activity can be used to infer useful
information about the virtual memory subsystem such as working set
sizes [11].
Our monitoring engine tracks the number of read and write requests to
swap partitions within each measurement interval
and
reports it to the control plane. Since substantial swapping activity
is indicative of memory pressure, our current black-box approach is
limited to reactive decision making and can not be proactive.
Black-box monitoring is useful in scenarios where it is not feasible to
``peek inside'' a VM to gather usage statistics. Hosting
environments, for instance, run third-party applications, and in some
cases, third-party installed OS distributions. Amazon's
Elastic Computing Cloud (EC2) service, for instance, provides a ``barebone''
virtual server where customers can load their own OS images. While OS
instrumentation is not feasible in such environments, there are
environments such as corporate data centers where both the hardware
infrastructure and the applications are owned by the same entity. In
such scenarios, it is feasible to gather OS-level statistics as
well as application logs, which
can potentially enhance the quality of decision making in Sandpiper.
Sandpiper supports gray-box monitoring, when feasible, using a
light-weight monitoring daemon that is installed inside each virtual
server. In Linux, the monitoring daemon uses the /proc
interface to gather OS-level statistics of CPU, network, and memory
usage. The memory usage monitoring, in particular, enables proactive
detection and mitigation of memory hotspots. The monitoring daemon also can
process logs of applications such as web and database servers to
derive statistics such as request rate, request drops and service
times. Direct monitoring of such application-level statistics enables
explicit detection of SLA violations, in contrast to the black-box
approach that uses resource utilizations as a proxy metric for SLA monitoring.
Figure 2:
Profile generation in Sandpiper
|
|
The profiling engine receives periodic reports of
resource usage from each nucleus. It maintains a usage history for each
server, which is then used to compute a profile for each virtual and physical
server. A profile is a compact description of that server's resouce usage over a
sliding time window  .
Three black-box profiles are maintained per virtual server: CPU utilization,
network bandwidth utilization, and swap rate (i.e., page fault rate).
If gray-box monitoring is permitted, four additional profiles are maintained:
memory utilization, service time, request drop rate and incoming request rate.
Similar profiles are also maintained for each physical server, which
indicate the aggregate usage of resident VMs.
.
Three black-box profiles are maintained per virtual server: CPU utilization,
network bandwidth utilization, and swap rate (i.e., page fault rate).
If gray-box monitoring is permitted, four additional profiles are maintained:
memory utilization, service time, request drop rate and incoming request rate.
Similar profiles are also maintained for each physical server, which
indicate the aggregate usage of resident VMs.
Each profile contains a distribution
and a time series. The distribution, also referred to as the distribution profile,
represents the probability distribution of the resource
usage over the window
.
To compute a CPU distribution profile, for instance, a
histogram of observed usages over all intervals
contained
within the window
is computed; normalizing this histogram
yields the desired probability distribution (see Figure 2).
While a distribution profile captures the variations in the resource usage, it does
not capture temporal correlations. For instance, a distribution does
not indicate whether the resource utilization increased or decreased within the window
.
A time-series profile captures these temporal fluctuations and is
is simply a list of all reported observations within the window
.
For instance, the CPU time-series profile is a list
 of the
  reported
utilizations within the window
.
Whereas time-series profiles are used by the hotspot detector to spot
increasing utilization trends, distribution profiles are used by
the migration manager to estimate peak resource requirements and
provision accordingly.
reported
utilizations within the window
.
Whereas time-series profiles are used by the hotspot detector to spot
increasing utilization trends, distribution profiles are used by
the migration manager to estimate peak resource requirements and
provision accordingly.
4 Hotspot Detection
The hotspot detection algorithm is responsible for
signaling a need for VM migration whenever SLA violations are detected
implicitly by the black-box approach or explicitly by the
gray-box approach. Hotspot detection is performed on a per-physical
server basis in the back-box approach--a hot-spot is flagged if the
aggregate CPU or network utilizations on the physical server exceed a
threshold or if the total swap activity exceeds a threshold. In
contrast, explicit SLA violations must be detected on a per-virtual
server basis in the gray-box approach--a hotspot is flagged if the
memory utilization of the VM exceeds a threshold or if the response
time or the request drop rate exceed the SLA-specified values.
To ensure that a small transient spike does not trigger needless
migrations, a hotspot is flagged only if thresholds or SLAs are
exceeded for a sustained time. Given a time-series profile, a
hotspot is flagged if at least
out the  most recent
observations as well as the next predicted value exceed a threshold.
With this constraint, we can filter out transient spikes and avoid needless
migrations. The values of
and
can be chosen to make hotspot
detection aggressive or conservative. For a given
, small values of
cause aggressive hotspot detection, while large values of
imply
a need for more sustained threshold violations and thus a more
conservative approach. Similarly, larger values of
incorporate a
longer history, resulting in a more conservative approach. In the
extreme,
most recent
observations as well as the next predicted value exceed a threshold.
With this constraint, we can filter out transient spikes and avoid needless
migrations. The values of
and
can be chosen to make hotspot
detection aggressive or conservative. For a given
, small values of
cause aggressive hotspot detection, while large values of
imply
a need for more sustained threshold violations and thus a more
conservative approach. Similarly, larger values of
incorporate a
longer history, resulting in a more conservative approach. In the
extreme,  is the most aggressive approach that flags a hostpot
as soon as the threshold is exceeded.
Finally, the threshold itself also determines how aggressively hotspots
are flagged; lower thresholds imply more aggressive migrations at the
expense of lower server utilizations, while higher thresholds imply
higher utilizations with the risk of potentially higher SLA
violations.
is the most aggressive approach that flags a hostpot
as soon as the threshold is exceeded.
Finally, the threshold itself also determines how aggressively hotspots
are flagged; lower thresholds imply more aggressive migrations at the
expense of lower server utilizations, while higher thresholds imply
higher utilizations with the risk of potentially higher SLA
violations.
In addition to requiring
out of
violations, we also
require that the next predicted value exceed the threshold. The
additional requirement ensures that the hotspot is likely to persist
in the future based on current observed trends. Also, predictions
capture rising trends, while preventing declining ones from triggering a
migration.
Sandpiper employs time-series prediction techniques to predict future
values [4]. Specifically, Sandpiper relies on the
auto-regressive family of predictors, where the
-th order
predictor  uses
prior observations in conjunction with
other statistics of the time series to make a prediction. To
illustrate the first-order AR(1) predictor, consider a sequence of
observations:
uses
prior observations in conjunction with
other statistics of the time series to make a prediction. To
illustrate the first-order AR(1) predictor, consider a sequence of
observations:  ,
,  , ...,
  . Given this
time series, we wish to predict the demand in the
. Given this
time series, we wish to predict the demand in the  th
interval.
Then the first-order AR(1) predictor makes a prediction using the previous
value
th
interval.
Then the first-order AR(1) predictor makes a prediction using the previous
value  , the mean of the the time series values
  , and
the parameter
, and
the parameter  which captures
the variations in the time series [4].
The prediction
which captures
the variations in the time series [4].
The prediction
 is
given by:
is
given by:
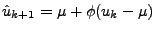 |
(1) |
As new observations arrive from the nuclei, the hot spot detector
updates its predictions and performs the above checks to flag new
hotspots in the system.
5 Resource Provisioning
A hotspot indicates a resource deficit on the underlying physical server to
service the collective workloads of resident VMs.
Before the hotspot can be resolved through migrations, Sandpiper must
first estimate how much additional resources are needed by the
overloaded VMs to fulfill their SLAs; these estimates are then used to
locate servers that have sufficient idle resources.
The provisioning component needs to estimate the peak CPU,
network and memory requirement of each overloaded VM; doing so
ensures that the SLAs are not violated even in the
presence of peak workloads.
Estimating peak CPU and network bandwidth needs: Distribution
profiles are used to estimate the peak CPU and network bandwidth needs
of each VM. The tail of the usage distribution represents the peak usage
over the recent past and is used as an estimate of future peak needs.
This is achieved by computing a high percentile (e.g., the  percentile) of the CPU and network bandwidth distribution as an
initial estimate of the peak needs.
percentile) of the CPU and network bandwidth distribution as an
initial estimate of the peak needs.
Since both the CPU scheduler and the network packet scheduler in Xen
are work-conserving, a VM can use more than
its fair share, provided that other VMs are not using their
full allocations. In case of the CPU, for instance, a VM can use a
share that exceeds the share determined by its weight, so long as
other VMs are using less than their weighted share. In such instances,
the tail of the distribution will exceed the guaranteed share and
provide insights into the actual peak needs of the application.
Hence, a high percentile of the distribution is a good first approximation of the
peak needs.
However, if all VMs are using their fair shares, then an overloaded VM
will not be allocated a share that exceeds its guaranteed allocation,
even though its peak needs are higher than the fair share. In such
cases, the observed peak usage (i.e., the tail of the distribution)
will equal its fair-share. In this case, the tail of the
distribution will under-estimate the actual peak need. To
correct for this under-estimate, the provisioning component must scale
the observed peak to better estimate the actual peak. Thus, whenever the CPU
or the network interface on the physical server are close to saturation,
the provisioning component first computes a
high-percentile of the observed distribution and then adds a constant
 to scale up this estimate.
Example Consider two virtual machines that are assigned CPU weights of 1:1 resulting in
a fair share of 50% each. Assume that VM is overloaded and requires 70% of the CPU
to meet its peak needs. If VM
is overloaded and requires 70% of the CPU
to meet its peak needs. If VM is underloaded and only using 20% of the CPU,
then the work-conserving Xen scheduler will allocate 70% to VM
. In this case,
the tail of the observed distribution is a good inddicator of VM
's peak need.
In contrast, if VM
is using its entire fair share of 50%, then VM
will
be allocated exactly its fair share. In this case, the peak observed usage will be
50%, an underestimate of the actual peak need. Since Sandpiper can detect that
the CPU is fully utilized, it will estimate the peak to be
is underloaded and only using 20% of the CPU,
then the work-conserving Xen scheduler will allocate 70% to VM
. In this case,
the tail of the observed distribution is a good inddicator of VM
's peak need.
In contrast, if VM
is using its entire fair share of 50%, then VM
will
be allocated exactly its fair share. In this case, the peak observed usage will be
50%, an underestimate of the actual peak need. Since Sandpiper can detect that
the CPU is fully utilized, it will estimate the peak to be  .
.
The above example illustrates a fundamental limitation of the
black-box approach--it is not possible to estimate the true peak need
when the underlying resource is fully utilized. The scale-up factor
is simply a guess and might end up over- or under-estimating
the true peak.
Estimating peak memory needs: Xen allows a fixed amount of
physical memory to be assigned to each resident VM; this allocation
represents a hard upper-bound that can not be exceeded regardless of
memory demand and regardless of the memory usage in other VMs.
Consequently, our techniques for estimating the peak CPU and network usage
do not apply to memory. The provisioning component uses observed swap
activity to determine if the current memory allocation of the VM
should be increased. If swap activity exceeds the threshold indicating memory
pressure, then the the current allocation is deemed insufficient and is increased
by a constant amount  . Observe that techniques such as Geiger that
attempt to infer working set sizes by observing swap activity [11] can be employed to
obtain a better estimate of memory needs; however, our current prototype uses
the simpler approach of increasing the allocation by a fixed amount
whenever
memory pressure is observed.
. Observe that techniques such as Geiger that
attempt to infer working set sizes by observing swap activity [11] can be employed to
obtain a better estimate of memory needs; however, our current prototype uses
the simpler approach of increasing the allocation by a fixed amount
whenever
memory pressure is observed.
Since the gray-box approach has access to application-level logs, information contained in the logs
can be utilized to estimate the peak resource needs of the application. Unlike the black-box
approach, the peak needs can be estimated even when the resource is fully utilized.
To estimate peak needs, the peak request arrival rate is first
estimated. Since the number of serviced requests as well as the the
number of dropped requests are typically logged, the incoming request
rate is the summation of these two quantities. Given the distribution
profile of the arrival rate, the peak rate is simply a high percentile
of the distribution. Let
 denote the estimated peak
arrival rate for the application.
denote the estimated peak
arrival rate for the application.
Estimating peak CPU needs: An application model is necessary to
estimate the peak CPU needs.
Applications such as web and database servers can be modeled as G/G/1 queuing systems [23].
The behavior of such a G/G/1 queuing system can be captured using the following
queuing theory result [13]:
![$\displaystyle \lambda_{cap} \geq {\left[ s +\frac{\sigma_a^2+\sigma_b^2}{2 \cdot (d-s)}\right]}^{-1}$](img28.png) |
(2) |
where  is the mean response time of requests,
  is the
mean service time, and
is the
mean service time, and
 is the
request arrival rate.
is the
request arrival rate.
 and
and
 are the
variance of inter-arrival time and the variance of service time, respectively.
Note that response time includes the full queueing delay, while service time only
reflects the time spent actively processing a request.
are the
variance of inter-arrival time and the variance of service time, respectively.
Note that response time includes the full queueing delay, while service time only
reflects the time spent actively processing a request.
While the desired response time
is specified by the SLA, the
service time
of requests as well as the variance of inter-arrival
and service times
and
can be determined from
the server logs. By substituting these values into
Equation 2, a lower bound on request rate
that can be serviced by the virtual server is
obtained. Thus,
represents the current capacity of the
VM.
To service the estimated peak workload
, the current CPU capacity needs to be scaled by the
factor
 . Observe that this factor will be greater than 1 if the peak
arrival rate exceeds the currently provisioned capacity. Thus, if the VM is currently assigned a CPU
weight
. Observe that this factor will be greater than 1 if the peak
arrival rate exceeds the currently provisioned capacity. Thus, if the VM is currently assigned a CPU
weight  , its allocated share needs to be scaled up by the factor
to service the peak workload.
, its allocated share needs to be scaled up by the factor
to service the peak workload.
Estimating peak network needs: The peak network bandwidth usage
is simply estimated as the product of the estimated peak arrival rate
and the mean requested file size  ; this is the
amount of data transferred over the network to service the peak
workload. The mean request size can be computed from the server logs.
; this is the
amount of data transferred over the network to service the peak
workload. The mean request size can be computed from the server logs.
6 Hotspot Mitigation
Once a hotspot has been detected and
new allocations have been determined for overloaded VMs,
the migration manager invokes its hotspot mitigation algorithm. This
algorithm determines which virtual servers to migrate and where in order to dissipate the hotspot. Determining a new mapping
of VMs to physical servers that avoids threshold violations is
NP-hard--the multi-dimensional bin packing problem can be
reduced to this problem, where each physical server is a bin with
dimensions corresponding to its resource constraints and each VM is an
object that needs to be packed with size equal to its resource
requirements. Even the problem of determining if a valid packing exists is NP-hard.
Consequently, our hotspot mitigation algorithm resorts to a heuristic
to determine which overloaded VMs to migrate and where such that
migration overhead is minimized. Reducing the migration overhead
(i.e., the amount of data transferred) is important, since
Xen's live migration mechanism works by iteratively copying the memory
image of the VM to the destination while keeping track of which pages
are being dirtied and need to be resent. This requires Xen to
intercept all memory accesses for the migrating domain, which
significantly impacts the performance of the application inside the
VM. By reducing the amount of data copied over the network, Sandpiper
can minimize the total migration time, and thus, the performance
impact on applications. Note that network bandwidth available for
application use is also reduced due to the background copying during
migrations; however, on a gigabit LAN, this impact is small.
Capturing Multi-dimensional Loads:
Once the desired resource allocations have been determined by either our black-box
or gray-box approach, the problem
of finding servers with sufficient idle resource to house overloaded VMs is identical for both.
The migration manager employs a greedy heuristic to determine which VMs need to be migrated.
The basic idea is to move load from the most overloaded servers to the least-overloaded servers, while
attempting to minimize data copying incurred during migration.
Since a VM or a server can be overloaded along one or more of three
dimensions-CPU, network and memory-we define a new metric that
captures the combined CPU-network-memory load of a virtual and
physical server. The volume of a physical or virtual server is
defined as the product of its CPU, network and memory loads:
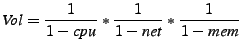 |
(3) |
where  ,
,  and
and  are the corresponding utilizations of
that resource for the virtual or physical server.2 The higher the utilization of a resource,
the greater the volume; if multiple resources are heavily utilized,
the above product results in a correspondingly higher volume.
The volume captures the degree of (over)load along multiple dimensions
in a unified fashion and can be used by the mitigation algorithms to handle
all resource hotspots in an identical manner.
are the corresponding utilizations of
that resource for the virtual or physical server.2 The higher the utilization of a resource,
the greater the volume; if multiple resources are heavily utilized,
the above product results in a correspondingly higher volume.
The volume captures the degree of (over)load along multiple dimensions
in a unified fashion and can be used by the mitigation algorithms to handle
all resource hotspots in an identical manner.
Migration Phase:
To determine which VMs to migrate, the algorithm orders physical
servers in decreasing order of their volumes. Within each
server, VMs are considered in decreasing order of their
volume-to-size ratio (VSR); where  is defined as
 ; size is the memory footprint of the VM. By
considering VMs in VSR order, the algorithm attempts to migrate the
maximum volume (i.e., load) per unit byte moved, which has been shown to minimize
migration overhead [20].
; size is the memory footprint of the VM. By
considering VMs in VSR order, the algorithm attempts to migrate the
maximum volume (i.e., load) per unit byte moved, which has been shown to minimize
migration overhead [20].
The algorithm proceeds by considering the highest VSR virtual machine
from the highest volume server and determines if it can be housed on
the least volume (least loaded) physical server. The move is feasible
only if that server has sufficient idle CPU, network and memory
resources to meet the desired resource allocation of the candidate VM
as determined by the provisioning component
(Section 5).
Since we use VSR to
represent three resource quantities, the least loaded server may not necessarily
``fit'' best with a particular VM's needs. If sufficient resources are not
available, then the algorithm examines the next least loaded server
and so on, until a match is found for the candidate VM.
If no
physical server can house the highest VSR VM, then the algorithm moves
on to the next highest VSR VM and attempts to move it in a similar
fashion. The process repeats until
the utilizations of all resources on the physical server fall
below their thresholds.
The algorithm then considers the next most loaded physical server that is experiencing a hotspot and
repeats the process until there are no physcial servers left with a hotspot. The output of this algorithm
is a list of overloaded VMs and a new destination server for each; the actual migrations are triggered
only after all moves have been determined.
Swap Phase:
In cases where there aren't sufficient idle resources on less loaded
servers to dissipate a hotspot, the migration algorithm considers VM
swaps as an alternative. A swap involves exchanging a high VSR virtual
machine from a loaded server with one or more low VSR VMs from an
underloaded server. Such a swap reduces the overall utilization of
the overloaded server, albeit to a lesser extent than a one-way move
of the VM. Our algorithm considers the highest VSR VM on the highest
volume server with a hotspot; it then considers the lowest volume
server and considers the
lowest VSR VMs such that these VMs
collectively free up sufficient resources to house the overloaded
VM. The swap is considered feasible if the two physical servers have
sufficient resources to house the other server's candidate VM(s) without
violating utilization thresholds. If a swap cannot be found, the
next least loaded server is considered for a possible swap and so on.
The process repeats until sufficient high VSR VMs have
been swapped with less loaded VMs so that the hotspot is dissipated.
Although multi-way swaps involving more than two servers can also be
considered, our algorithm presently does not implement such complex swaps.
The actual migrations to perform the swaps
are triggered only after a list of all swaps is constructed.
Note that a swap may require a third server with ``scratch''
RAM to temporarily house a VM before it moves to its final
destination. An alternative is to (i) suspend one of the VMs on
disk, (ii) use the freed up RAM to accommodate the other VM, and (iii)
resume the first VM on the other server; doing so is not transparent
to the temporarily suspended VM.
7 Implementation and Evaluation
Table:
Workload in requests/second, memory allocations, and initial placement.
|
The implementation of Sandpiper is based on Xen. The Sandpiper control plane is
implemented as a daemon that runs on the control node. It listens for
periodic usage reports from the various nuclei, which are used to
generate profiles. The profiling engine currently uses a history of the
past 200 measurements to generate virtual and physical server
profiles. The hotspot detector uses these profiles to detect hotspots;
currently a hotspot is triggered when 3 out of 5 past readings and the
next predicted value exceeds a threshold. The default threshold is set
to 75%.
The migration manager
implements our provisioning and hotspot mitigation algorithms; it notifies
the nuclei of any desired migrations, which then trigger them.
In all, the control plane consists of less than 750 lines of python code.
The Sandpiper nucleus is a Python application that extends the
XenMon CPU monitor to also acquire network and memory statistics for
each VM. The monitoring engine in the nucleus collects and reports
measurements once every 10 seconds--the default measurement
interval. The nucleus uses Xen's Python management API to
trigger migrations and adjust resource allocations as directed
by the control plane. While black-box monitoring only requires access to
domain-0 events, gray-box monitoring employs two additional components:
a Linux OS daemon and an Apache module.
The gray-box linux daemon runs on each VM that permits gray-box
monitoring. It currently gathers memory statistics via the /proc
interface--the memory utilization, the number of free pages and swap
usage are reported to the monitoring engine in each interval. The
gray-box apache module comprises of a real-time log analyzer and a
dispatcher. The log-analyzer processes log-entries as they are
written to compute statistics such as the service time, request rate,
request drop rate, inter-arrival times, and request/file sizes. The
dispatcher is implemented as a kernel module based on Linux IP Virtual
server (IPVS) ver 1.2.1; the goal of the kernel module is to
accurately estimate the request arrival rate during overload periods,
when a high fraction of requests may be dropped. Since requests can be
dropped at the TCP layer as well as at the HTTP layer during
overloads, the use of a transport-level dispatcher such as IPVS is
necessary for accurately estimating the drop (and hence arrival) rates.
Ordinarily, the kernel dispatcher simply forwards incoming requests to
Apache for processing. In all, the nucleus comprises 650 lines of Python code.
Our evaluation of Sandpiper is based on a prototype data center
consisting of twenty 2.4Ghz Pentium-4 servers connected over gigabit
ethernet. All servers run Linux 2.6.16 and Xen 3.0.2-3 and are
equipped with at least 1GB of RAM. A cluster of Pentium-3 Linux
servers is used to generate workloads for our experiments.
One node in the cluster is designated to run the Sandpiper control plane,
while the rest host one or more VMs, all of which run the Sandpiper nucleus
in domain- 0. In the following experiments, our VMs run Apache 2.0.54, PHP 4.3.10,
and MySQL 4.0.24.
Figure 3:
A series of migrations resolve hotspots. Different shades are used
for each migrating VM.
![\includegraphics[width=2.5in]{graphs/cpu_migs}](img44.png) |
Our first experiment demonstrates the effectiveness of migrations and
swaps by exercising Sandpiper's hotspot detection and migration
algorithms; we subject a set of black-box servers to a series of
workloads that repeatedly place the system in overload. Our
experiment uses three physical servers and five VMs with memory
allocations as shown in Table 1. All VMs
run Apache serving dynamic PHP web pages. The PHP scripts are
designed to be CPU intensive so that a low client request rate places
a large CPU load on a server without significant network or memory
utilization. We use httperf to inject a workload that goes through
three phases, each of which causes a hotspot on a different physical
machine. The peak request rates for each phase are shown in Table
1.
Figure 3 presents a time series of the load placed on
each VM along with the triggered migrations. In the first phase, a
large load is placed on VM
, causing the CPU utilization on
PM
to exceed the CPU threshold. The system detects a hotspot
at t=166 seconds. The migration manager examines candidates for
migration in VSR order.
VM
has the highest VSR, so it is selected as a candidate. Since
PM has sufficient spare capacity to house
VM
, it is migrated there, thereby eliminating the hotspot.
This represents the ideal case for our algorithm: if possible, we try
to migrate the most loaded VM from an overloaded PM to one
with sufficient spare capacity.
has sufficient spare capacity to house
VM
, it is migrated there, thereby eliminating the hotspot.
This represents the ideal case for our algorithm: if possible, we try
to migrate the most loaded VM from an overloaded PM to one
with sufficient spare capacity.
In the second phase, PM
becomes overloaded due to increasing load
on VM
. However, the migration manager is unable to migrate this VM because
there is insufficient capacity on the other PMs. As a result, at
t=362 seconds, the VM on PM
with the second highest VSR VM , is
migrated to PM
that now has spare capacity. This demonstrates a
more typical case where none of the underloaded PMs have sufficient
spare capacity to run the overloaded PM's highest VSR VM, so
instead we migrate less overloaded VMs that can fit elsewhere.
, is
migrated to PM
that now has spare capacity. This demonstrates a
more typical case where none of the underloaded PMs have sufficient
spare capacity to run the overloaded PM's highest VSR VM, so
instead we migrate less overloaded VMs that can fit elsewhere.
In the final phase, PM
becomes overloaded when both of its VMs
receive identical large loads. Unlike the previous two cases where
candidate VMs had identical memory footprints, VM has half as
much RAM as VM
, so it is chosen for migration. By selecting the
VM with a lower footprint, Sandpiper maximizes the reduction in load
per megabyte of data transfered.
has half as
much RAM as VM
, so it is chosen for migration. By selecting the
VM with a lower footprint, Sandpiper maximizes the reduction in load
per megabyte of data transfered.
Result: To eliminate hotspots while minimzing the overhead of
migration, our placement algorithm tries to move the highest VSR VM to the least loaded PM. This maximizes the amount of load
displaced from the hot-spot per megabyte of data transferred.
Next we demonstrate how VM swaps can mitigate hotspots.
The first two VMs in our setup are allocated 384 MB of RAM on PM
; VM
and VM
are assigned 256 MB each on PM
.
The load on VM
steadily increases during the experiment, while the others
are constant.
As before,
clients use httperf to request dynamic PHP pages.
Figure 4 shows that a hotspot is detected on PM
due to the
increasing load on VM
. However, there is insufficient spare capacity on
PM
to support a migrated VM. The only viable solution is to swap VM
with VM
. To facilitate such swaps, Sandpiper uses spare RAM on the control
node as scratch space.
By utilizing this scratch space, Sandpiper never requires either physical server to
simultaneously run both VMs. It does require us to perform
three migrations instead of two; however, Sandpiper reduces the migration cost by always
migrating the smaller footprint VM via the scratch server. As shown in Figure 4,
the load on PM
drops at t=219 due to the migration of VM
to scratch. VM
is
then migrated directly from PM
to PM
at t=233, followed by a migration
of VM
from scratch to PM
, which takes an additional 10s.
The figure also depicts the CPU overhead of a migration--as indicated
by a rise in CPU utilization of the initiating server whenever a
migration begins. This suggests using lower CPU hotspot thresholds
to safely absorb the additional overheads caused by a
migration.
Result: Swaps incur more overhead, but increase the chances of mitigating
hotspots in clusters with high average utilization.
Sandpiper can consolidate applications that stress different resources to improve the overall
multiplexing of server resources. Our setup comprises two servers with two VMs each.
Both VMs on the first server are network-intensive, involving large file transfers, while those
on the second server are CPU-intensive running Apache with dynamic PHP scripts.
All VMs are initially allocated 256 MB of memory. VM
additionally runs a main-memory
database that stores its tables in memory, causing its memory usage to grow over time.
Figures 5(a) and (b) show the resource
utilization of each PM over time. Since PM
has a network hotspot
and PM
has a CPU hotspot, Sandpiper swaps a network-intensive VM for
a CPU-intensive VM at t=130. This results in a lower CPU and network utilization
on both servers. Figure 5(d) shows the initial utilizations of
each VM; after the swap, the aggregate CPU and network utilizations on both servers
falls below 50%.
In the latter half, memory pressure increases on VM
due to its
main-memory database application. As shown in 5(c),
Sandpiper responds by increasing the RAM allocation in steps of 32MB
every time swapping is observed; when no additional RAM is available, the VM
is swapped to the second physical server at t=430. This is feasible because two
cpu-intensive jobs are swapped, leaving CPU and network utilization balanced, and the second physical
server has more RAM than the first. Memory allocations are reactive since only
black-box stats are available. Next we
demonstrate how a gray-box approach can proactively respond to
memory pressure.
Result: Sandpiper can respond to network, CPU, or memory
hotspots and can collocate VMs that stress different resources
to improve overall system utilization.
Figure 6:
The black-box system lags behind the gray-box system in allocating memory.
With its detailed memory statistics, the gray-box approach is proactive and
increases memory without waiting until swapping occurs.
![\includegraphics[width=1.55in]{graphs/bVg_mem}](img50.png) |
![\includegraphics[width=1.55in]{graphs/bVg_swap}](img51.png) |
| (a) |
(b)
|
|
We compare the effectiveness of the black- and gray-box approaches in
mitigating memory hotspots using the SPECjbb 2005 benchmark.
SPECjbb emulates a three-tier web application based on
J2EE servers. We use SPECjbb to apply an increasingly intense
workload to a single VM. The workload increases every two minutes,
causing a significant increase in memory usage.
The VM is initially assigned 256MB of RAM, and resides on a physical
machine with 384 MB total RAM. We also run a second, idle physical server
which has 1GB RAM. We run the experiment with
two separate pairs of servers, Black and Gray, that correspond to the black- and gray-box
approaches, respectively. The Gray system is configured to signal a hotspot
whever the amount of free RAM in the virtual machine falls below 32MB.
Fig. 6(a) plots the memory allocation of the
VM over time. Both systems gradually
increase the VM's memory until all unused RAM is exhausted.
Since Black can only respond to swapping, it lags in responsiveness.
At t=380 seconds, Gray determines that there is insufficient RAM for
the VM and migrates it to the second PM with 1GB RAM; Black
initiates the same migration shortly afterward. Both continue to
increase the VM's memory as the load rises. Throughout the
experiment, Black writes a total of 32MB to swap, while Gray only
writes 2MB. Note that a lower memory hotspot threshold in Gray
can prevent swapping altogether, while Black can not eliminate swapping due to
its reactive nature.
Result: A key weakness of the black-box approach is its inability
to infer memory usage. Using this
information, the gray-box system can reduce or eliminate swapping without significant
overprovisioning of memory.
Figure 7:
The black-box system incorrectly guesses resource requirements since
CPU usage is saturated, resulting in an increased resolution time. The gray-box
system infers usage requirements and transitions directly from a) to d).
![\includegraphics[width=2.1in]{charts/bvg}](img52.png) |
Figure 8:
The gray-box system balances the system more quickly due to more
informed decision making. The black-box system must perform migrations
sequentially and incurs an additional migration.
![\includegraphics[width=1.55in]{graphs/bg_resp}](img53.png) |
![\includegraphics[width=1.55in]{graphs/bg_net}](img54.png) |
| (a) |
(b)
|
|
Next, we compare the effectiveness of black- and gray-box approaches
in provisioning resources for overloaded VMs. Recall from Section 5 that
when resources are fully utilized, they hamper the black-box
approach from accurately determining the needs of overloaded
VMs. Our experiment demonstrates how a black-box approach may incur
extra migrations to mitigate a hotspot, whereas a
gray-box approach can use application-level knowledge for faster
hotspot mitigation.
Our experiment employs three physical servers and four VMs.
Initially, VM
through VM
reside on PM
, VM
resides on
PM
, and PM
is idle. We use httperf to generate requests for CPU
intensive PHP scripts on all VMs. At t=80s, we rapidly increase
the request rates on VM
and VM
so that actual CPU requirement for
each virtual machine reaches 70%. The request rates for VM
and
VM
remain constant, requiring 33% and 7% CPU respectively. This
creates an extreme hotspot on PM
. We configure Sandpiper with an
aggressive 6 second measurement interval so that it can respond quickly to
the increase in workload.
Without accurate estimates of each virtual machine's resource requirements,
the black-box system falters in its decision making as indicated in Figure
7. Since the CPU on PM
is saturated, each virtual
machine receives an equal portion of processing time and appears equivalent to
Sandpiper. Sandpiper must select a VM at random, and in the worst case,
tries to eliminate the hotspot by migrating VM
to PM
.
Since VM
and VM
continue to reside on PM
, the hotspot persists even
after the first migration. Next, the black-box approach assumes that
VM
requires only 50% of the CPU and migrates it
to PM
. Unfortunately, this results in PM
becoming overloaded, so a
final migration must be performed to move VM
to PM
.
We repeat this scenario with the Apache gray-box module running inside of each
virtual machine. Since the gray-box monitor can precisely measure the incoming request
rates, Sandpiper can accurately estimate the CPU needs of VM
and VM
.
By using this information, Sandpiper is able to
efficiently respond to the hotspot by immediately migrating VM
to
PM
and VM
to PM
. Figure 8 depicts the improved
performance of the gray-box approach. Note that since Sandpiper requires the hotspot
to persist for
out of
intervals before it acts, it is not until  s that
either system considers itself overloaded. Once a hotspot is flagged, the gray-box approach
can mitigate it within 40 seconds with just two migrations, while the black-box approach
requires 110 seconds and three migrations to do so. Although response time increases equally
under both systems, the gray-box approach is able to reduce response times to
an acceptable level 61% faster than the black-box system, producing a
corresponding reduction in SLA violations.
s that
either system considers itself overloaded. Once a hotspot is flagged, the gray-box approach
can mitigate it within 40 seconds with just two migrations, while the black-box approach
requires 110 seconds and three migrations to do so. Although response time increases equally
under both systems, the gray-box approach is able to reduce response times to
an acceptable level 61% faster than the black-box system, producing a
corresponding reduction in SLA violations.
Result: Application-level statistics enable the gray-box
approach to better infer resource needs and improves the quality of migration
decisions, especially in scenarios where resource demands exceed server capacity.
Figure 9:
Sandpiper eliminates all hotspots and reduces
the number of intervals experiencing sustained overload by 61% .
|
Next we conduct an experiment to
demonstrate how Sandpiper performs under realistic
data center conditions. We deployed a prototype data center on
a cluster of 16 servers that run a total of 35 VMs.
An additional node runs the control plane and one node is
reserved as a scratch node for swaps. The virtual machines run a mix of
data center applications ranging from Apache and
streaming servers to LAMP servers running Apache, PHP, and MySQL
within a single VM. We run RUBiS on our LAMP servers--RUBiS is an open-source multi-tier web
application that implements an eBay-like auction web site and includes
a workload generator that emulates users browsing and bidding on items.
Of the 35 deployed VMs, 5 run the RUBiS
application, 5 run streaming servers, 5 run Apache serving CPU-intensive PHP scripts,
2 run main memory database applications, and
the remaining 15 serve a mix of PHP scripts and large HTML files. We
use the provided workload generators for the RUBiS applications and use
httperf to generate requests for the other servers.
To demonstrate Sandpiper's ability to handle complex hotspot
scenarios, we orchestrate a workload that causes multiple network and
CPU hotspots on several servers. Our workloads causes six physical
servers running a total of 14 VMs to be overloaded--four servers see a
CPU hotspot and two see a network hotspot. Of the remaining
PMs, 4 are moderately loaded (greater than 45% utilization for at
least one resource) and 6 have lighter loads of between 25 and 40%
utilization. We compare Sandpiper to a statically allocated system with no migrations.
Figure 9 demonstrates that Sandpiper eliminates hotspots
on all six servers by interval 60.
These hotspots persist in the static system until the workload changes
or a system administrator triggers manual migrations. Due to Xen's
migration overhead, there are brief periods where Sandpiper causes
more physical servers to be overloaded than in the static case.
Despite this artifact, even during periods where migrations are in progress,
Sandpiper reduces the number of intervals spent
in sustained overload by 61%. In all, Sandpiper performs seven
migrations and two swaps to eliminate all hotspots over a period of
237 seconds after hotspot detection.
Result: Sandpiper is capable of detecting and eliminating simultaneous
hotspots along multiple resource dimensions. Despite
Xen's migration overhead, the number of servers experiencing overload is decreased
even while migrations are in progress.
Figure 10:
Sandpiper overhead and scalability
|
|
![\includegraphics[width=1.5in]{graphs/placer_scale}](img58.png)
(b)
|
|
|
|
Sandpiper's CPU and network overhead is dependent on
the number of PMs and VMs in the data center. With only black-box VMs,
the type of application running in the VM has no effect on
Sandpiper's overhead. If gray-box modules are in use, the overhead
may vary depending on the size of application-level statistics gathered.
Nucleus Overheads: Sandpiper's usage reports are sent from each nucleus to
the Control Plane every measurement interval (10 seconds by default). The table
in Figure 10(a) gives a breakdown of overhead for each report type.
Since each report uses only 288 bytes per VM, the resulting overhead on a gigabit LAN
is negligible. To evaluate the CPU overhead, we compare the performance of a
CPU benchmark with and without our resource monitors running.
Even on a single physical server running 24 concurrent VMs, our monitoring overheads
reduce the CPU benchmark by approximately one percent.
This is comparable to the overheads
reported by XenMon, which much of our code is based on [10]. We also
compare the performance of an Apache server with and without our
monitoring software and find no significant difference in response
time or attainable throughput between the two scenarios.
Control Plane Scalability: The main source of computational
complexity in the control plane is the computation of a new mapping of
virtual machines to physical servers after detecting a hotspot.
Although the problem is NP-hard, we only require an approximate
solution, and our heuristics make the problem tractable for reasonable
system sizes. For data centers with up to 500 virtual servers, the
algorithm completes in less than five seconds as shown in Figure
10(b). For very large data centers with thousands of
virtual machines, the computation could be split up accross multiple
nodes, or the center's servers can be broken up into pools, each
controlled independently by its own control plane.
Result: Our measurement system has insignificant CPU and I/O
requirements and has a negligible impact on performance. The
computation time of our placement algorithm is the main limit on
scalability, but the computations can be distributed if necessary.
Figure 11:
(a) Using time series predictions (the dotted lines) allows Sandpiper to better select migration destinations, improving stability. (b) Higher levels of overload requires more migrations until there is no feasible solution.
![\includegraphics[width=1.62in]{graphs/stability}](img59.png) |
![\includegraphics[width=1.3in]{graphs/extreme}](img60.png) |
| (a) |
(b)
|
|
This section demonstrates how Sandpiper ensures stable system behavior
by avoiding ``thrashing'' migrations. First, Sandpiper avoids migrations
to physical machines with rising loads, since this can trigger
additional migrations if the load rises beyond the threshold;
time-series predictions are used to determine future load trends when
selecting a physical server.
Thus, Figure 11(a) shows
that when a migration decision is required at t=140 sec, Sandpiper
will prefer  over
over  as a target. Even though
has
a higher current load, the 120 second prediction window indicates a rising load
on
.
as a target. Even though
has
a higher current load, the 120 second prediction window indicates a rising load
on
.
Next, we demonstrate Sandpiper's behavior in the presence of
increasing number of hotspots. We simulate a data center with fifty
physical servers, each with three virtual servers. We increase the
number of simultaneous hotspots from 20 to 45; the mean utilizations
are set to 85% and 45% for servers with and without hotspots. Figure
11(b) depicts the mean number of migrations performed to
resolve these hotspots over multiple runs. If fewer than half of
the servers are overloaded, then all hotspots can typically be
resolved with one migration per overloaded server. After this threshold, swaps
are required and it is increasingly difficult to fully resolve overload until it
becomes infeasible. With 35 overloaded servers, Sandpiper was able to eliminate
all hotspots 73% of the time (over multiple runs); with 40 overloaded
servers, a complete solution was found only 3% of the time. In the
extreme case, Sandpiper is still able to resolve 22 of the 45
hotspots before giving up. In all cases, Sandpiper first finds a solution before
initiating migrations or swaps; when no feasible solutions are found,
Sandpiper either implements a partial solution or gives up entirely
rather than attempting wasteful migrations.
This bounds the number of migrations which will ever be performed and
explains the decrease in migrations beyond 40 overloaded servers, where there is
no feasible solution.
Sandpiper has several parameters which the system administrator can tune to
make hotspot detection and mitigation more or less aggressive. Our experiments
suggest the following rules of thumb:
Setting Thresholds: If overload thresholds are set too high,
then the additional overhead during migration can cause additional SLA
violations.
Our experiments show that the average throughput of a CPU-intensive Apache
server can drop by more than 50% during a migration.
We suggest a CPU
threshold of 75% to absorb the CPU overhead of migration while
maximizing server utilization. We also suggest a 75% threshold for
network utilization based on experiments in [6] which
indicate that the network throughput of a highly loaded server can
drop by about 20% during portions of a migration (due to network
copying overheads).
Sustained Overload Requirement: Our experiments (not reported
here) reveal that Sandpiper is not sensitive to a particular choice of
the measurement interval
so long as it is between a few
seconds and a few tens of seconds. For a measurement interval of 10s,
we suggest  and
and  for the ``k out of n'' check; this
corresponds to requiring the time period of about 3 migrations to
exceed the resource threshold before we initiate a migration.
The
paramter is used in the black-box system to increase resource
allocations when utilization is saturated. This
should be set equal to the maximum increase in resource requirements
that a service is likely to see during a measurement interval and may
vary based on workload; we use 10% in our experiments.
Using more advanced time series forecasting techniques would allow
Sandpiper to dynamically determine
.
for the ``k out of n'' check; this
corresponds to requiring the time period of about 3 migrations to
exceed the resource threshold before we initiate a migration.
The
paramter is used in the black-box system to increase resource
allocations when utilization is saturated. This
should be set equal to the maximum increase in resource requirements
that a service is likely to see during a measurement interval and may
vary based on workload; we use 10% in our experiments.
Using more advanced time series forecasting techniques would allow
Sandpiper to dynamically determine
.
8 Related Work
Our work draws upon recent advances in virtual machines and dynamic
provisioning in data centers to address a question of increasing
research and commercial interest: can virtual machine migration enable
robust and highly responsive provisioning in data centers?
The Xen migration
work [6]
alludes to this motivation. What is
missing is a convincing validation and algorithms to effect migration,
which is the focus of this paper.
The idea of process migration was first investigated in the 80's [22].
Support for migrating groups of processes
across OSes was presented in [16],
but applications had to be suspended and it
did not address the problem of maintaining open network connections.
Virtualization support for commodity operating systems in [7] led
towards techniques for virtual machine migration over long
time spans, suitable for WAN migration [19]. More recently,
Xen [6] and VMWare [15] have implemented
``live'' migration of VMs that involve extremely short
downtimes ranging from tens of milliseconds to a second.
VM migration has been used for dynamic resource allocation in
Grid environments [18,21,8].
A system employing automated VM migrations for scientific
nano-technology workloads on federated grid environments was investigated
in [18].
The Shirako system provides infrastructure for leasing resources within a
federated cluster environment and was extended to use virtual machines for
more flexible resource allocation in [8]. Shirako uses
migrations to enable dynamic placement decisions in response
to resource broker and cluster provider policies. In contrast, we focus on
data center environments with stringent SLA requirements that
necessitate highly responsive migration algorithms for online load balancing.
VMware's
Distributed Resource Scheduler [24] uses migration to perform
automated load balancing in response to CPU and memory pressure. DRS uses a
userspace application to monitor memory usage similar to Sandpiper's gray box
monitor, but unlike Sandpiper, it cannot utilize application logs to respond
directly to potential SLA violations or to improve placement decisions.
Dedicated hosting is a category of dynamic provisioning
in which each physical machine runs at most one
application and workload increases
are handled by spawning a new replica of the application on idle
servers.
Physical server granularity provisioning has been investigated in
[1,17].
Techniques for modeling and provisioning multi-tier Web
services by allocating physical machines to each tier
are presented in [23].
Although dedicated hosting provides complete isolation, the cost is
reduced responsiveness - without virtualization, moving from one physical
machine to another takes on the order of several
minutes [23] making it unsuitable for handling flash crowds.
Our current implementation does not replicate virtual machines,
implicitly assuming that PMs are sufficiently provisioned.
Shared hosting is the second variety of dynamic provisioning,
and allows a single physical machine to be shared across
multiple services.
Various economic and resource models to allocate shared resources have been
presented in [5]. Mechanisms to partition and share
resources across services include [2,5].
A dynamic provisioning
algorithm to allocate CPU shares to VMs on a single physical machine
(as opposed to a cluster) was presented and evaluated through simulations in [14].
In comparison to the
above systems, our work assumes a shared hosting platform and uses VMs
to partition CPU, memory, and network resources, but additionally
leverages VM migration to meet SLA objectives.
Estimating the resources needed to meet an appliction's SLA requires a
model that inspects the request arrival rates for the application and
infers its CPU, memory, and network bandwidth needs. Developing such
models is not the focus of this work and has been addressed by several
previous efforts
such as [12,1].
9 Conclusions And Future Work
This paper argued that virtualization provides significant benefits in
data centers by enabling virtual machine migration to eliminate
hotspots.
We presented Sandpiper, a system that automates the task of
monitoring and detecting hotspots, determining a new mapping of
physical to virtual resources and initiating the necessary
migrations in a virtualized data center.
We discussed a black-box strategy that is fully OS- and
application-agnostic as well as a gray-box approach that can exploit
OS- and application-level statistics.
An evaluation of our Xen-based prototype showed that VM migration
is a viable technique for rapid hotspot elimination in data center environments.
Using solely black-box methods, Sandpiper is capable of eliminating simultaneous
hotspots involving multiple resources. We found that utilizing
gray-box information can improve the
responsiveness of our system, particularly by allowing for proactive memory
allocations and better inferences about resource requirements.
In future work, we plan to extend Sandpiper to support replicated services by
automatically determining whether to migrate a VM or to spawn a replica in order
to garner more resources.
Acknowledgements: We would like to thank our anonymous reviewers and our
shepherd, Anees Shaikh, for their helpful comments. This research was supported
by NSF grants EEC-0313747, CNS-0323597, CNS-0325868 and a gift from Intel.
- 1
-
K. Appleby, S. Fakhouri, L. Fong, M. Goldszmidt, S. Krishnakumar, D. Pazel,
J. Pershing, and B. Rochwerger.
Oceano - sla-based management of a computing utility.
In Proc. IFIP/IEEE Symposium on Integrated
Management, May 2001.
- 2
-
M. Aron, P. Druschel, and W. Zwaenepoel.
Cluster reserves: A mechanism for resource management in
cluster-based network servers.
In Proc. ACM SIGMETRICS '00.
- 3
-
P. Barham, B. Dragovic, K. Fraser, S. Hand, T. Harris, A. Ho, R. Neugebauer,
I. Pratt, and A. Warfield.
Xen and the art of virtualization.
In Proc. SOSP'03, pages 164-177, October 2003.
- 4
-
G. P. Box, G. M. Jenkins, and G. C. Reinsel.
Time Series Analysis Forecasting and Control Third Edition.
Prentice Hall, 1994.
- 5
-
J. Chase, D. Anderson, P. Thakar, A. Vahdat, and R. Doyle.
Managing energy and server resources in hosting centers.
In Proc. SOSP '01.
- 6
-
C. Clark, K. Fraser, S. Hand, J. G. Hansen, E. Jul, C. Limpach, I. Pratt, and
A. Warfield.
Live migration of virtual machines.
In Proc. NSDI '05, May 2005.
- 7
-
K. Govil, D. Teodosiu, Y. Huang, and M. Rosenblum.
Cellular disco: Resource management using virtual clusters on
shared-memory multiprocessors.
In Proc. SOSP'99, pages 154-169, December
1999.
- 8
-
L. Grit, D. Irwin, A. Yumerefendi, and J. Chase.
Virtual Machine Hosting for Networked Clusters: Building the
Foundations for Autonomic Orchestration.
In Proc. VTDC '06.
- 9
-
D. Gupta, L. Cherkasova, R. Gardner, and A. Vahdat.
Enforcing Performance Isolation Across Virtual Machines in Xen.
In Proc. Middleware '06, October, 2006.
- 10
-
D. Gupta, R. Gardner, and L. Cherkasova.
Xenmon: Qos monitoring and performance profiling tool.
Technical Report HPL-2005-187, HP Labs, 2005.
- 11
-
S. Jones, A. Arpaci-Dusseau, and R. Arpaci-Dusseau.
Geiger: Monitoring the buffer cache in a virtual machine environment.
In Proc. ASPLOS'06, pages 13-23, October 2006.
- 12
-
A. Kamra, V. Misra, and E. Nahum.
Yaksha: A self-tuning controller for managing the performance of
3-tiered web sites.
In Proc. IWQoS '04, June
2004.
- 13
-
L. Kleinrock.
Queueing Systems, Volume 2: Computer Applications.
John Wiley and Sons, Inc., 1976.
- 14
-
D. Menasce and M. Bennani.
Autonomic Virtualized Environments.
In IEEE ICAS 06.
- 15
-
M. Nelson, B. Lim, and G. Hutchins.
Fast Transparent Migration for Virtual Machines.
In Proc. USENIX 2005.
- 16
-
S. Osman, D. Subhraveti, G. Su, and J. Nieh.
The design and implementation of zap: A system for migrating
computing environments,
In Proc. OSDI 2002.
- 17
-
S. Ranjan, J. Rolia, H. Fu, and E. Knightly.
Qos-driven server migration for internet data centers.
In Proc. IWQoS 2002.
- 18
-
P. Ruth, J. Rhee, D. Xu, R. Kennell, and S. Goasguen.
Autonomic Live Adaptation of Virtual Computational Environments in a
Multi-Domain Infrastructure.
In Proc. IEEE ICAC '06.
- 19
-
C. Sapuntzakis, R. Chandra, B. Pfaff, J. Chow, M. Lam,
and M. Rosenblum.
Optimizing the migration of virtual computers.
In Proc. OSDI '02.
- 20
-
V. Sundaram, T. Wood, and P. Shenoy.
Efficient Data Migration in Self-managing Storage Systems.
In Proc. ICAC '06.
- 21
-
A. Sundararaj, A. Gupta, and P. Dinda.
Increasing Application Performance in Virtual Environments through
Run-time Inference and Adaptation.
In Proc. HPDC '05.
- 22
-
M. M. Theimer, K. A. L., and D. R. Cheriton.
Preemptable Remote Execution Facilities for the V-System.
In Proc. SOSP December 1985.
- 23
-
B. Urgaonkar, P. Shenoy, A. Chandra, and P. Goyal.
Dynamic provisioning for multi-tier internet applications.
In Proc. ICAC '05, June 2005.
- 24
-
VMware Dynamic Resource Scheduler.
https://www.vmware.com/products/vi/vc/drs.html.
- ...Sandpiper1
- A
migratory bird.
- ... server.2
- If
a resource is fully utilized, its
utilization is set to
 , rather than one,
to avoid infinite volume servers. Also, since the black-box approach
is oblivious of the precise memory utilization, the value of
is
set to 0.5 in the absence of swapping and to
if memory pressure is
observed; the precise
value of
is used in the gray-box approach.
, rather than one,
to avoid infinite volume servers. Also, since the black-box approach
is oblivious of the precise memory utilization, the value of
is
set to 0.5 in the absence of swapping and to
if memory pressure is
observed; the precise
value of
is used in the gray-box approach.


![\includegraphics[width=2.5in]{charts/prof}](img7.png)
![\includegraphics[width=2.5in]{graphs/swap}](img47.png)
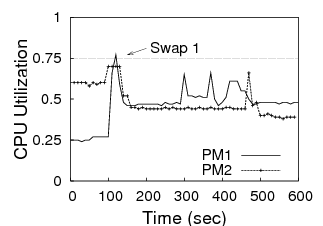
![\includegraphics[width=1.5in]{graphs/nr_net}](img48.png)
![\includegraphics[width=1.55in]{graphs/nr_ram2}](img49.png)
![\includegraphics[width=1.9in]{graphs/dc_series}](img56.png)
![\includegraphics[width=1.15in]{charts/dc_sum}](img57.png)