
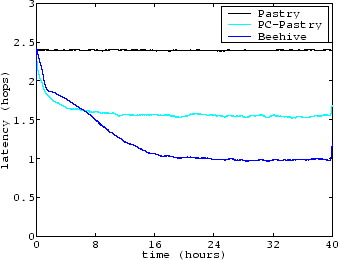
Figure 3 shows the average lookup latency for Pastry, PC-Pastry, and Beehive over a query period spanning 40 hours. We plot the lookup latency as a moving average over 48 minutes. The average lookup latency of pure Pastry is about 2.34 hops. The average lookup latency of PC-Pastry drops steeply during the first 4 hours and averages 1.54 after 40 hours. The average lookup performance of Beehive decreases steadily and converges to about 0.98 hops, within 5% of the target lookup performance. Beehive achieves the target performance in about 16 hours and 48 minutes, the time required for two analysis phases followed by a replication phase at each node. These three phases, combined, enable Beehive to propagate the popular objects to their respective replication levels and achieve the expected payoff. In contrast, PC-Pastry provides limited benefits, despite an infinite-sized cache. There are two reasons for the relative ineffectiveness of passive caching. First, the heavy tail in Zipf-like distributions implies that there will be many objects for which there will be few requests, where queries will take many disjoint paths in the network until they collide on a node on which the object has been cached. Second, PC-Pastry relies on time-to-live values for cache coherency, instead of tracking the location of cached objects. The time-to-live values are set conservatively in order to reflect the worst case scenario under which the record may be updated, as opposed to the expected lifetime of the object. Our survey indicates that 95% of the DNS records have a lifetime of less than one day, whereas fewer than 0.8% of the records change in 24 hours. Consequently, passive caching suffers from a low hit rate as entries are evicted due to conservative values of TTL set by name owners.
 |
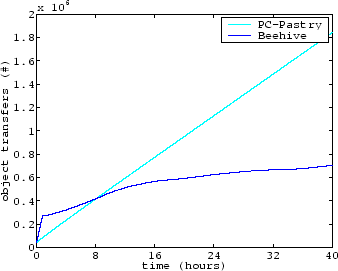 |
Next, we examine the bandwidth consumed and the network load incurred by PC-Pastry and Beehive, and show that Beehive generates significantly lower background traffic due to object transfers compared to passive caching. Figure 4 shows the total amount of objects transferred by Beehive and PC-Pastry since the beginning of the experiment. PC-Pastry has an average object transfer rate proportional to its lookup latency, since it transfers an object to each node along the query path. Beehive incurs a high rate of object transfer during the initial period; but once Beehive achieves its target lookup performance, it incurs considerably lower overhead, as it needs to perform transfers only in response to changes in object popularity and, relatively infrequently for DNS, to object updates. Beehive continues to perform limited amounts of object replication, due to fluctuations in the popularity of the objects as well as estimation errors not dampened down by hysteresis. The rate of object transfers is initially high because the entire system is started at the same time with only one copy of each object. In practice, node-joins and object-inserts would be staggered in time allowing the system to operate smoothly without sudden spikes in bandwidth consumption.
 |
The average number of objects stored at each node at the end of 40 hours is 380 for Beehive and 420 for passive caching. PC-Pastry caches more objects than Beehive even though its lookup performance is worse, due to the heavy tailed nature of Zipf distributions. Beehive requires only 95 objects per node to provide 1.54 hops, the lookup performance achieved by PC-Pastry. Our evaluation shows that Beehive provides 1 hop average lookup latency with low storage and bandwidth overhead.
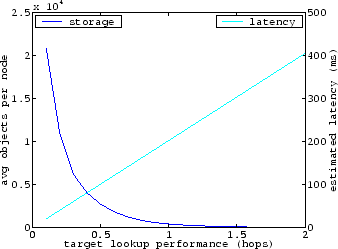
Beehive efficiently trades off storage and bandwidth for improved lookup latency. Our replication framework enables administrators to tune this trade off by varying the target lookup performance of the system. Figure 5 shows the trade off between storage requirement and estimated latency for different target lookup performance. We used the analytical model described in Section 2 to estimate the storage requirements. We estimated the expected lookup latency from round trip time obtained by pinging all pairs of nodes in PlanetLab, and adding to this 0.42 ms for accessing the local DNS resolver. The average 1 hop round trip time between nodes in PlanetLab is 202.2 ms (median 81.9 ms). In our large scale DNS survey, the average DNS lookup latency was 255.9 ms (median 112 ms). Beehive with a target performance of 1 hop can provide better lookup latency than DNS.