|
WiTMeMo '05 Paper
[WiTMeMo '05 Technical Program]
Analysis of a Wi-Fi Hotspot Network
David P. Blinn, Tristan Henderson, David Kotz
Department of Computer Science,
Dartmouth College,
Hanover, NH 03755
Abstract:
Wireless hotspot networks have become increasingly popular in recent
years as a means of providing Internet access in public areas such as
restaurants and airports. In this paper we present the first study of
such a hotspot network. We examine five weeks of SNMP traces from
the Verizon Wi-Fi HotSpot network in Manhattan. We find that far more
cards associated to the network than logged into it. Most clients
used the network infrequently and visited few APs. AP utilization was
uneven and the network displayed some unusual patterns in traffic
load. Some characteristics were similar to those previously observed
in studies of campus WLANs.
1 Introduction
In recent years, deployment of Wireless Local Area Networks (WLANs)
has boomed as demand for wireless Internet access grows and IEEE
802.11 technology matures. 802.11 WLANs can now be found in offices,
homes and campuses. One increasingly-popular use for 802.11 networking
equipment is to provide wireless `hotspots', that is, providing
wireless Internet access in popular public places such as airports,
shops and cafés. An understanding of how these hotspot networks
are used can guide network design, hotspot deployments, and the
development of technologies to be used on WLANs.
In this paper we present one of the first studies of a deployed 802.11
hotspot network. We collected a network activity trace lasting
approximately five weeks from the Verizon Wi-Fi HotSpot network. We
analyze the network in terms of users, Access Points (APs) and
traffic, and compare some of our findings with those for a college
campus wireless network and a corporate wireless network.
In the next section, we review related work. In
Section 3, we describe the study environment and in
Section 4 we describe the tracing methodology.
Section 5 presents the most interesting features of the
data and compares them to results obtained in previous studies of WLAN
usage. In Section 6 we formulate our conclusions.
2 Background and related work
Recent studies have characterized wireless network usage in a variety
of environments. Tang and Baker studied a packet radio network composed
of nearly 25,000 radios distributed across three major metropolitan
areas [10]. Balachandran et al. analyzed WLAN usage
over three days in a conference setting [2].
Kotz and Essien examined a college campus wireless network when it was
first installed in 2001 [7]. Henderson et al. returned
to the same network after it had matured in
2003/2004 [6]. Two other campus WLANs that have
been studied include the University of North
Carolina [4,8] and the
University of Saskatchewan [9], while Balazinska
and Castro analyzed usage of a corporate
WLAN [3].
While hotspots are a popular topic in both the business and research
worlds, we are unaware of any other papers that examined a deployed
hotspot network. Balachandran et al. examined the challenges facing
hotspot networks [1], while Verhoosel
et al. proposed a generic hotspot business model [11].
3 The Study Environment
Network:
The Verizon Wi-Fi HotSpot network (VWHN) consists of 312 APs
distributed around the island of Manhattan.1
APs are installed in the ceilings of Verizon-owned phone booths. Each
AP is a Proxim OriNOCO AP-2500 802.11b AP2,
enclosed within a weatherproof box containing the AP, a DSL modem, a
power regulator, and an external antenna. APs are connected to the
Internet by a 1.5 Mbps downstream and 768 Kbps upstream ADSL
connection. In the weatherproof boxes, the APs have a maximum range of
close to 300 feet but in practice, due to environmental interference,
an AP's effective range is approximately 150 feet.
Although all APs share the same SSID, the VWHN does not support
roaming between APs. When moving from one AP to another within the
network, a user must reauthenticate to obtain Internet access at the
new AP.
Users:
The VWHN is currently provided solely as an amenity service to Verizon
Online (VONL) DSL and dial- up customers. Customers of these services
use their VONL username and password to log on to the network. As of
December 2004, 10,511 unique VONL accounts had been used to log on to
the VWHN.
Test accounts were also distributed to Verizon employees, who
routinely access the network for maintenance purposes. Although 30 to
40 of these accounts exist, fewer than ten were in use during the
study period. Service technicians routinely associate and log into
the network for maintenance purposes. Their usage, however, tended to
skew the distribution of data and so we eliminated their cards from
the study. A company named UDN uses the network to distribute files
to electronic signs installed above subway entrances. Usage for UDN
users was also atypical and their data have been excluded.
Authentication, Authorization, and Accounting:
To obtain Internet access at a Verizon Wi-Fi HotSpot, a user must
first log into Hotwire, a proprietary hotspot management system
developed within Verizon. To log in, a user first associates to the
AP and opens a web browser, which is redirected to a web page
requesting a username and password. Access is granted upon submitting
a valid username and password. Prior to login, an associated user's
Authentication, Authorization, and Accounting (AAA) state is
considered pending at the AP. After login, it is considered
valid. A user may also have an unknown AAA state before
sending any packets to the AP. A user in this state is treated as a
pending user because they have similar access
privileges [5].
A user may log out by clicking on a logout button provided to them at
login or have their session terminated after 15 minutes of inactivity.
In addition, Hotwire automatically logs out users logged on for over
seven hours whether or not they are still sending or receiving data.
4 Methodology
We used the Simple Network Management Protocol (SNMP) to poll APs
every 5 minutes from Nov 15, 2004 to Dec 20, 2004. Polls collected
information on users including MAC address, AAA State, and bytes sent
and received. Once received, messages were time-stamped using the poller's clock. Traffic counts were not
reset by a change in AAA state. A total of 746,397 relevant records
were logged.
A 5 minute interval was used to obtain data frequently without
affecting AP operations. Moreover, entries in the AP-2500's
Current Subscribers table are removed after approximately 10 to 11
minutes of inactivity. A 5 minute poll interval ensures that we
observe most users associating to APs. In the results that follow, we
round down when calculating session lengths -- if a user
t0
is seen at times
t0,
t1,
but not at
t2,
we assume that their session began at
t0
and ended at
t1.
During the study period, 282 of the 312 polled APs responded. The
remaining 30 APs failed to respond because of technical difficulties.
There are four holes in the data caused by crashes in the data
collection process: Nov. 17 to Nov. 19 (41 hours), Nov. 24 to Nov. 29
(118 hours), Dec. 4 to Dec. 5 (43 hours), and Dec. 5 to Dec. 6 (18
hours). In the following results, per-day and per- hour statistics
exclude days and hours for which only partial data is available. To
build the most complete picture of the network possible, however, data
for these incomplete time periods were taken into account when
calculating statistics for the entire trace period. When considering
quantities summed over the period of the trace, note that these
numbers would be higher if the data were complete.
Users were not informed that the study was being performed. To
protect privacy, individual users were not tracked, even though this
may have been possible through tracking VONL accounts. To further
protect privacy, to be consistent with prior similar studies, and
because a VONL account does not necessarily equate with a distinct
user, MAC addresses were treated as corresponding to individuals.
AAA State: The Authentication, Authorization, and Accounting
state of a card at a given AP. A card may have a valid,
pending, or
unknown state. A card has an unknown state before sending any packets
to the AP [5]. Hereafter, we use the term pending to
describe both the pending and unknown states because cards with these
states have similar access privileges and we treated them as the same.
Card: A wireless NIC, identified by MAC address.
Valid Card: A card in a valid AAA state during a
given time period at a given AP. If no period is specified, the
period of the entire trace is implied. Valid cards have unrestricted
access to the Internet at the AP where they are valid.
Pending Card: A card in a pending AAA state during a
given time period at a given AP. Pending cards have Internet access
limited to certain VWHN-related websites. A valid card is not
guaranteed to be seen as pending even though it must have been pending
at some point prior to login. Note that the set of pending cards is
not disjoint from the set of valid cards.
Session: A session begins with the appearance of a card at
an AP in a given AAA state (valid or pending), and ends when the
card is either no longer at the AP or when the card changes AAA state.
Active AP: An active AP is an AP to which one or more cards
are associated (regardless of the cards' AAA state) during a given
time period.
Valid AP: An AP at which one or more associated cards was
seen with a valid AAA state during a given time period.
Pending Traffic: Traffic generated by pending sessions.
Valid Traffic: Traffic generated by valid sessions.
Inbound: Traffic sent by the AP to the card.
Outbound: Traffic sent by the card to the AP.
5 Results
Over the 36-day trace period (which includes 22 complete
days of data), we gathered 746,397 SNMP records. We saw
26,925 total cards, of which 1,682 were valid at one point in the
trace. We summarize our results in a manner that facilitates
comparing the VWHN with WLANs studied in other environments. In
addition, we investigate usage characteristics of the VWHN
that differ from previously studied networks.
For a WLAN such as Verizon's, understanding the user is
critical to building and maintaining a successful network.
Card Activity: Patterns in the number of valid cards for
each day of the study strongly mirror the number
of pending cards on the network for each day of the study
(Figure 1). Some users have multiple sessions in a day,
and so we observe approximately twice as many sessions as cards.
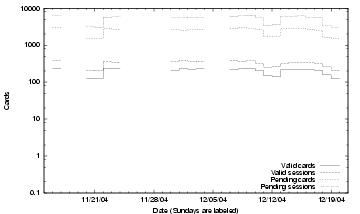
Figure 1: Cards and sessions per day. The cards and
sessions for a day appear just to the right of its tic mark. Blank
spaces represent holes in the data. Sundays are labeled. The
x-axis is on a logscale.
A puzzling question is raised by the small number of valid cards
(1,682) in comparison to total cards (26,925) seen during the trace.
Why did so many cards associate to Verizon APs but not log in (and
attain a valid AAA state)? Perhaps some users are simply curious and
select the VWHN SSID when they see it is an
available network, or perhaps some clients' wireless networking
management utilities chose to automatically associate to the network.
A median of 13% of the valid card population and 10% of the
pending card population appear on any given day. A much larger
portion of the user population appears daily on
college [7,6] and corporate campus
WLANs [3]. It appears that the VWHN is made up
of many of what Balazinska and Castro term ``locations visited
occasionally'' rather than ``primary places of
work'' [3].
More cards are seen during the work-week than during weekends with the
weekly trend for pending cards closely resembling that for valid cards
(although Figure 2 shows both valid and pending
cards on the same plot to save space, both valid and pending cards
follow similar trends).
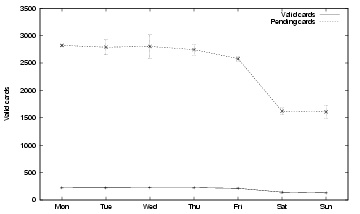
Figure 2:
Active and pending cards per day of the
week. The curve shows the mean and the bars show the standard
deviation.
As with other wireless networks studied, Verizon's network displays a
strong diurnal usage pattern (Figures 4-5).
This is true for both valid and pending cards, though pending cards
show greater variation in number during the busiest hours of the day.
The higher numbers for pending cards during the morning commuting
hours might reflect devices automatically associating as people go to
work but before they begin to use the network. The number of pending
cards on the network late at night is still much larger than the
number of valid cards. This makes it seem unlikely that the large
number of pending cards is a result of curious users. It is hard to
imagine hundreds of curious users attempting to log onto an unfamiliar
network late at night and in the early morning.
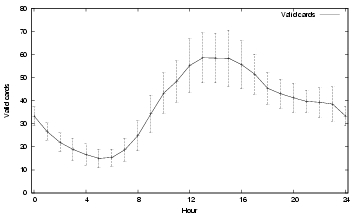
Figure 3:
Active valid cards per hour. The curve shows the
mean and the bars show the standard deviation.
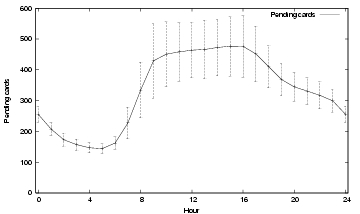
Figure 4:
Active pending cards per hour. The curve shows the
mean and the bars show the standard deviation.
Mobility: A benefit of wireless networking is that it can
enable mobility; users are not tied to a particular location by
network cabling. But the opportunity for mobility does not necessarily
mean that users will move around. Balazinska and
Castro [3] define a user's home
location as the AP at which a user spends more than 50% of his or
her total time on the network. Adopting this definition, 95.72% of
valid users had a home location, and 98.34% of pending users had a
home location.
A Wilcoxon Mann-Whitney test on the distributions of time
spent at the most visited AP across valid and pending cards is
significant at the 1% level: more pending cards spend most of their
time at a single AP than do valid cards.
23.66% of valid users and 26.93% of pending users visited more than
one AP. Of these users that visited more than one AP, 81.91% of
valid users and 93.84% of pending users had home locations.
In terms of home locations, the mobility of users of Verizon's WLAN
more resembles that of users of a college campus
WLAN [6] than that of users of a corporate
WLAN [3]. APs in the Verizon network, however,
are more geographically isolated from the rest of the APs in the
network than APs in a campus WLAN. A card at one AP has to travel a
long distance to reach another. This distance might be a cause of the
high percentage of cards with home locations.
Sessions: The elbows in the distributions of valid and
pending session (Figures 5-6)
reflect the usage drops seen on weekends
(Figure 1).

Figure 5:
Valid sessions per day,
distribution across days. Maximum: 390. Median: 346.

Figure 6:
Pending sessions per day, distribution across days. Maximum:
6468. Median: 5596.
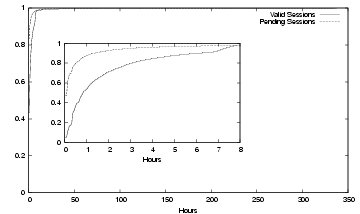
Figure 7:
Session durations in hours,
distribution across sessions. Maximums: 336 hours (valid), 334
hours
(pending). Medians: 49 minutes (valid), 5.6 minutes (pending).
Valid sessions tend to be longer than pending sessions
(Figure 7), with 45.74% of valid
sessions and 12.09% of pending sessions lasting more than one hour.
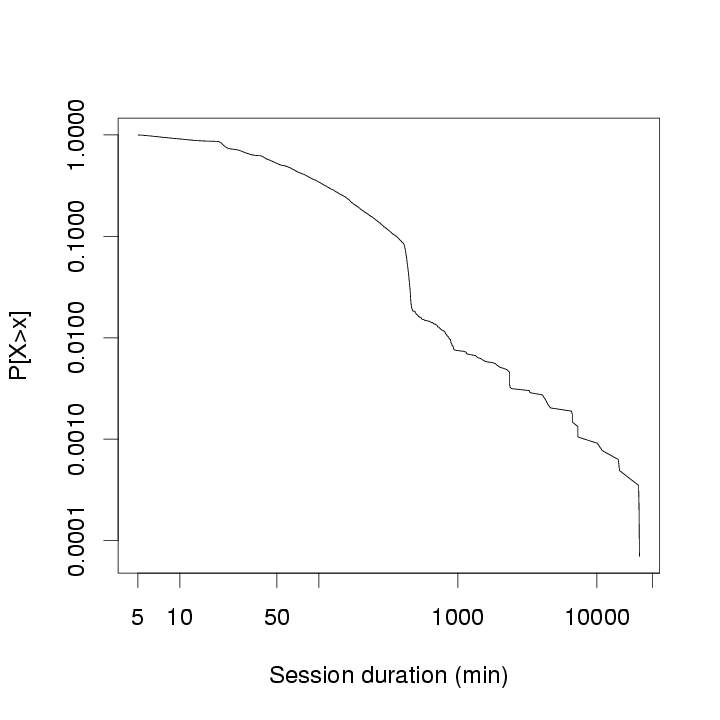
A log-log CCDF of the valid session durations
(Figure 9(a))
indicates that session durations appear
to fit a power law or Pareto distribution. The knee in the valid
session distribution is caused by the fact that users are
automatically logged out after seven hours (a user might appear
to have a session longer than seven hours by quickly logging back in
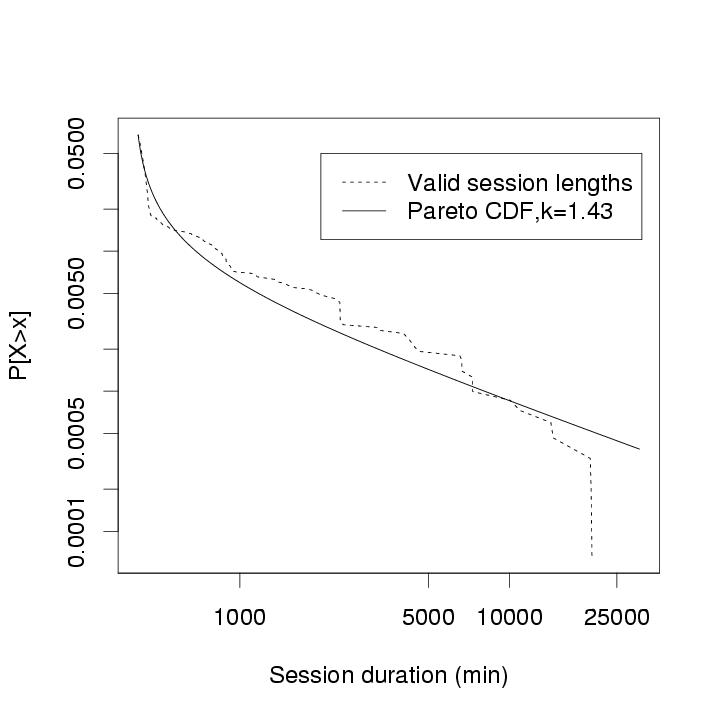
before the next SNMP poll). Considering only those sessions that last
longer than seven hours, maximum likelihood estimation finds that they fit
a Pareto distribution with a shape parameter k = 1.42
(Figure 9(b)).
This is remarkably close to the
session duration distribution observed on a campus
WLAN [8], where a biPareto distribution
is found to fit, with the long tail having a shape parameter of 1.37.
We do not attempt to fit a biPareto distribution to our data, as it is
inaccurate at lower session durations due to the five-minute SNMP poll
period, which means that short sessions are omitted from our
dataset. We also find that pending session durations fit a Pareto
distribution (data not shown here). The presence of these long
sessions may indicate that some users live near enough to APs that
they can stay associated for such a long time.
Figure 8: CCDF of all valid
session durations. The linear trend shows that the data appears to
fit a power law. The knee indicates the 7 hour automatic
logout.
(a): CCDF
of session durations longer than 7 hours. The solid line shows a
fitted Pareto distribution.
(b): Log-log CCDF (Complementary Cumulative
Distribution Function) of valid session durations.
We had 282 APs respond to SNMP polls. We now look in detail at the AP
statistics.
Activity: Examining AP activity over
the course of the trace, some APs see many cards while others see
relatively few (figure not shown).
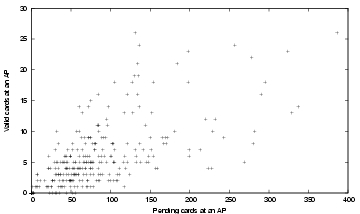
Figure 9:
Scatterplot of pending cards at an AP and valid cards
at an AP.
In testing for linear correlation (Figure 9),
the proportion
of variation in valid cards that is explained by the linear regression
of valid cards on pending cards (r2) is only 0.391. In other
words, a device's association with Verizon's WLAN poorly correlates
with the likelihood of that device actually using the WLAN. Perhaps
this reflects an uneven distribution of VONL customers around the
city. Or it might be that an AP's surroundings play a role in
determining whether or not someone able to take advantage of the
network will do so. For instance, further investigation of the data
shows that the greatest number of pending cards was seen at APs in the
Midtown area, a mostly business district, while valid cards were
heaviest at APs in the Upper West Side, a residential area.
Busiest periods: The hotspot APs were not particularly busy,
even during peak usage periods. The greatest number of simultaneous
valid sessions ever hosted by an AP was 7, whereas the most cards ever
simultaneously associated to an AP was 24. The most valid cards seen
by an AP during a day was 10, and the most pending cards ever seen by
an AP during a day was 106. On the Dartmouth campus, in contrast, the
maximum simultaneous users on one AP is 89, and the maximum cards seen
on an AP in a single day is 405.
Traffic: Most APs see little traffic, but several
see significant amounts (Figure 10).
This pattern is similar to the traffic pattern across APs on a college
campus [7,6] with APs handling traffic
more unevenly than on a corporate WLAN [3].
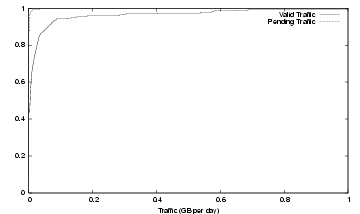
Figure 10:
Average daily traffic (GB),
distribution across APs (CDF truncated at 1GB). Maximums: 1.56 GB
(valid), 36.5 MB (pending); Medians: 4.6 MB (valid), 0.5 MB
(pending).
Over the course of the trace, the network handled 281 GB of total
traffic, of which 196 GB (69.9%) was inbound and 85 GB (30.1%) was
outbound. Pending cards were a minor source of traffic, and so we
discuss them only briefly.
Pending Traffic: Pending traffic was mostly inbound
(83.23%) although there are high outbound loads on some days
(Figure 11). Pending
traffic accounted for only 2.07% of total traffic. But this small
percentage still totaled a median of 0.29 GB each day, which could
become expensive for a hotspot provider who is paying for upstream
bandwidth that is being consumed by non-customers (i.e., pending
cards). Hotwire access logs show that HTTP requests from automated
processes (e.g., Windows Update) being redirected to the Hotwire login
page generated much of the pending traffic.

Figure 11:
Daily pending traffic (GB),
distribution across days. Maximums: (outbound) 0.27, (inbound)
0.53,
(total) 0.80; Medians (outbound) 0.03, (inbound) 0.26, (total)
0.29.
Valid Traffic: Valid traffic accounted for the majority of
traffic, with 275.42 GB of valid traffic seen during the course of the
trace period. Traffic per day varied moderately during days of the
trace (Figure 12). The busiest 5%
of valid cards accounted for 85.52% of total traffic and 95.08% of
outbound traffic. Even on its busiest day (25.50 GB), the network did
not approach the average traffic loads observed on a college campus
network (400 GB) [6].
Considering traffic per user, however, the average daily traffic per
valid card (62.4 MB) approached that of the Dartmouth network (71.2
MB). This is interesting considering that hotspot users are limited by
the capacity of the DSL connections.

Figure 12:
Daily valid traffic (GB),
distribution across days. Maximums: (outbound) 10.15, (inbound)
15.49,
(total) 25.64; Medians (outbound) 2.60, (inbound) 7.06, (total)
9.66.
Examining valid traffic by hour, there are two peaks during the
day: one in the early afternoon and one in the late evening
(Figure 13). This pattern
does not echo the strong diurnal pattern for valid cards shown in
Figure 8.
Though the midday peak corresponds with that in
Figure 8,
the high volume of traffic near midnight (particularly the spikes at
11 PM and 2AM) are striking. The spike at 10 AM is also odd, and was
caused by an outlier: one user at a single AP on a single day.
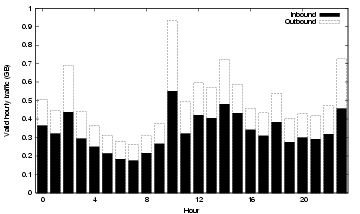
Figure 13:
Average hourly valid traffic (GB) by hour.
6 Conclusions and Future Work
This paper presents the first analysis of a production 802.11 hotspot
network. We examine five weeks of SNMP traces from the Verizon Wi-Fi
HotSpot network in Manhattan. We find that most users access the
network infrequently, but daily, weekly, and hourly trends still
emerge. Far more cards associate to the network than log in, and it
is difficult to explain why.
The vast
majority of cards spend most of their time at a single AP, and few
cards even visit more than one AP.
APs vary widely in their utilization. Most APs were active on any
given day, but fewer saw a login. The number of cards that associated
to an AP is a poor predictor of the number of users that logged in.
Most network traffic was caused by valid sessions and in particular by
fewer than 5% of valid users. Traffic varied across days and
exhibited unusual hourly characteristics.
We intend to look further into similarities between the hotspot
network data and previously-collected campus datasets. Hotspot data is
somewhat harder to obtain than campus WLAN data, and our conclusions
in this study we were limited by the absence of data concerning what
users were actually doing on the network along with the coarse
granularity of SNMP polls. It would be useful to understand what
aspects of a hotspot network can be simulated or modeled using campus
WLAN data.
Acknowledgement
The authors are grateful to Conor Hunt, Sean Byrnes, Paul Perry and
the other members of Paul Perry's team at Verizon who allowed this
study to take place. The authors also thank Mike Leahy of Verizon Data
Services for his help in collecting the data.
- 1
-
A. Balachandran, G. M. Voelker, and P. Bahl.
Wireless hotspots: current challenges and future directions.
In Proceedings of the 1st ACM International workshop on Wireless
Mobile Applications and Services on WLAN Hotspots (WMASH), pages 1-9, Sept.
2003.
- 2
-
A. Balachandran, G. M. Voelker, P. Bahl, and P. V. Rangan.
Characterizing user behavior and network performance in a public
wireless LAN.
In Proceedings of the 2002 ACM SIGMETRICS Conference, pages
195-205, Marina Del Rey, CA, June 2002.
- 3
-
M. Balazinska and P. Castro.
Characterizing Mobility and Network Usage in a Corporate Wireless
Local-Area Network.
In Proceedings of MobiSys 2003, pages 303-316, San Francisco,
CA, May 2003.
- 4
-
F. Chinchilla, M. Lindsey, and M. Papadopouli.
Analysis of wireless information locality and association patterns in
a campus.
In Proceedings of INFOCOM 2004, pages 906-917, Hong Kong,
China, Mar. 2004.
- 5
-
D. Fong.
Nomadix quality assurance test engineer, Dec. 2004.
Personal communication.
- 6
-
T. Henderson, D. Kotz, and I. Abyzov.
The changing usage of a mature campus-wide wireless network.
In Proceedings of MobiCom 2004, pages 187-201, Philadelphia,
PA, Sept. 2004.
- 7
-
D. Kotz and K. Essien.
Analysis of a campus-wide wireless network.
Wireless Networks, 11:115-133, 2005.
- 8
-
M. Papadopouli, H. Shen, and M. Spanakis.
Characterizing the duration and association patterns of wireless
access in a campus.
In 11th European Wireless Conference, Apr. 2005.
- 9
-
D. Schwab and R. Bunt.
Characterising the use of a campus wireless network.
In Proceedings of INFOCOM 2004, pages 862-870, Hong Kong,
China, Mar. 2004.
- 10
-
D. Tang and M. Baker.
Analysis of a metropolitan-area wireless network.
Wireless Networks, 8(2-3):107-120, Mar.-May 2002.
- 11
-
J. Verhoosel, R. Stap, and A. Salden.
A generic business model for WLAN hotspots: a roaming business case
in The Netherlands.
In Proceedings of the 1st ACM International workshop on Wireless
Mobile Applications and Services on WLAN Hotspots (WMASH), pages 85-92,
Sept. 2003.
Analysis of a Wi-Fi Hotspot Network
This document was generated using the
LaTeX2HTML translator Version 2002-2-1 (1.70)
Copyright © 1993, 1994, 1995, 1996,
Nikos Drakos,
Computer Based Learning Unit, University of Leeds.
Copyright © 1997, 1998, 1999,
Ross Moore,
Mathematics Department, Macquarie University, Sydney.
The command line arguments were:
latex2html -split 0 -show_section_numbers -local_icons -noimages -noimages_only -noldump paper.tex
The translation was initiated by Tristan Henderson on 2005-05-10
Footnotes
- ... Manhattan.1
- A full list of
available Verizon Wi-Fi HotSpots organized by region is available
online at
https://www33.verizon.com/wifi/login/locations/locations-remote.jsp
- ... AP2
- Specifications at
https://www.proxim.com/products/wifi/ap/ap2500/
| 