Yu Gu, Andrew McCallum, Don Towsley
Department of Computer Science
University of Massachusetts
We develop a behavior-based anomaly detection method that detects network anomalies by comparing the current network traffic against a baseline distribution. The Maximum Entropy technique provides a flexible and fast approach to estimate the baseline distribution, which also gives the network administrator a multi-dimensional view of the network traffic. By computing a measure related to the relative entropy of the network traffic under observation with respect to the baseline distribution, we are able to distinguish anomalies that change the traffic either abruptly or slowly. In addition, our method provides information revealing the type of the anomaly detected. It requires a constant memory and a computation time proportional to the traffic rate.
Malicious abuses of the Internet are commonly seen in today's Internet traffic. Anomalies such as worms, port scans, denial of service attacks, etc. can be found at any time in the network traffic. These anomalies waste network resources, cause performance degradation of network devices and end hosts, and lead to security issues concerning all Internet users. Thus, accurately detecting such anomalies has become an important problem for the network community to solve.
In this paper, we develop a network anomaly detection technique based on maximum entropy and relative entropy techniques. Our approach exploits the idea of behavior-based anomaly detection. We first divide packets into classes along multiple dimensions. A maximum entropy baseline distribution of the packet classes in the benign traffic is determined by learning a density model from a set of pre-labeled training data. The empirical distribution of the packet classes under observation is then compared to this baseline distribution using relative entropy as the metric. If the two distributions differ, we show that the packet classes primarily responsible for the difference contain packets related to an anomaly.
The maximum entropy approach described in this work exhibits many advantages. First, it provides the administrators a multi-dimensional view of the network traffic by classifying packets according to a set of attributes carried by a packet. Second, it detects anomalies that cause abrupt changes in the network traffic, as well as those that increase traffic slowly. A large deviation from the baseline distribution can only be caused by packets that make up an unusual portion of the traffic. If an anomaly occurs, no matter how slowly it increases its traffic, it can be detected once the relative entropy increases to a certain level. Third, it provides information about the type of the anomaly detected. Our method requires only a constant amount of memory and consists solely of counting the packets in the traffic, without requiring any per flow information.
Our approach divides into two phases. Phase one is to learn the baseline distribution and phase two is to detect anomalies in the observed traffic. In the first phase, we first divide packets into multi-dimensional packet classes according to the packets' protocol information and destination port numbers. These packet classes serve as the domain of the probability space. Then, the baseline distribution of the packet classes is determined by learning a density model from the training data using Maximum Entropy estimation. The training data is a pre-labeled data set with the anomalies labeled by a human and in which packets labeled as anomalous are removed. During the second phase, an observed network traffic trace is given as the input. The relative entropy of the packet classes in the observed traffic trace with respect to the baseline distribution is computed. The packet classes that contribute significantly to the relative entropy are then recorded. If certain packet classes continue to contribute significantly to the relative entropy, anomaly warnings are generated and the corresponding packet classes are reported. This corresponding packet class information reveals the protocols and the destination port numbers related to the anomalies.
We test the approach over a set of real traffic traces. One of them is used as the training set and the others are used as the test data sets. The experimental results show that our approach identifies anomalies in the traffic with low false negatives and low false positives.
The rest of the paper is organized as follows. In Section 2, we review related work. Section 3 describes how we classify the packets in the traffic. In Section 4, we introduce the Maximum Entropy estimation technique. In Section 5, we describe how to detect anomalies in the network traffic based on the baseline distribution. Section 6 gives experimental results and Section 7 discusses the implementation of the algorithm and related practical issues. The last section summarizes the whole paper.
A variety of tools have been developed for the purpose of network anomaly detection. Some detect anomalies by matching the traffic pattern or the packets using a set of predefined rules that describe characteristics of the anomalies. Examples of this include many of the rules or policies used in Snort [12] and Bro [10]. The cost of applying these approaches is proportional to the size of the rule set as well as the complexity of the individual rules, which affects the scalability of these approaches. Furthermore they are not sensitive to anomalies that have not been previously defined. Our work is a behavior based approach and requires little computation.
A number of existing approaches are variations on the change detection method. In [2], Brutlag uses the Holt Winter forecasting model to capture the history of the network traffic variations and to predict the future traffic rate in the form of a confidence band. When the variance of the network traffic continues to fall outside of the confidence band, an alarm is raised. In [1], Barford et al. use wavelet analysis to remove from the traffic the predictable ambient part and then study the variations in the network traffic rate. Network anomalies are detected by applying a threshold to a deviation score computed from the analysis. In [14], Thottan and Ji take management information base (MIB) data collected from routers as time series data and use an auto-regressive process to model the process. Network anomalies are detected by inspecting abrupt changes in the statistics of the data. In [15], Wang et al. take the difference in the number of SYNs and FINs (RSTs) collected within one sampling period as time series data and use a non-parametric Cumulative Sum (CUSUM) method to detect SYN flooding by detecting the change point of the time series. While these methods can detect anomalies that cause unpredicted changes in the network traffic, they may be deceived by attacks that increase their traffic slowly. Our work can detect anomalies regardless of how slowly the traffic is increased and report on the type of the anomaly detected.
There is also research using approaches based on information theory. In [7], Lee and Xiang study several information theoretic measures for intrusion detection. Their study uses entropy and conditional entropy to help data partitioning and setting parameters for existing intrusion detection models. Our work detects network traffic anomalies that cause unusual changes in the network traffic rate or content. In [13], Staniford et al. use information theoretic measures to help detect stealthy port scans. Their feature models are based on maintaining probability tables of feature instances and multi-dimensional tables of conditional probabilities. Our work applies a systematic framework, Maximum Entropy estimation, to estimate the baseline distribution, and our approach is not limited to locating port scans.
Maximum Entropy estimation is a general technique that has been widely used in the fields of machine learning, information retrieval, computer vision, and econometrics, etc. In [11], Pietra et al. present a systematic way to induce features from random fields using Maximum Entropy technique. In [9], McCallum builds, on [11], an efficient approach to induce features of Conditional Random Fields (CRFs). CRFs are undirected graphical models used to calculate the conditional probability of values on designated output nodes given values assigned to other designated input nodes. And in [8], Malouf gives a detailed comparison of several Maximum Entropy parameter estimation algorithms. In our work, we use the L-BFGS algorithm implemented by Malouf to estimate the parameters in the Maximum Entropy model.
In this section, we describe how we divide packets in the network traffic into a set of packet classes. Our work focuses on anomalies concerning TCP and UDP packets. In order to study the distribution of these packets, we divide them into a set of two-dimensional classes according to the protocol information and the destination port number in the packet header. This set of packet classes is the common domain of the probability spaces in this work.
In the first dimension, packets are divided into four classes according to the protocol related information. First, packets are divided into the classes of TCP and UDP packets. Two other classes are further split from the TCP packet class according to whether or not the packets are SYN and RST packets.
In the second dimension, packets are divided into ![]() classes according to
their destination port numbers. Port numbers often determine the services
related to the packet exchange. According to the Internet Assigned Numbers
Authority [6], port numbers are divided into three categories:
Well Known Ports (
classes according to
their destination port numbers. Port numbers often determine the services
related to the packet exchange. According to the Internet Assigned Numbers
Authority [6], port numbers are divided into three categories:
Well Known Ports (![]() ), Registered Ports (
), Registered Ports (
![]() ), and Dynamic and/or Private Ports (
), and Dynamic and/or Private Ports (
![]() ). In our
work, packets with a destination port in the first category are divided into
classes of
). In our
work, packets with a destination port in the first category are divided into
classes of ![]() port numbers each. Since packets with port number
port numbers each. Since packets with port number ![]() comprise
the majority of the network traffic, they are separated into a single class.
This produces
comprise
the majority of the network traffic, they are separated into a single class.
This produces ![]() packet classes. Packets with destination port in the second
category are divided into
packet classes. Packets with destination port in the second
category are divided into ![]() additional classes, with each class covering
additional classes, with each class covering
![]() port numbers with the exception of the class that covers the last
port numbers with the exception of the class that covers the last ![]() port numbers from
port numbers from ![]() to
to ![]() . Packets with destination port numbers
larger than
. Packets with destination port numbers
larger than ![]() are grouped into a single class. Thus, in this dimension,
packets are divided into a total of
are grouped into a single class. Thus, in this dimension,
packets are divided into a total of ![]() classes.
classes.
Altogether, the set of two-dimensional classes consists of
![]() packet classes. These packet classes comprises the
probability space in this paper. We estimate the
distribution of different packets in the benign traffic according
to this classification, and use it as the baseline distribution to
detect network traffic anomalies.
packet classes. These packet classes comprises the
probability space in this paper. We estimate the
distribution of different packets in the benign traffic according
to this classification, and use it as the baseline distribution to
detect network traffic anomalies.
Maximum Entropy estimation is a framework for obtaining a
parametric probability distribution model from the training data
and a set of constraints on the model. Maximum Entropy estimation
produces a model with the most 'uniform' distribution among all
the distributions satisfying the given constraints. A mathematical
metric of the uniformity of a distribution ![]() is its
entropy:
is its
entropy:
Let ![]() be the set of packet classes defined in the previous
section. Given a sequence of packets
be the set of packet classes defined in the previous
section. Given a sequence of packets
![]() as the training data, the empirical
distribution
as the training data, the empirical
distribution ![]() over
over ![]() in this training data is
in this training data is
Suppose we are given a set of feature functions
![]() , and let
, and let ![]() be an indicator function
be an indicator function
![]() . By using Maximum Entropy estimation, we are
looking for a density model
. By using Maximum Entropy estimation, we are
looking for a density model ![]() that satisfies
that satisfies
![]() for all
for all
![]() and has
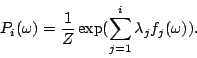
maximum entropy. In [11], it has been proved
that under such constraints, the Maximum Entropy estimate is
guaranteed to be (a) unique, and (b) the same as the maximum
likelihood estimate using the generalized Gibbs distribution,
having the following log-linear form
and has
maximum entropy. In [11], it has been proved
that under such constraints, the Maximum Entropy estimate is
guaranteed to be (a) unique, and (b) the same as the maximum
likelihood estimate using the generalized Gibbs distribution,
having the following log-linear form
For the sake of efficiency, feature functions are often selected to express the most important characteristics of the training data in the learned log-linear model, and in return, the log-linear model expresses the empirical distribution with the fewest feature functions and parameters.
The Maximum Entropy estimation procedure consists of two parts: feature selection and parameter estimation. The feature selection part selects the most important features of the log-linear model, and the parameter estimation part assigns a proper weight to each of the feature functions. These two parts are performed iteratively to reach the final model. In the following, we describe each part in turn. More details can be found in [11].
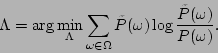
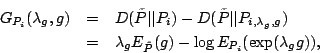
The feature selection step is a greedy algorithm which chooses the best feature function that minimizes the difference between the model distribution and the empirical distribution from a set of candidate feature functions.
Let ![]() be the set of all packet classes,
be the set of all packet classes, ![]() the
empirical distribution of the training data over
the
empirical distribution of the training data over ![]() , and
, and
![]() a set of candidate feature functions. The initial
model distribution over
a set of candidate feature functions. The initial
model distribution over ![]() is
is
![]() ,
,
![]() , which is a uniform distribution over
, which is a uniform distribution over ![]() .
.
Now let ![]() be a model with
be a model with ![]() feature functions selected
feature functions selected
 |
(4) |
| (5) |
| (6) |
In [11], it is also shown that for indicator
candidate feature functions, there are closed form formulas
related to the maxima of
![]() , which makes it
computationally easier. For more details on feature selection,
please refer to [11] and [4].
, which makes it
computationally easier. For more details on feature selection,
please refer to [11] and [4].
After a new feature function is added to the log-linear model, the weights of
all feature functions are updated. Given a set of training data and a set of
selected feature functions ![]() , the set of parameters is then estimated.
Maximum Entropy estimation locates a set of parameters
, the set of parameters is then estimated.
Maximum Entropy estimation locates a set of parameters
![]() in (3) for
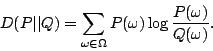
in (3) for ![]() that minimizes the K-L divergence of
that minimizes the K-L divergence of
![]() with respect to
with respect to ![]() :
:
There are a number of numerical methods that can be exploited. In our work, we use the L-BFGS Maximum Entropy estimation algorithm "tao_lmvm" implemented by Malouf in [8].
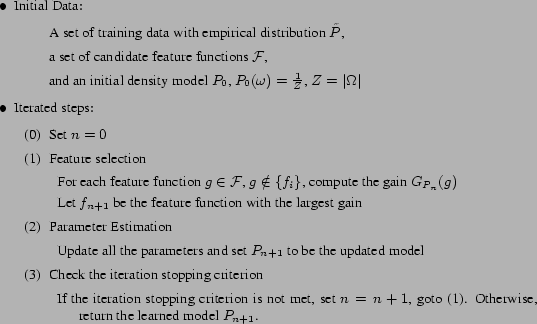
Figure 1 shows the model construction algorithm. The model
is built by iterating the above two steps until some stopping criterion is met.
This stopping criterion can be either that the K-L divergence of ![]() with
respect to
with
respect to ![]() is less than some threshold value, or that the gain of
adding a new feature function is too small to improve the model.
is less than some threshold value, or that the gain of
adding a new feature function is too small to improve the model.
The feature functions are selected from a set of candidate feature functions.
Since the domain ![]() in our work consists of packet classes different in
the protocols and the destination port numbers, our candidate feature function
set comprises of three sets of indicator functions. The first set of indicator
functions checks the packet's protocol information, the second set of indicator
functions classify the packet's destination port number, and the third set
checks both the packet's protocol information and the destination port number.
in our work consists of packet classes different in
the protocols and the destination port numbers, our candidate feature function
set comprises of three sets of indicator functions. The first set of indicator
functions checks the packet's protocol information, the second set of indicator
functions classify the packet's destination port number, and the third set
checks both the packet's protocol information and the destination port number.
The training data used are pre-labeled by humans and the packets related to the
labeled anomalies are not used in computing the empirical distribution
![]() . In this way, we treat the packet classes distribution defined by
the log-linear model in (3) from Maximum Entropy estimation
as the baseline distribution, and are now able to compute the relative entropy
of any given network traffic.
. In this way, we treat the packet classes distribution defined by
the log-linear model in (3) from Maximum Entropy estimation
as the baseline distribution, and are now able to compute the relative entropy
of any given network traffic.
The relative entropy shows the difference between the distribution of the packet classes in the current network traffic and the baseline distribution. If this difference is too large, it indicates that a portion of some packet classes that rarely appear in the training data increases significantly, or that appear regularly decreases significantly. In other words, this serves as an indication of the presence of an anomaly in the network traffic. Our current work only considers the anomalies where anomaly traffic increases.
We divide time into slots of fixed length ![]() . Suppose the traffic in
a time slot contains the packet sequences
. Suppose the traffic in
a time slot contains the packet sequences
![]() , the empirical
distribution
, the empirical
distribution ![]() of the packet classes in this time slot is
of the packet classes in this time slot is
| (8) |
We then use a 'sliding window' detection approach. In each time slot, we record
packet classes that have their divergences larger than a threshold ![]() . If for a
certain packet class
. If for a
certain packet class ![]() ,
,
![]() for more than
for more than ![]() times in a window of
times in a window of ![]() time slots, an alarm is raised together with the packet
class information
time slots, an alarm is raised together with the packet
class information ![]() , which reveals the corresponding protocol and port
number.
, which reveals the corresponding protocol and port
number.
In this section, we present initial experimental results. The data are collected
at the UMASS Internet gateway router using DAG cards made by
Endace [3]. They consist of seven hours' traffic trace collected from
9:30![]() to 10:30
to 10:30![]() in the morning for a week from July 16th to July 22nd,
2004. All of these data are labeled by human inspection. In particular, we
select a set of high volume flows, a set of nodes with high incoming or outgoing
traffic, and a set of port numbers that have high volume of traffic. We then
examine each of them to see whether there are anomalies. For more details of the
trace collected, please refer to [4].
in the morning for a week from July 16th to July 22nd,
2004. All of these data are labeled by human inspection. In particular, we
select a set of high volume flows, a set of nodes with high incoming or outgoing
traffic, and a set of port numbers that have high volume of traffic. We then
examine each of them to see whether there are anomalies. For more details of the
trace collected, please refer to [4].
We use the data taken on July ![]() as the training data set. The Maximum
Entropy estimation algorithm is used to generate the baseline distribution of
the packet classes from the training data. We set the stopping criterion for the
construction algorithm to be whether the K-L difference of
as the training data set. The Maximum
Entropy estimation algorithm is used to generate the baseline distribution of
the packet classes from the training data. We set the stopping criterion for the
construction algorithm to be whether the K-L difference of ![]() with respect to
with respect to
![]() is less than
is less than ![]() . By this criterion, the algorithm ended with a
set of
. By this criterion, the algorithm ended with a
set of ![]() feature functions.
feature functions.
As an example, we first show two cases of port scans that manifest themselves
by increasing the
![]() value. The parameters used are set
as
value. The parameters used are set
as ![]() second,
second, ![]() ,
, ![]() and
and ![]() . On July 19th, 2004, from
9:30
. On July 19th, 2004, from
9:30![]() , when we began our data collection, to 9:37
, when we began our data collection, to 9:37![]() , a host outside of the
UMASS campus network performed a port scan at port
, a host outside of the
UMASS campus network performed a port scan at port ![]() by sending many SYN
packets to different hosts in the UMASS campus network. Then from 9:46
by sending many SYN
packets to different hosts in the UMASS campus network. Then from 9:46![]() to
9:51
to
9:51![]() , another host outside of the UMASS campus network performed another
port scan at the same port. During these two time periods, the relative entropy
of the packet class that represents SYN packets targeting at ports from
, another host outside of the UMASS campus network performed another
port scan at the same port. During these two time periods, the relative entropy
of the packet class that represents SYN packets targeting at ports from ![]() to
to ![]() increased considerably, as shown in Figure 2. These two
port scans were successfully detected by our relative entropy detection
algorithm.
increased considerably, as shown in Figure 2. These two
port scans were successfully detected by our relative entropy detection
algorithm.
We test the performance of the algorithm by running it over the remaining six
human labeled data sets. The detection algorithm provides results at every time
slot ![]() . If an anomaly is detected by the algorithm and there is a
corresponding anomaly detected by human labeling, it is a positive. All
anomalies detected by the algorithm corresponding to the same anomaly labeled by
human are treated as a single positive. If there is no human labeled anomaly
corresponding to the anomaly reported by the algorithm, it is called a
false positive. Consecutive false positives are treated as a single false
positive. Anomalies labeled by human but missed by the algorithm are called
false negatives. In each case, the algorithm detects most of the
anomalies located by human labeling. However, the algorithm also reports many
'false positives'. These 'false positives' are either 'flash crowds'
phenomenons, high rate traffic that communicates with port numbers rarely seen
in the training data, or traffic that we cannot tell what they are given the
limited packet header information. For more details, please refer
to [4].
. If an anomaly is detected by the algorithm and there is a
corresponding anomaly detected by human labeling, it is a positive. All
anomalies detected by the algorithm corresponding to the same anomaly labeled by
human are treated as a single positive. If there is no human labeled anomaly
corresponding to the anomaly reported by the algorithm, it is called a
false positive. Consecutive false positives are treated as a single false
positive. Anomalies labeled by human but missed by the algorithm are called
false negatives. In each case, the algorithm detects most of the
anomalies located by human labeling. However, the algorithm also reports many
'false positives'. These 'false positives' are either 'flash crowds'
phenomenons, high rate traffic that communicates with port numbers rarely seen
in the training data, or traffic that we cannot tell what they are given the
limited packet header information. For more details, please refer
to [4].
In spite of the ambiguous situation concerning all the anomalies
generated by the algorithm, we found that the experimental results
regarding SYN packets give good results. Table
1 summarizes the algorithm performance in the
experiments described above. The table also summarizes the
performance of the algorithm in terms of precision, recall and F1.
Let ![]() be the number of positives,
be the number of positives, ![]() the number of false
positives, and
the number of false
positives, and ![]() the number of false negatives, precision is
defined as
the number of false negatives, precision is
defined as ![]() , recall is defined as
, recall is defined as ![]() and F1 is
defined as
and F1 is
defined as ![]() . The table shows that the Maximum Entropy
method detects most of the anomalies detected by human labeling
with few false negatives and few false positives.
. The table shows that the Maximum Entropy
method detects most of the anomalies detected by human labeling
with few false negatives and few false positives.
We are currently implementing the detection algorithm using an Intel IXP 1200 packet processing engine for routers [5], which has six processing engines, one control processor, and works at 200-MHz clock rate. The empirical distribution of the packet classes in the network traffic is read from the processing engine and compared to the baseline distribution every second. The baseline distribution is estimated offline. In practice, when the traffic is expected to experience certain changes, i.e. due to diurnal effects or planned network reconfiguration, the baseline distribution should be updated or retrained. How to do this is a topic of future research.
In this paper, we introduce our approach to detect anomalies in the network traffic using Maximum Entropy estimation and relative entropy. The packet distribution of the benign traffic is estimated using the Maximum Entropy framework and used as a baseline to detect the anomalies. The method is able to detect anomalies by inspecting only the current traffic instead of a change point detection approach. The experimental results show that it effectively detects anomalies in the network traffic including different kinds of SYN attacks and port scans. This anomaly detection method identifies the type of the anomaly detected and comes with low false positives. The method requires a constant memory and a computation time proportional to the traffic rate. Many interesting aspects of this approach still remain to be explored, and comparison with other methods such as Holt-Winter, when possible, will be useful.
We wish to thank Professor Paul Barford for useful comments and suggestions. Feedback from anonymous reviewers also helped to improve the work. This research is supported by NSF and DARPA under grants CNS-0085848 and F30602-00-2-0554. The data collection equipment was puchased under NSF grant EIA-0080119.
This document was generated using the LaTeX2HTML translator Version 2002-2-1 (1.71)
Copyright © 1993, 1994, 1995, 1996,
Nikos Drakos,
Computer Based Learning Unit, University of Leeds.
Copyright © 1997, 1998, 1999,
Ross Moore,
Mathematics Department, Macquarie University, Sydney.
The command line arguments were:
latex2html -split 0 -show_section_numbers -local_icons re.tex
The translation was initiated by Yu Gu on 2005-08-10