Figures 1, 2, and 3 show the results of our simulations. We simulate a system of 1,000 hosts and present results for two scenarios: 8 attributes with 2 values each (8/2) and 8 attributes with 4 values each (8/4). The choice of 8 attributes is based upon an examination of the most targeted categories of software from public vulnerability databases, such as [7,11]. From these databases, we observed 8 significant software categories and chose this value as a reasonable parameter for our simulations.
We chose two different numbers of values per attribute to 1) explore a worst case and 2) show how core size and storage load benefit as a result of more fine-grained attribute configurations. The choice of 2 values per attribute corresponds to the coarsest division of hosts possible (e.g., Windows vs. Linux), and represents the worst case in terms of core size and storage load. We note that no vulnerabilities exploited by Internet pathogens have been so extreme, and that pathogens tend to exploit vulnerabilities at finer attribute granularities (e.g., Code Red and its variants exploited a vulnerability in Microsoft IIS running on Windows NT). The choice of 4 values per attribute represents a more fine-grained attribute configurations, and we use it to demonstrate how such configurations significantly improve core sizes and reduce storage load.
We only show the results for one sample generated for each value of ![]() ,
as we did not see significant variation across samples. Figures 1
and 2 show the core size averaged over
cores for all of the hosts for different values of the diversity
parameter
,
as we did not see significant variation across samples. Figures 1
and 2 show the core size averaged over
cores for all of the hosts for different values of the diversity
parameter ![]() . We also include a measure of resilience that shows whether our
algorithm was able to cover all attributes or not. A point in the
resilience curve is hence the number of covered attributes, averaged over all
hosts, divided by the total number of attributes. Note that resilience 1.0
means that all attributes are covered.
. We also include a measure of resilience that shows whether our
algorithm was able to cover all attributes or not. A point in the
resilience curve is hence the number of covered attributes, averaged over all
hosts, divided by the total number of attributes. Note that resilience 1.0
means that all attributes are covered.
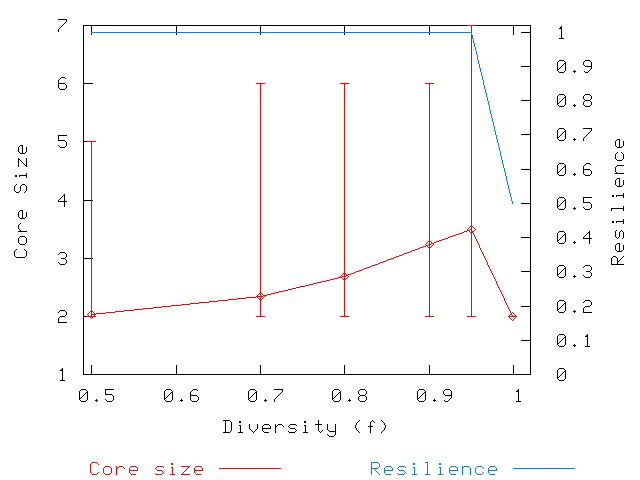
To show the variability in core size, we include error bars in the graphs showing
the maximum and the minimum core sizes for values of ![]() . The
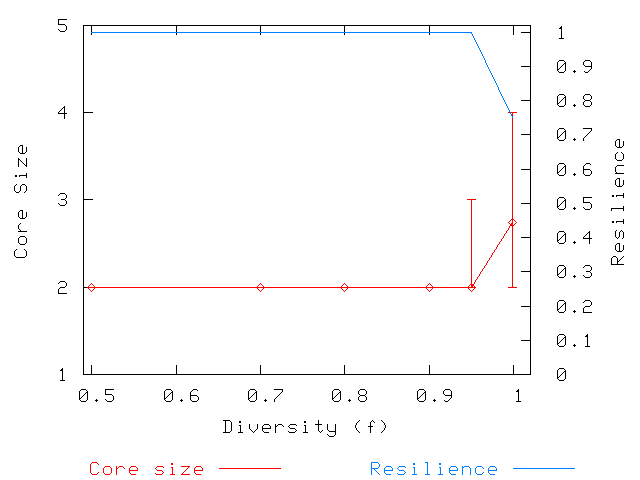
variability in core size is noticeably high in the 8/2 scenario, whereas it is lower in the 8/4 scenario.
Because there are more configurations available in the 8/4 setting, it is likely that a host
. The
variability in core size is noticeably high in the 8/2 scenario, whereas it is lower in the 8/4 scenario.
Because there are more configurations available in the 8/4 setting, it is likely that a host ![]() finds a host
finds a host ![]() which has
different values for every attribute even when the
diversity is highly skewed.
which has
different values for every attribute even when the
diversity is highly skewed.
Regarding the average core size, in the 8/2
scenario, it remains around 2 for values of ![]() under 0.7, and goes up to average
sizes around 3 for higher values of
under 0.7, and goes up to average
sizes around 3 for higher values of ![]() . In either case, storage overhead
is low, although it is overall higher than the average core size for the 8/4 scenario.
The result of adding more attribute values to each attribute is therefore a reduction in
storage overhead. In this scenario, the average core size remains around 2 for most
of the values of
. In either case, storage overhead
is low, although it is overall higher than the average core size for the 8/4 scenario.
The result of adding more attribute values to each attribute is therefore a reduction in
storage overhead. In this scenario, the average core size remains around 2 for most
of the values of ![]() . It only increases for
. It only increases for ![]() .
.
It is important to note that there is a drop in resilience for ![]() in both
scenarios. Observe that, for such a value of
in both
scenarios. Observe that, for such a value of ![]() , there are 999 hosts sharing some subset
, there are 999 hosts sharing some subset
![]() of attributes with a fixed value for each attribute and a single host
of attributes with a fixed value for each attribute and a single host ![]() not sharing
this subset. As a consequence, host
not sharing
this subset. As a consequence, host ![]() has to be in the core of a host
has to be in the core of a host ![]() sharing
sharing ![]() .
Host
.
Host ![]() , however, may not cover all the attributes of
, however, may not cover all the attributes of ![]() . This being the case, there are
possibly other hosts that cover the remaining attributes of
. This being the case, there are
possibly other hosts that cover the remaining attributes of ![]() that
that ![]() does not cover. If
there are no such hosts, then there is no core for
does not cover. If
there are no such hosts, then there is no core for ![]() which covers all attributes. The
resilience for this host is therefore lower.
which covers all attributes. The
resilience for this host is therefore lower.
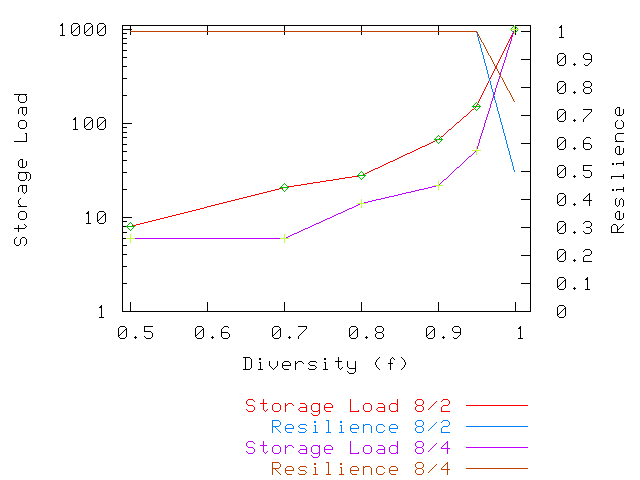
An important question that remains to be addressed is how much backup data a host will
need to store. We address this question with the help of Figure 3. In
this figure, the ![]() -axis plots storage load. Thus, if
-axis plots storage load. Thus, if ![]() , for example, there
is a host
, for example, there
is a host ![]() that must be in
that must be in ![]() cores given the core compositions that we computed, and
every other host must be in
cores given the core compositions that we computed, and
every other host must be in ![]() or fewer cores. As expected, storage load increases as
or fewer cores. As expected, storage load increases as ![]() approaches 1, and reaches 1,000 for
approaches 1, and reaches 1,000 for ![]() in both scenarios. This is due to our previous observation that, for this value of
in both scenarios. This is due to our previous observation that, for this value of ![]() ,
there is a single host which has to be in the core of every other host. We conclude
that the storage overhead for such a highly skewed diversity
is small, but the total load incurred in a small percentage of
the hosts can be very high.
,
there is a single host which has to be in the core of every other host. We conclude
that the storage overhead for such a highly skewed diversity
is small, but the total load incurred in a small percentage of
the hosts can be very high.
Although we have presented results only for 1,000 hosts, we have also looked into
other scenarios with a larger number of hosts. For 10,000 hosts and the
same attribute scenarios, there is no reduction in resilience, and the
average core size remains in the same order of magnitude. As we add more hosts to the system,
we increase the probability of a host having some particular configuration, thus
creating more possibilities for cores. The trend for storage load is the same
as before: the more skewed the distribution of attribute configurations,
the higher the storage load. For highly skewed distributions and large
number of hosts, storage load can be extremely high. One important
observation, however, is that as the population of hosts in the system increases,
the number of different attribute configurations and the number of hosts with some
particular configuration are likely to increase. Thus, for some scenario and
fixed value of ![]() , storage load does not increase linearly with the number of
hosts. In our diversity model, it actually remains in the same order of
magnitude.
, storage load does not increase linearly with the number of
hosts. In our diversity model, it actually remains in the same order of
magnitude.
Suppose now that we want to determine a bound on ![]() for a real system given
our preliminary results. According to [8], over
for a real system given
our preliminary results. According to [8], over ![]() of the hosts
that access a popular web site run some version of Internet Explorer. This is
the most skewed distribution of software they report (the second most skewed
distribution is the percent of hosts running some version of Windows, which is
of the hosts
that access a popular web site run some version of Internet Explorer. This is
the most skewed distribution of software they report (the second most skewed
distribution is the percent of hosts running some version of Windows, which is
![]() ). There are vulnerabilities that attack all versions of Internet
Explorer [11], and so
). There are vulnerabilities that attack all versions of Internet
Explorer [11], and so ![]() for such a collection of hosts can
be no larger than
for such a collection of hosts can
be no larger than ![]() . Note that as one adds attributes that are
less skewed, they will contribute to the diversity of the system and reduce
. Note that as one adds attributes that are
less skewed, they will contribute to the diversity of the system and reduce ![]() .
.
In the lists provided by [8], there are 14 web browsers and 11
operating systems. For an idea of how a scenario like this would
behave, consider a system of 1,000 hosts with 2 attributes and 14 values per attribute.
For a value of ![]() we have an average core size of
we have an average core size of ![]() , a maximum
core size of
, a maximum
core size of ![]() , and storage load of
, and storage load of ![]() . We did not see significant
changes in these values when changing the number of values per attribute
from 14 to 11.
. We did not see significant
changes in these values when changing the number of values per attribute
from 14 to 11.
A storage load of 24 means that there is some host that has to store backup
data from 24 other hosts, or ![]() of its storage to each host. We observe that
this value is high because our heuristic optimizes for storage overhead.
In an environment with such a skewed diversity, a good heuristic will have to take
into account not only storage overhead, but the storage load of available hosts as well.
of its storage to each host. We observe that
this value is high because our heuristic optimizes for storage overhead.
In an environment with such a skewed diversity, a good heuristic will have to take
into account not only storage overhead, but the storage load of available hosts as well.