|
|
We initially implemented PARDA in a completely distributed manner, where each host monitored only its own IO latency to calculate L(t) for Equation 2 (referred to as local latency estimation). However, despite the use of averaging, we found that latencies observed at different hosts were dependent on block-level placement.
We experimented with four hosts, each running one Windows Server 2003 VM configured with a 16 GB data disk created as a contiguous file on the shared LUN. Each VM also has a separate 4 GB system disk. The storage array was an EMC CLARiiON CX3-40 (same hardware setup as in Section 5). Each VM executed a 16 KB random read IO workload. Running without any control algorithm, we noticed that the hosts observed average latencies of 40.0, 34.5, 35.0 and 39.5 ms, respectively. Similarly, the throughput observed by the hosts were 780, 910, 920 and 800 IOPS respectively. Notice that hosts two and three achieved better IOPS and lower latency, even though all hosts were issuing exactly the same IO pattern.
We verified that this discrepancy is explained by placement: the VM
disks (files) were created and placed in order
on the underlying device/LUN, and the middle two virtual disks
exhibited better performance compared to the two outer disks. We
then ran the control algorithm with latency threshold ![]() = 30 ms
and equal
= 30 ms
and equal ![]() for all hosts.
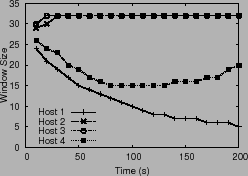
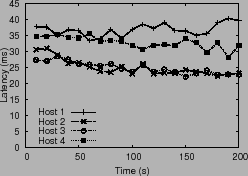
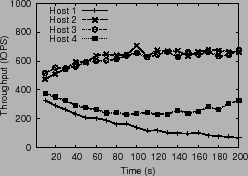
Figure 3 plots the computed window size, latency and
throughput over a period of time. The discrepancy in latencies
observed across hosts leads to divergence in the system.
When hosts two and three observe latencies smaller than
for all hosts.
Figure 3 plots the computed window size, latency and
throughput over a period of time. The discrepancy in latencies
observed across hosts leads to divergence in the system.
When hosts two and three observe latencies smaller than ![]() , they
increase their window size, whereas the other two hosts still see
latencies higher than
, they
increase their window size, whereas the other two hosts still see
latencies higher than ![]() , causing further window size
decreases. This undesirable positive feedback loop leads to a
persistent performance gap.
, causing further window size
decreases. This undesirable positive feedback loop leads to a
persistent performance gap.
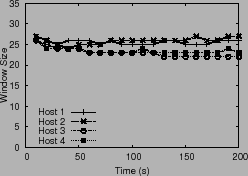
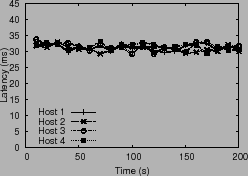
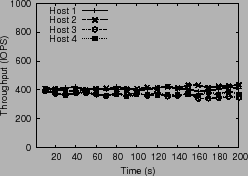
To validate that this effect is due to block placement of VM disks and
array level scheduling, we repeated the same experiment using a single
60 GB shared disk. This disk file was opened by all VMs using a ``multi-writer'' mode.
Without any control, all hosts observed a throughput of
![]() IOPS and latency of
IOPS and latency of ![]() ms. Next we ran with PARDA on
the shared disk, again using equal
ms. Next we ran with PARDA on
the shared disk, again using equal ![]() and
and ![]()
![]() ms.
Figure 4 shows that the window sizes of all
hosts are reduced, and the cluster-wide latency stays close to
ms.
Figure 4 shows that the window sizes of all
hosts are reduced, and the cluster-wide latency stays close to
![]() ms.
ms.
This led us to conclude that, at least for some disk subsystems, latency observations obtained individually at each host for its IOs are a fragile metric that can lead to divergences. To avoid this problem, we instead implemented a robust mechanism that generates a consistent signal for contention in the entire cluster, as discussed in the next section.
Ajay Gulati 2009-01-14