
Shivnath Babu
Duke University

Nedyalko Borisov
Duke University

Sandeep Uttamchandani
IBM Almaden Research Center

Ramani Routray
IBM Almaden Research Center

Aameek Singh
IBM Almaden Research Center

We present DIADS, an integrated DIAgnosis tool for Databases and Storage area networks (SANs). Existing diagnosis tools in this domain have a database-only (e.g., [11]) or SAN-only (e.g., [28]) focus. DIADS is a first-of-a-kind framework based on a careful integration of information from the database and SAN subsystems; and is not a simple concatenation of database-only and SAN-only modules. This approach not only increases the accuracy of diagnosis, but also leads to significant improvements in efficiency.
DIADS uses a novel combination of non-intrusive machine learning techniques (e.g., Kernel Density Estimation) and domain knowledge encoded in a new symptoms database design. The machine learning component provides core techniques for problem diagnosis from monitoring data, and domain knowledge acts as checks-and-balances to guide the diagnosis in the right direction. This unique system design enables DIADS to function effectively even in the presence of multiple concurrent problems as well as noisy data prevalent in production environments. We demonstrate the efficacy of our approach through a detailed experimental evaluation of DIADS implemented on a real data center testbed with PostgreSQL databases and an enterprise SAN.
``The online transaction processing database myOLTP has a 30% slow down in processing time, compared to performance two weeks back.'' This is a typical problem ticket a database administrator would create for the SAN administrator to analyze and fix. Unless there is an obvious failure or degradation in the storage hardware or the connectivity fabric, the response to this problem ticket would be: ``The I/O rate for myOLTP tablespace volumes has increased 40%, with increased sequential reads, but the response time is within normal bounds.'' This to-and-fro may continue for a few weeks, often driving SAN administrators to take drastic steps such as migrating the database volumes to a new isolated storage controller or creating a dedicated SAN silo (the inverse of consolidation, explaining in part why large enterprises still continue to have highly under-utilized storage systems). The myOLTP problem may be fixed eventually by the database administrator realizing that a change in a table's properties had made the plan with sequential data scans inefficient; and the I/O path was never an issue.
The above example is a realistic scenario from large enterprises with separate teams of database and SAN administrators, where each team uses tools specific to its own subsystem. With the growing popularity of Software-as-a-Service, this division is even more predominant with application administrators belonging to the customer, while the computing infrastructure is provided and maintained by the service provider administrators. The result is a lack of end-to-end correlated information across the system stack that makes problem diagnosis hard. Problem resolution in such cases may require either throwing iron at the problem and re-creating resource silos, or employing highly-paid consultants who understand both databases and SANs to solve the performance problem tickets.
The goal of this paper is to develop an integrated diagnosis tool (called DIADS) that spans the database and the underlying SAN consisting of end-to-end I/O paths with servers, interconnecting network switches and fabric, and storage controllers. The input to DIADS is a problem ticket from the administrator with respect to a degradation in database query performance. The output is a collection of top-K events from the database and SAN that are candidate root causes for the performance degradation. Internally, DIADS analyzes thousands of entries in the performance and event logs of the database and individual SAN devices to shortlist an extremely selective subset for further analysis.
Figure 1 shows an integrated database and SAN taxonomy with various logical (e.g., sort and scan operators in a database query plan) and physical components (e.g., server, switch, and storage controller). Diagnosis of problems within the database or SAN subsystem is an area of ongoing research (described later in Section 2). Integrated diagnosis across multiple subsystems is even more challenging:
The taxonomy of problem determination scenarios handled by DIADS is shown in Figure 2. The events in the SAN subsystem can be broadly classified into configuration changes (such as allocation of new applications, change in interconnectivity, firmware upgrades, etc.) and component failure or saturation events. Similarly, database events could correspond to changes in the configuration parameters of the database, or a change in the workload characteristics driven by changes in query plans, data properties, etc. The figure represents a matrix of change events, with relatively complex scenarios arising due to combinations of SAN and database events. In real-world systems, the no change category is misleading, since there will always be change events recorded in management logs that may not be relevant or may not impact the problem at hand; those events still need to be filtered by the problem determination tool. For completeness, there is another dimension (outside the scope of this paper) representing transient effects, e.g., workload contention causing transient saturation of components.
The key contributions of this paper are:
We give an overview of relevant database (DB), storage, and systems diagnosis work, some of which is complementary and leveraged by our integrated approach.
There has been significant prior research in performance diagnosis and problem determination in databases [11,10,20] as well as enterprise storage systems [25,28]. Most of these techniques perform diagnosis in an isolated manner attempting to identify root cause(s) of a performance problem in individual database or storage silos. In contrast, DIADS analyzes and correlates data across the database and storage layers.
DB-only Diagnosis: Oracle's Automatic Database Diagnostic Monitor (ADDM) [10,11] performs fine-grained monitoring to diagnose database performance problems, and to provide tuning recommendations. A similar system [6] has been proposed for Microsoft SQLServer. (Interested readers can refer to [33] for a survey on database problem diagnosis and self-tuning.) However, these tools are oblivious to the underlying SAN layer. They cannot detect problems in the SAN, or identify storage-level root causes that propagate to the database subsystem.
Storage-only Diagnosis: Similarly, there has been research in problem determination and diagnosis in enterprise storage systems. Genesis [25] uses machine learning to identify abnormalities in SANs. A disk I/O throughput model and statistical techniques to diagnose performance problems in the storage layer are described in [28]. There has also been work on profiling techniques for local file systems [3,36] that help collect data useful in identifying performance bottlenecks as well as in developing models of storage behavior [18,30,21].
Drawbacks: Independent database and storage analysis can help diagnose problems like deadlocks or disk failures. However, independent analysis may fail to diagnose problems that do not violate conditions in any one layer, rather contribute cumulatively to the overall poor performance. Two additional drawbacks exist. First, it can involve multiple sets of experts and be time consuming. Second, it may lead to spurious corrective actions as problems in one layer will often surface in another layer. For example, slow I/O due to an incorrect storage volume placement may lead a DB administrator to change the query plan. Conversely, a poor query plan that causes a large number of I/Os may lead the storage administrator to provision more storage bandwidth.
Studies measuring the impact of storage systems on database behavior [27,26] indicate a strong interdependence between the two subsystems, highlighting the importance of an integrated diagnosis tool like DIADS.
Diagnosing performance problems has been a popular research topic in the general systems community in recent years [32,8,9,35,4,19]. Broadly, this work can be split into two categories: (a) systems using machine learning techniques, and (b) systems using domain knowledge. As described later, DIADS uses a novel mix where machine learning provides the core diagnosis techniques while domain knowledge serves as checks-and-balances against spurious correlations.
Diagnosis based on Machine Learning: PeerPressure [32] uses statistical techniques to develop models for a healthy machine, and uses these models to identify sick machines. Another proposed method [4] builds models from process performance counters in order to identify anomalous processes that cause computer slowdowns. There is also work on diagnosing problems in multi-tier Web applications using machine learning techniques. For example, modified Bayesian network models [8] and ensembles of probabilistic models [35] that capture system behavior under changing conditions have been used. These approaches treat data collected from each subsystem equally, in effect creating a single table of performance metrics that is input to machine learning modules. In contrast, DIADS adds more structure and semantics to the collected data, e.g., to better understand the impact of database operator performance vs. SAN volume performance. Furthermore, DIADS complements machine learning techniques with domain knowledge.
Diagnosis based on Domain Knowledge: There are also many systems, especially in the DB community, where domain knowledge is used to create a symptoms database that associates performance symptoms with underlying root causes [34,19,24,10,11]. Commercial vendors like EMC, IBM, and Oracle use symptom databases for problem diagnosis and correction. While these databases are created manually and require expertise and resources to maintain, recent work attempts to partially automate this process [9,12].
We believe that a suitable mix of machine learning techniques and domain knowledge is required for a diagnosis tool to be useful in practice. Pure machine learning techniques can be misled by spurious correlations in data resulting from noisy data collection or event propagation (where a problem in one component impacts another component). Such effects need to be addressed using appropriate domain knowledge, e.g., component dependencies, symptoms databases, and knowledge of query plan and operator relationships.
It is also important to differentiate DIADS from tracing-based techniques [7,1] that trace messages through systems end-to-end to identify performance problems and failures. Such tracing techniques require changes in production system deployments and often add significant overhead in day-to-day operations. In contrast, DIADS performs a postmortem analysis of monitored performance data collected at industry-standard intervals to identify performance problems.
Next, we provide an overview of DIADS.
Suppose a query ![]() that a report-generation application
issues periodically to the database system shows a slowdown in performance.
One approach to track down the cause is to leverage historic monitoring data collected from the
entire system.
There are several product offerings [13,15,16,17,31]
in the market that collect and persist monitoring data from IT systems.
that a report-generation application
issues periodically to the database system shows a slowdown in performance.
One approach to track down the cause is to leverage historic monitoring data collected from the
entire system.
There are several product offerings [13,15,16,17,31]
in the market that collect and persist monitoring data from IT systems.
DIADS uses a commercial storage management server--IBM TotalStorage Productivity Center [17]--that collects monitoring data from multiple layers of the IT stack including databases, servers, and the SAN. The collected data is transformed into a tabular format, and persisted as time-series data in a relational database.
SAN-level data: The collected data includes: (i) configuration of components (both physical and logical), (ii) connectivity among components, (iii) changes in configuration and connectivity information over time, (iv) performance metrics of components, (v) system-generated events (e.g., disk failure, RAID rebuild) and (vi) events generated by user-defined triggers [14] (e.g., degradation in volume performance, high workload on storage subsystem).
Database-level data:
To execute a query, a database system generates a plan that
consists of operators selected from a small, well-defined family of operators [14].
Let us consider an example query ![]() :
:
SELECT   Product.Category, SUM(Product.Sales)
FROM     Product
WHERE    Product.Price > 1000
GROUP BY Product.Category
![]() asks for the total sales of products, priced above 1000,
grouped per category. Figure 1 shows a plan
asks for the total sales of products, priced above 1000,
grouped per category. Figure 1 shows a plan ![]() to
execute
to
execute ![]() .
. ![]() consists of four operators: an Index Scan of
the index on the Price attribute, a Fetch to bring matching
records from the Product table, a Sort to sort these records on
Category values, and a Grouping to do the grouping and
summation. For each execution of
consists of four operators: an Index Scan of
the index on the Price attribute, a Fetch to bring matching
records from the Product table, a Sort to sort these records on
Category values, and a Grouping to do the grouping and
summation. For each execution of ![]() , DIADS collects some
monitoring data per operator
, DIADS collects some
monitoring data per operator ![]() . The relevant data includes:
. The relevant data includes: ![]() 's
start time, stop time, and record-count (number of records
returned in
's
start time, stop time, and record-count (number of records
returned in ![]() 's output).
's output).
DIADS's Diagnosis Interface:
DIADS presents an interface where an administrator can mark a query
as having experienced a slowdown. Furthermore, the
administrator either specifies declaratively or marks directly the runs of the
query that were satisfactory and those that were unsatisfactory.
For example, runs with running time below 100 seconds are satisfactory, or
all runs between 8 AM and 2 PM were satisfactory, and those between 2 PM and 3 PM were unsatisfactory.
Diagnosis Workflow: DIADS then invokes the workflow shown in Figure 3 to diagnose the query slowdown based on the monitoring data collected for satisfactory and unsatisfactory runs. By default, the workflow is run in a batch mode. However, the administrator can choose to run the workflow in an interactive mode where only one module is run at a time. After seeing the results of each module, the administrator can edit the data or results before feeding them to the next module, bypass or reinvoke modules, or stop the workflow. Because of space constraints, we will not discuss the interactive mode further in this paper.
The first module in the workflow, called Module Plan-Diffing (PD), looks for significant changes between the plans used in satisfactory and unsatisfactory runs. If such changes exist, then DIADS tries to pinpoint the cause of the plan changes (which includes, e.g., index addition or dropping, changes in data properties, or changes in configuration parameters used during plan selection). The techniques used in this module contain details specific to databases, so they are covered in a companion paper [5].
The remaining modules are invoked if DIADS finds a plan ![]() that is involved in both
satisfactory and unsatisfactory runs of the query. We give a brief overview
before diving into the details in Section 4 :
that is involved in both
satisfactory and unsatisfactory runs of the query. We give a brief overview
before diving into the details in Section 4 :
Integrated database/SAN diagnosis: Note that the workflow ``drills down" progressively from the level of the query to plans and to operators, and then uses dependency analysis and the symptoms database to further drill down to the level of performance metrics and events in components. Finally, impact analysis is a ``roll up" to tie potential root causes back to their impact on the query slowdown. The drill down and roll up are based on a careful integration of information from the database and SAN layers; and is not a simple concatenation of database-only and SAN-only modules. Only low overhead monitoring data is used in the entire process.
Machine learning + domain knowledge: DIADS's workflow is a novel combination of elements from machine learning with the use of domain knowledge. A number of modules in the workflow use correlation analysis which is implemented using machine learning; the details are in Sections 4.1 and 4.2. Domain knowledge is incorporated into the workflow in Modules DA, SD, and IA; the details are given respectively in Sections 4.2-4.4. (Domain knowledge is also used in Module PD which is beyond the scope of this paper.) As we will demonstrate, the combination of machine learning and domain knowledge provides built-in checks and balances to deal with the challenges listed in Section 1.
We now provide details for all modules in DIADS's diagnosis workflow. Upfront, we would like to point out that our main goal is to describe an end-to-end instantiation of the workflow. We expect that the specific implementation techniques used for the modules will change with time as we gain more experience with DIADS.
Technique:
DIADS identifies the correlated operators by analyzing the monitoring data collected
during satisfactory and unsatisfactory runs of ![]() . This data can be seen as records with attributes
. This data can be seen as records with attributes
![]() for each run of
for each run of ![]() . Here, attribute
. Here, attribute ![]() is
the total time for one complete run of
is
the total time for one complete run of ![]() , and attribute
, and attribute
![]() is the running time of operator
is the running time of operator ![]() for that run.
Attribute
for that run.
Attribute ![]() is an annotation (or label) associated
with each record that represents whether the corresponding run of
is an annotation (or label) associated
with each record that represents whether the corresponding run of ![]() was satisfactory or not. Thus,
was satisfactory or not. Thus, ![]() takes one of two values: satisfactory (denoted
takes one of two values: satisfactory (denoted ![]() ) or unsatisfactory (denoted
) or unsatisfactory (denoted ![]() ).
).
Let the values of attribute ![]() in records with annotation
in records with annotation ![]() be
be
![]() , and those with annotation
, and those with annotation ![]() be
be
![]() .
That is,
.
That is,
![]() are
are ![]() observations of the running time of
operator
observations of the running time of
operator ![]() when the plan
when the plan ![]() ran satisfactorily. Similarly,
ran satisfactorily. Similarly,
![]() are
are ![]() observations of the running time of
observations of the running time of ![]() when the running time of
when the running time of ![]() was unsatisfactory.
DIADS pinpoints correlated operators
by characterizing how the distribution of
was unsatisfactory.
DIADS pinpoints correlated operators
by characterizing how the distribution of
![]() differs from that of
differs from that of
![]() . For this purpose, DIADS uses
Kernel Density Estimation (KDE) [22].
. For this purpose, DIADS uses
Kernel Density Estimation (KDE) [22].
KDE is a non-parametric technique to estimate the probability density function of a random variable.
Let ![]() be the random variable that represents the running time of operator
be the random variable that represents the running time of operator ![]() when the overall plan performance is satisfactory. KDE applies a kernel density estimator to the
when the overall plan performance is satisfactory. KDE applies a kernel density estimator to the
![]() observations
observations
![]() of
of ![]() to learn
to learn ![]() 's probability density function
's probability density function ![]() .
.
(1) 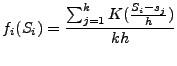 |
 .
(Intuitively, kernel density estimators are a generalization and improvement over histograms.)
.
(Intuitively, kernel density estimators are a generalization and improvement over histograms.)
Let ![]() be an observation of operator
be an observation of operator ![]() 's running time when
the plan performance was unsatisfactory. Consider the probability estimate
prob
's running time when
the plan performance was unsatisfactory. Consider the probability estimate
prob![]()
![]() . Intuitively,
as
. Intuitively,
as ![]() becomes higher than the typical range of values of
becomes higher than the typical range of values of ![]() ,
prob
,
prob![]() becomes closer to 1. Thus, a high value of
prob
becomes closer to 1. Thus, a high value of
prob![]() represents a significant increase in the running time of operator
represents a significant increase in the running time of operator ![]() when plan performance was
unsatisfactory compared to that when plan performance was satisfactory.
when plan performance was
unsatisfactory compared to that when plan performance was satisfactory.
Specifically, DIADS includes ![]() in the set of correlated operators
if
prob
in the set of correlated operators
if
prob![]() . Here,
. Here,
![]() is the average of
is the average of
![]() and
and
![]() is a small positive constant.
is a small positive constant.
![]() by default. For obvious reasons,
prob
by default. For obvious reasons,
prob![]() is called the anomaly score of operator
is called the anomaly score of operator ![]() .
.
Technique: DIADS implements this module using dependency analysis which is based on generating and pruning dependency paths for the correlated operators. We describe the generation and pruning of dependency paths in turn.
Generating dependency paths:
The dependency path of an operator ![]() is the set of physical
(e.g., server CPU, database buffer cache, disk) and logical
(e.g., volume, external workload) components
in the system whose performance can have an impact on
is the set of physical
(e.g., server CPU, database buffer cache, disk) and logical
(e.g., volume, external workload) components
in the system whose performance can have an impact on ![]() 's performance.
DIADS generates dependency paths automatically based on the following data:
's performance.
DIADS generates dependency paths automatically based on the following data:
Pruning dependency paths:
The fact that a component ![]() is in the dependency path of an operator
is in the dependency path of an operator ![]() does not necessarily mean that
does not necessarily mean that ![]() 's performance has been affected
by
's performance has been affected
by ![]() 's performance. After generating the dependency paths
conservatively, DIADS prunes these paths based on correlation analysis
using KDE.
's performance. After generating the dependency paths
conservatively, DIADS prunes these paths based on correlation analysis
using KDE.
Recall from Section 3 that the monitoring data collected by DIADS contains
multiple observations of the running time of operator ![]() both when the overall plan
ran satisfactorily and when the plan ran unsatisfactorily.
For each run of
both when the overall plan
ran satisfactorily and when the plan ran unsatisfactorily.
For each run of ![]() , consider the performance data collected by DIADS for each component
, consider the performance data collected by DIADS for each component
![]() in
in ![]() 's dependency path; this data
is collected in the
's dependency path; this data
is collected in the ![]() time interval
where
time interval
where ![]() and
and ![]() are respectively
are respectively ![]() 's (absolute) start and stop times for that run.
Across all runs,
this data can be represented as a table with attributes
's (absolute) start and stop times for that run.
Across all runs,
this data can be represented as a table with attributes
![]() . Here,
. Here, ![]() -
-![]() are performance metrics of component
are performance metrics of component ![]() , and the
annotation attribute
, and the
annotation attribute ![]() represents whether
represents whether ![]() 's running time
's running time ![]() was satisfactory or
not in the corresponding run. It follows from Section 4.1 that we can set
was satisfactory or
not in the corresponding run. It follows from Section 4.1 that we can set
![]() 's value in a record to
's value in a record to ![]() (denoting unsatisfactory) if
prob
(denoting unsatisfactory) if
prob![]() ; and to
; and to ![]() otherwise.
otherwise.
Given the above annotated performance data for an
![]() operator-component pairing, we can
apply correlation analysis using KDE to identify
operator-component pairing, we can
apply correlation analysis using KDE to identify ![]() 's performance metrics that are correlated
with the change in
's performance metrics that are correlated
with the change in ![]() 's performance. The details are similar to that in Section
4.1 except for the following: for some performance
metrics, observed values lower than the typical range are anomalous. This correlation can
be captured using the condition
prob
's performance. The details are similar to that in Section
4.1 except for the following: for some performance
metrics, observed values lower than the typical range are anomalous. This correlation can
be captured using the condition
prob![]() , where
, where ![]() is the random variable corresponding to the metric,
is the random variable corresponding to the metric, ![]() is a value observed for
is a value observed for ![]() , and
, and
![]() is a small positive constant.
is a small positive constant.
In effect, the dependency analysis module will identify the set of components
that: (i) are part of ![]() 's dependency path, and
(ii) have at least one performance metric that is correlated with the running time
of a correlated operator
's dependency path, and
(ii) have at least one performance metric that is correlated with the running time
of a correlated operator ![]() . By default,
DIADS will only consider the components in the inner dependency paths of correlated
operators. However, components in the outer dependency paths will be considered
if required by the symptoms database (Module SD).
. By default,
DIADS will only consider the components in the inner dependency paths of correlated
operators. However, components in the outer dependency paths will be considered
if required by the symptoms database (Module SD).
Recall Module CR in the diagnosis workflow where DIADS
checks for significant correlation between plan ![]() 's running time
and the record counts of
's running time
and the record counts of ![]() 's operators. DIADS implements this module
using KDE in a manner almost similar to the use of KDE in dependency analysis;
hence Module CR is not discussed further.
's operators. DIADS implements this module
using KDE in a manner almost similar to the use of KDE in dependency analysis;
hence Module CR is not discussed further.
The modules so far in the workflow drilled down from the level of the query to that of physical and logical components in the system; in the process identifying correlated operators and performance metrics. While this information is useful, the detected correlations may only be symptoms of the true root cause(s) of the query slowdown. This issue, which can mask the true root cause(s), is generally referred to as the event (fault) propagation problem in diagnosis. For example, a change in data properties at the database level may, in turn, propagate to the volume level causing volume contention, and to the server level increasing CPU utilization. In addition, some spurious correlations may creep in and manifest themselves as unexpected symptoms in spite of our careful drill down process.
Objective: DIADS's Module SD tries to map the observed symptoms to the actual root cause(s), while dealing with missing as well as unexpected symptoms arising from the noisy nature of production systems.
Technique: DIADS uses a symptoms database to do the mapping. This database streamlines the use of domain knowledge in the diagnosis workflow to:
Another format, called the Codebook [34], is very intuitive
as well as implemented in a commercial product. This format assumes
a finite set of symptoms such that each distinct root cause ![]() has a unique
signature in this set. That is, there is a
unique subset of symptoms that
has a unique
signature in this set. That is, there is a
unique subset of symptoms that ![]() gives rise to which differs makes it
distinguishable from all other root causes. This information is represented
in the Codebook which is a matrix whose columns correspond to the symptoms
and rows correspond to the root causes.
A cell is mapped to 1 if the corresponding root cause should show the corresponding symptom; and
to 0 otherwise. Figure 4 shows
an example Codebook where there are four hypothetical symptoms
gives rise to which differs makes it
distinguishable from all other root causes. This information is represented
in the Codebook which is a matrix whose columns correspond to the symptoms
and rows correspond to the root causes.
A cell is mapped to 1 if the corresponding root cause should show the corresponding symptom; and
to 0 otherwise. Figure 4 shows
an example Codebook where there are four hypothetical symptoms ![]() -
-![]() and three root causes
and three root causes ![]() -
-![]() .
.
When presented with a vector ![]() of symptoms seen in the system,
the Codebook computes the distance
of symptoms seen in the system,
the Codebook computes the distance ![]() of
of ![]() to each row
to each row ![]() (i.e., root
cause). Any number of different distance metrics can be used, e.g., Euclidean (
(i.e., root
cause). Any number of different distance metrics can be used, e.g., Euclidean (![]() )
distance or Hamming distance [34].
)
distance or Hamming distance [34]. ![]() is a measure of the confidence that
is a measure of the confidence that
![]() is a root cause of the problem. For example, given a symptoms vector
is a root cause of the problem. For example, given a symptoms vector
![]() (i.e., only
(i.e., only ![]() and
and ![]() are seen),
the Euclidean distances to the three root causes in Figure 4 are 0,
are seen),
the Euclidean distances to the three root causes in Figure 4 are 0,
![]() , and 1 respectively. Hence,
, and 1 respectively. Hence, ![]() is the best match.
is the best match.
The Codebook format does well on both our evaluation criteria.
Codebooks can handle noisy situations, and administrators can easily
validate the reasoning process. However, DIADS
needs to consider complex symptoms such as symptoms with
temporal properties. For example, we may need to specify
a symptom where a disk failure is seen within ![]() minutes of the first
incidence of the query slowdown, where
minutes of the first
incidence of the query slowdown, where ![]() may vary depending on the installation.
Thus, it is almost impossible in our
domain to fully enumerate a closed space of relevant symptoms, and to specify for each root
cause whether each symptom from this space will be seen or not.
These observations led to DIADS's new design of the symptoms database:
may vary depending on the installation.
Thus, it is almost impossible in our
domain to fully enumerate a closed space of relevant symptoms, and to specify for each root
cause whether each symptom from this space will be seen or not.
These observations led to DIADS's new design of the symptoms database:
Generation of the symptoms database: Companies like EMC, IBM, HP, and Oracle are investing significant (currently, mostly manual) effort to create symptoms databases for different subsystems like networking infrastructure, application servers, and databases [34,19,24,9,10,11]. Symptoms databases created by some of these efforts are already in commercial use. The creation of these databases can be partially automated, e.g., through a combination of fault injection and machine learning [9,12]. In fact, DIADS's modules like correlation, dependency, and impact analysis can be used to identify important symptoms automatically.
Objective: The confidence score computed by the symptoms database module
for a potential root cause ![]() captures how well the symptoms seen in the system match
the expected symptoms of
captures how well the symptoms seen in the system match
the expected symptoms of ![]() . For each root cause
. For each root cause ![]() whose confidence score exceeds a threshold,
the impact analysis module computes
whose confidence score exceeds a threshold,
the impact analysis module computes ![]() 's impact score. If
's impact score. If ![]() is an actual root cause,
then
is an actual root cause,
then ![]() 's impact score represents the fraction of the query slowdown that can be attributed to
's impact score represents the fraction of the query slowdown that can be attributed to
![]() individually. DIADS's novel impact analysis module serves three significant purposes:
individually. DIADS's novel impact analysis module serves three significant purposes:
Technique: Interestingly, one approach for impact analysis
is to invert the process
of dependency analysis from Section 4.2. Let ![]() be a potential root
cause whose impact score needs to be estimated:
be a potential root
cause whose impact score needs to be estimated:
The above approach will work as long as for any pair
of suspected root causes ![]() and
and ![]() ,
,
![]() .
However, if there are one or more operators common to
.
However, if there are one or more operators common to ![]() and
and ![]() whose running times have changed significantly, then the above approach
cannot fully separate out the individual impacts of
whose running times have changed significantly, then the above approach
cannot fully separate out the individual impacts of ![]() and
and ![]() .
.
DIADS addresses the above problem by leveraging plan cost models that play a critical role in all database systems. For each query submitted to a database system, the system will consider a number of different plans, use the plan cost model to predict the running time (or some other cost metric) of each plan, and then select the plan with minimum predicted running time to run the query to completion. These cost models have two main components:
The following are two examples of how DIADS uses plan cost models:
DIADS's use of plan cost models is a general technique for impact analysis, but it is limited by what effects are accounted for in the model. For example, if wait times for locks are not modeled, then the impact score cannot be computed for locking-based problems. Addressing this issue--e.g., by extending plan cost models or by using planned experiments at run time--is an interesting avenue for future work.
The taxonomy of scenarios considered for diagnosis in the evaluation follows from Figure 2. DIADS was used to diagnose query slowdowns caused by (i) events within the database and the SAN layers, (ii) combinations of events across both layers, as well as (iii) multiple concurrent problems (a capability unique to DIADS). Due to space limitations, it is not possible to describe all the scenario permutations from Figure 2. Instead, we start with a scenario and make it increasingly complex by combining events across the database and SAN. We consider: (i) volume contention caused by SAN misconfiguration, (ii) database-level problems (change in data properties, contention due to table locking) whose symptoms propagate to the SAN, and (iii) independent and concurrent database-level and SAN-level problems.
We provide insights into how DIADS diagnoses these problems by drilling down to the intermediate results like anomaly, confidence, and impact scores. While there is no equivalent tool available for comparison with DIADS, we provide insights on the results that a database-only or SAN-only tool would have generated; these insights are derived from hands-on experience with multiple in-house and commercial tools used by administrators today. Within the context of the scenarios, we also report sensitivity analysis of the anomaly score to the number of historic samples and length of the monitoring interval.
Our experimental testbed is part of a production SAN environment, with the interconnecting fabric and storage controllers being shared by other applications. Our experiments ran during low activity time-periods on the production environment. The testbed runs data-warehousing queries from the popular TPC-H benchmark [29] on a PostgreSQL database server configured to access tables using two Ext3 filesystem volumes created on an enterprise-class IBM DS6000 storage controller. The database server is a 2-way 1.7 GHz IBM xSeries machine running Linux (Redhat 4.0 Server), connected to the storage controller via Fibre Channel (FC) host bus adaptor (HBA). Both the storage volumes are RAID 5 configurations consisting of (4 + 2P) 15K FC disks.
An IBM TotalStorage Productivity Center [17] SAN management server runs on a separate machine recording configuration details, statistics, and events from the SAN as well as from PostgreSQL (which was instrumented to report the data to the management tool). Figure 6 shows the key performance metrics collected from the database and SAN. The monitoring data is stored as time-series data in a DB2 database. Each module in DIADS's workflow is implemented using a combination of Matlab scripts (for KDE) and Java. DIADS uses a symptoms database that was developed in-house to diagnose query slowdowns in database over SAN deployments.
Our experimental results focus on the slowdown of the plan
shown in Figure 5 for Query 2 from TPC-H.
Figure 5 shows the 25 operators in the plan,
denoted ![]() -
-![]() . In database terminology, the operators
Index Scan and Sequential Scan are leaf operators since
they access data directly from the tables; hence the leaf operators are
the most sensitive to changes in SAN performance. The plan has 9 leaf operators.
The other operators process intermediate results.
. In database terminology, the operators
Index Scan and Sequential Scan are leaf operators since
they access data directly from the tables; hence the leaf operators are
the most sensitive to changes in SAN performance. The plan has 9 leaf operators.
The other operators process intermediate results.
To further understand the anomaly scores, we conducted a series of
sensitivity tests. Figure 7 shows the sensitivity of
the anomaly scores of three representative operators
to the number of samples available from the satisfactory runs.
![]() 's score converges quickly to 1 because
's score converges quickly to 1 because ![]() 's
running time under volume contention is almost 5X the normal.
However, the scores for leaf operator
's
running time under volume contention is almost 5X the normal.
However, the scores for leaf operator ![]() and intermediate operator
and intermediate operator
![]() take around 20 samples to converge. With fewer than these
many samples,
take around 20 samples to converge. With fewer than these
many samples, ![]() could have become a false positive.
In all our results, the anomaly scores of all 25 operators converge within
20 samples. While more samples may be required in environments with higher noise levels,
the relative simplicity of KDE (compared to models like Bayesian networks)
keeps this number low.
could have become a false positive.
In all our results, the anomaly scores of all 25 operators converge within
20 samples. While more samples may be required in environments with higher noise levels,
the relative simplicity of KDE (compared to models like Bayesian networks)
keeps this number low.
|
This module generates and prunes dependency paths for correlated
operators in order to relate operator performance to
database and SAN component performance.
For ease of presentation, we will focus on the leaf operators
in Figure 5 since they are the most sensitive
to SAN performance. Given the configuration of our
experimental testbed in Figure 5, the
primary difference between the dependency paths of various
operators is in the volumes they access:
V1 is in the dependency path of ![]() and
and ![]() , and V2 is in the paths
of
, and V2 is in the paths
of ![]() ,
, ![]() ,
, ![]() ,
, ![]() ,
, ![]() ,
, ![]() , and
, and ![]() .
.
The set of correlated operators from Module CO are ![]() ,
, ![]() , and
, and ![]() .
Thus, DIADS will compute anomaly scores for the performance metrics
of both V1 and V2. Table 2's second column shows the anomaly
scores for two representative metrics each from V1 and V2.
(Table 2's third column is described later in this section.)
As expected, none of V2's metrics are identified as correlated because
V2 has no contention; while those of V1 are.
.
Thus, DIADS will compute anomaly scores for the performance metrics
of both V1 and V2. Table 2's second column shows the anomaly
scores for two representative metrics each from V1 and V2.
(Table 2's third column is described later in this section.)
As expected, none of V2's metrics are identified as correlated because
V2 has no contention; while those of V1 are.
Anomaly scores are low in this module because data properties do not change.
The symptoms identified up to this stage are:
These symptoms are strong evidence that
V1's performance is a cause of the query slowdown,
and V2's performance is not. Thus, even when
a symptoms database is not available, DIADS
correctly narrows down the search space an administrator has to consider during diagnosis.
An impact analysis will further point out that the false positive symptom
due to ![]() has little impact on the query slowdown.
has little impact on the query slowdown.
However, without a symptoms database or further diagnosis effort from the
administrator, the root cause of V1's change of performance is still unknown
among possible candidates like: (i) change of performance of an external
workload, (ii) a runaway query in the database, or (iii) a RAID rebuild.
We will now report results from the use of a symptoms database that was developed in-house.
DIADS uses this database as described in Section 4.3 except that instead of reporting
numeric confidence scores to administrators, DIADS reports confidence as one
of High (
![]() ), Medium (
), Medium (
![]() ),
or Low (
),
or Low (
![]() ). The summary of Module SD's output in the
current scenario is:
). The summary of Module SD's output in the
current scenario is:
Impact analysis done using the inverse dependency analysis technique gives an impact score of 99.8% for the high-confidence root cause found. This score is high because the slowdown is caused entirely by the contention in V1.
In keeping with our experimental methodology, we complicated the problem scenario to test DIADS's robustness. Everything was kept the same except that we created extra I/O load on Volume V2 in a bursty manner such that this extra load had little impact on the query beyond the original impact of V1's contention. Without intrusive tracing, it would not be possible to rule out the extra load on V2 as a potential cause of the slowdown.
Interestingly, DIADS's integrated approach is still able to give the right answer. Compared to the previous scenario, there will now be some extra symptoms due to higher anomaly scores for V2's performance metrics (as shown in the third column in Table 2). However, root causes with contention-related symptoms for V2 will still have Low confidence because most of the leaf operators depending on V2 will have low anomaly scores as before. Also, impact scores will be low for these causes.
Unlike DIADS, a SAN-only diagnosis tool may spot higher I/O loads in both V1 and V2, and attribute both of these as potential root causes. Even worse, the tool may give more importance to V2 because most of the data is on V2. A database-only tool can pinpoint the slowdown in the operators. However, this tool cannot track the root cause down to the SAN level because it has no visibility into SAN configuration or performance. From our experience, database-only tools may give several false positives in this context, e.g., suboptimal bufferpool setting or a suboptimal choice of execution plan.
In this scenario we cause a query slowdown by changing the properties of the data, causing extra I/O on Volume V2. The change is done by an update statement that modifies the value of an attribute in some records of the part table. The overall size of all tables, including part, are unchanged. There are no external causes of contention on the volumes.
Modules CO, DA, and CR behave as expected. In particular,
module CR correctly identifies all the operators whose record-counts
show a correlation with plan performance: operators
![]() ,
, ![]() ,
, ![]() , and
, and ![]() show increased
record-counts, while operators
show increased
record-counts, while operators ![]() and
and ![]() show reduced record-counts.
The root-cause entry for changes in data properties gets
High confidence in Module SD because all needed symptoms match.
All other root-cause entries get Low confidence, including
contention due to changes in external workload and
database workload because no correlations are detected on the outer
dependency paths of correlated operators (as expected).
show reduced record-counts.
The root-cause entry for changes in data properties gets
High confidence in Module SD because all needed symptoms match.
All other root-cause entries get Low confidence, including
contention due to changes in external workload and
database workload because no correlations are detected on the outer
dependency paths of correlated operators (as expected).
The impact analysis module gives the final confirmation that the change in data properties is the root cause, and rules out the presence of high-impact external causes of volume contention. As described in Section 4.4, we can use the plan cost model from the database to estimate the individual impact of any change in data properties. In this case, the impact score for the change in data properties is 88.31%. Hence, DIADS could have diagnosed the root cause of this problem even if the symptoms database was unavailable or incomplete.
We complicate Scenario 2 by injecting contention on Volume V2 due to SAN misconfiguration along with the change in data properties. Both these problems individually cause contention in V2. The SAN misconfiguration is the higher-impact cause in our testbed. This key scenario represents the occurrence of multiple, possibly related, events at the database and SAN layers, complicating the diagnosis process. The expected result from DIADS is the ability to pinpoint both these events as causes, and giving the relative impact of each cause on query performance.
The CO, DA, and CR Modules behave in a fashion similar to Scenario 2,
and drill down to the contention in Volume V2. We considered
DIADS's performance in two cases: with and without the symptoms database.
When the symptoms database is unavailable or incomplete, DIADS
cannot distinguish between Scenarios 2 and 3. However, DIADS's
impact analysis module computes the impact score for the
change in data properties, which comes to ![]() . (This low score
is representative because the SAN misconfiguration has more than 10X higher
impact on the query performance than the change in data properties.)
Hence, DIADS final answer in this case is as follows: (i) a change in data
properties is a high-confidence but low-impact cause of the
problem, and (ii) there are one or more other causes that impact V2 which
could not be diagnosed.
. (This low score
is representative because the SAN misconfiguration has more than 10X higher
impact on the query performance than the change in data properties.)
Hence, DIADS final answer in this case is as follows: (i) a change in data
properties is a high-confidence but low-impact cause of the
problem, and (ii) there are one or more other causes that impact V2 which
could not be diagnosed.
When the symptoms database is present, both the actual root causes are given High confidence by Module SD because the needed symptoms are seen in both cases. Thus, DIADS will pinpoint both the causes. Furthermore, impact analysis will confirm that the full impact on the query performance can be explained by these two causes.
A database-only diagnosis tool would have successfully diagnosed the change in data properties in both Scenarios 2 and 3. However, the tool may have difficulty distinguishing between these two scenarios or pinpointing causes at the SAN layer. A SAN-only diagnosis tool will pinpoint the volume overload. However, it will not be able to separate out the impacts of the two causes. Since the sizes of the tables do not change, we also suspect that such a tool may even rule out the possibility of a change in data properties being a cause.
The scenarios described in the experimental evaluation were carefully chosen to be simple, but not simplistic. They are representative of event categories occurring within the DB and SAN layers as shown in Figure 2. We have additionally experimented with different events within those categories such as CPU and memory contention in the SAN in addition to disk-level saturation, different types of database misconfiguration, and locking-based database problems. Locking-based problems are hard to diagnose because they can cause different types of symptoms in the SAN layer, including contention as well as underutilization. We have also considered concurrent occurrence of three or more problems, e.g., change in data properties, SAN misconfiguration, and locking-based problems. The insights from these experiments are similar to those seen already, and further confirm the utility of an integrated tool. However:
We presented an integrated database and storage diagnosis tool called DIADS. Using a novel combination of machine learning techniques with database and storage expert domain-knowledge, DIADS accurately identifies the root cause(s) of problems in query performance; irrespective of whether the problem occurs in the database or the storage layer. This integration enables a more accurate and efficient diagnosis tool for system administrators. Through a detailed experimental evaluation, we also demonstrated the robustness of our approach: with its ability to deal with concurrent multiple problems as well as presence of noisy data.
In future, we are interested in exploring two directions of research. First, we are investigating approaches that further strengthen the analysis done as part of DIADS modules, e.g., techniques that complement database query plan models using planned run-time experiments. Second, we aim to generalize our diagnosis techniques to support applications other than databases in conjunction with enterprise storage.
This document was generated using the LaTeX2HTML translator Version 2002-2-1 (1.71)
Copyright © 1993, 1994, 1995, 1996,
Nikos Drakos,
Computer Based Learning Unit, University of Leeds.
Copyright © 1997, 1998, 1999,
Ross Moore,
Mathematics Department, Macquarie University, Sydney.
The command line arguments were:
latex2html -split 0 -show_section_numbers -local_icons -no_navigation paper
The translation was initiated by Nedyalko Borisov on 2009-01-13
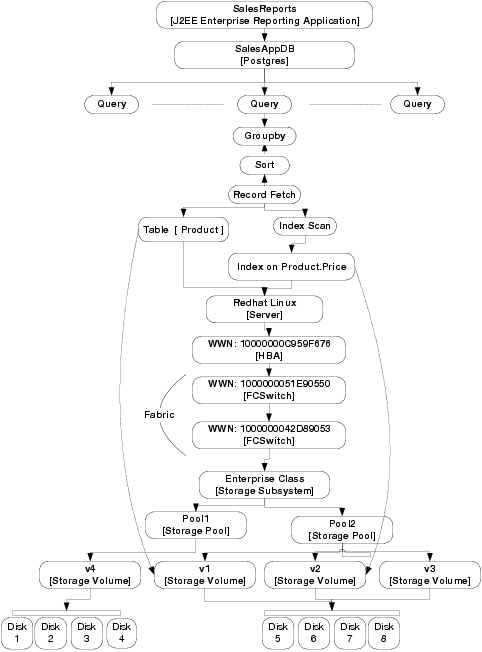 Figure 1:Example database/SAN deployment.
 Figure 2:Taxonomy of scenarios for root-cause analysis.

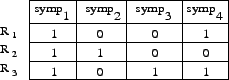
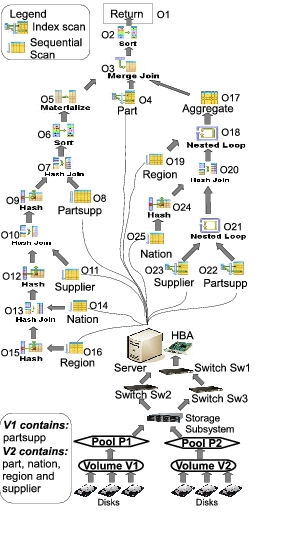 Figure 5:Query plan, operators, and dependency paths for the experimental results
 Figure 6:Important performance metrics collected by DIADS
 Figure 7:
Sensitivity of anomaly scores to the number of satisfactory
samples. While
Figure 7:
Sensitivity of anomaly scores to the number of satisfactory
samples. While  Figure 8: Sensitivity of anomaly scores to noise in the monitoring data