|
FAST '05 Paper
[FAST '05 Technical Program]
I/O System Performance Debugging
Using Model-driven Anomaly Characterization
Kai Shen Ming Zhong Chuanpeng Li
Department of Computer Science, University of Rochester
{kshen, zhong, cli}@cs.rochester.edu
Abstract:
It is challenging to identify performance problems and pinpoint their
root causes in complex systems, especially when the system supports
wide ranges of workloads and when performance problems only materialize under
particular workload conditions. This paper proposes a model-driven
anomaly characterization approach and uses it to discover operating system
performance bugs when supporting disk I/O-intensive online servers. We
construct a whole-system I/O throughput model as the reference of expected
performance and we use statistical clustering and characterization of
performance anomalies to guide debugging.
Unlike previous performance debugging methods offering detailed statistics
at specific execution settings, our approach focuses on comprehensive
anomaly characterization over wide ranges of workload conditions and
system configurations.
Our approach helps us quickly identify four performance bugs in the
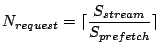
I/O system of the recent Linux 2.6.10 kernel (one in the file system prefetching,
two in the anticipatory I/O scheduler, and one in the elevator I/O scheduler).
Our experiments with two Web server benchmarks, a trace-driven
index searching server, and the TPC-C database benchmark show that the
corrected kernel improves system throughput by up to five-fold compared
with the original kernel
(averaging 6%, 32%, 39%, and 16% for the four server workloads).
It is not uncommon for complex systems to perform worse than expected.
In the context of this paper, we define performance bugs as problems in
system implementation that degrade the performance (compared with
that intended by the design protocol/algorithm). Examples of such
bugs include overly-simplified implementations, mis-management of special
cases, or plain erroneous coding. These bugs, upon discovery, are
typically quite easy to fix in
comparison with implementing newer and better protocol/algorithms.
However, it is challenging to identify performance problems and
pinpoint their root causes in large software systems.
Previous techniques such as
program instrumentation [13,20],
complete system simulation [24],
performance assertion checking [22], and detailed overhead
categorization [9] were proposed to understand
performance problems in complex computer systems and applications.
Some recent performance debugging work employs statistical analysis of
online system traces [1,7] to identify
faulty components in large systems. In general, these techniques focus
on offering fine-grained examination of the target system/application in
specific execution settings. However, many systems (such as the I/O
system in OS) are designed to support wide ranges of workload
conditions and they may also be configured in various different ways.
It is desirable to explore performance anomalies over a comprehensive
universe of execution settings for these systems. Such exploration is
particularly useful for performance debugging without the knowledge of
runtime workload conditions and system configurations.
We propose a new approach that systematically characterizes performance
anomalies in a system to aid performance debugging. The key advantage
is that we can comprehensively consider wide ranges of
workload conditions and system configurations. Our approach proceeds
in the following steps (shown in Figure 1).
- We construct a whole-system performance model according to
the design protocol/algorithms of relevant system components. The
model predicts system performance under different workload conditions
and system configurations.
- We acquire a representative set of anomalous workload and system
configuration settings by comparing measured system performance
with model prediction under a number of sample settings.
For each system component that is considered for debugging,
we include some sample settings where the component is bypassed.
- We statistically cluster anomalous settings into groups likely
attributed to individual ``causes''. We then characterize each
such cause (or bug) with correlated system component and workload
conditions.
Figure 1:
High-level overview of the proposed model-driven anomaly characterization.
 |
The result of our approach contains profiles for potential
performance bugs, each with a system component where the bug is likely
located and the settings (workload conditions and system configurations)
where it would inflict significant performance losses. Such result
then assists further human debugging. It also helps
verifying or explaining bugs after they are discovered. Even if some bugs
could not be immediately fixed, our anomaly characterization identifies
workload conditions and system configurations that should be avoided if
possible.
Note that discrepancies between measured system performance and
model prediction can also be caused by errors in the performance model.
Therefore, we must examine both the performance model and the system
implementation when presented with a bug profile. Since
the performance model is much less complex in nature, we focus on
debugging the system implementation in this paper.
It is possible for our approach to have false positives (producing
characterizations that do not correspond to any real bugs) and false
negatives (missing some bugs in the output). As a debugging aid where
human screening is available, false positives are less of a
concern. In order to achieve low false negatives, we sample wide
ranges of workload parameters and various system configurations in a
systematic fashion.
The rest of this paper presents our approach in details and describes
our experience of discovering operating system performance bugs when
supporting disk I/O-intensive online servers. Although our results
in this paper focus on one target system and one type of workloads,
we believe that the proposed model-driven anomaly characterization
approach is general. It may assist the performance debugging of
other systems and workloads as long as comprehensive performance
models can be built for them.
2 Background
The targeted workloads in this work are data-intensive online servers
that access large disk-resident datasets while serving multiple clients
simultaneously. Examples include Web servers hosting large datasets
and keyword search engines that support interactive search on terabytes
of indexed Web pages.
In these servers, each incoming request is serviced by a request handler
which can be a thread in a multi-threaded server or a series of event
handlers in an event-driven server. The request handler repeatedly
accesses disk data and consumes CPU before completion.
A request handler may block if the needed resource is unavailable.
While request handlers consume both disk I/O
and CPU resources, the overall server throughput is often dominated by
I/O system performance when application data size far exceeds available
server memory.
For the ease of model construction in the next section, we assume
that request handlers perform mostly read-only I/O when accessing
disk-resident data. Many online services, such
as Web server and index searching, do not involve any updates on
hosted datasets.
Characteristics of the application workload may affect the performance
of a disk I/O-intensive online server. For example, the data access
locality and sequentiality largely determine how much of
the disk time is spent on data transfer or seek and rotation.
We describe operating system features that affect the I/O
performance of data-intensive online servers.
Prefetching.
Data accesses belonging to a single request handler often exhibit
strong locality due to semantic proximity. During concurrent execution,
however, data access of one request handler can be frequently
interrupted by other active request handlers in the server. This may
severely affect I/O efficiency due to long disk seek and rotational
delays. The employment of OS prefetching can partially alleviate this
problem. A larger prefetching depth increases the granularity of I/O
requests, and consequently yields less frequent disk seeks and rotations.
On the other hand, kernel-level prefetching may retrieve unneeded data
due to the lack of knowledge on how much data is desired by the
application. Such a waste tends to be magnified by aggressive
prefetching policies.
I/O scheduling.
Traditional elevator-style I/O schedulers such as Cyclic-SCAN sort and
merge outstanding I/O requests to reduce the seek distance on storage
devices. In addition,
the anticipatory I/O scheduling [14] can be particularly
effective for concurrent I/O workloads. At the completion of an I/O
request, the anticipatory disk scheduler may choose to keep the disk
idle for a short period of time even when there are pending requests.
The scheduler does so in anticipation of a new I/O request from the
same process that issued the just completed request, which often
requires little or no seeking from the current disk head location.
However, anticipatory scheduling may not be effective when substantial
think time exists between consecutive I/O requests.
The anticipation may also be rendered ineffective when a request
handler has to perform interleaving synchronous I/O that does
not exhibit strong locality. Such a situation arises when a request
handler simultaneously accesses multiple data streams.
Others.
For data-intensive workloads, memory caching is effective in improving
the application-perceived performance over the raw storage I/O throughput.
Most operating systems employ LRU-style policies to manage data
cached in memory.
File system implementation issues such as
file layout can also affect the system performance.
We assume the file data is laid out contiguously on the storage. This
is a reasonable assumption since the OS often tries to allocate file
data contiguously on creation and the dataset is unchanged under our
targeted read-only workloads.
3 I/O Throughput Model
Our model-driven performance debugging requires model-based prediction
of the overall system performance under wide ranges of workload conditions
and various system configurations.
Previous studies have recognized the importance of constructing I/O system
performance models.
Various analytical and
simulation models have been constructed for disk drives [5,16,25,28,36],
disk arrays [8,33],
OS prefetching [6,29,31],
and memory caching [15].
However, performance models for individual system components do not
capture the inter-dependence of different components and consequently
they may not accurately predict the overall application performance.
When modeling a complex system like ours, we follow the methodology
of decomposing it into weakly coupled subcomponents.
More specifically, we divide our whole-system I/O throughput model into
four layers -- OS caching, prefetching, OS-level I/O scheduling, and the
storage device. Every layer
may transform its input workload to a new workload imposed on the lower layer.
For example,
I/O scheduling may alter inter-request I/O seek distances.
Each layer may also change the predicted I/O throughput from the lower layer
due to additional benefits or costs it may induce. For instance,
prefetching adds the potential overhead of fetching unneeded data.
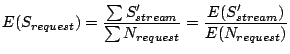
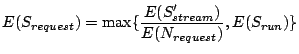
As indicated in Figure 2, we use  , ,  , ,
 , and , and
 to denote the original and transformed
workloads at each layer. We similarly use to denote the original and transformed
workloads at each layer. We similarly use
 , ,
 , ,
 , and , and
 to represent the I/O throughput
results seen at each layer. to represent the I/O throughput
results seen at each layer.
Figure 2:
Layered system model on I/O throughput. We bypass the OS
caching model in the context of this paper.
 |
Figure 2 illustrates our layered system model on I/O
throughput. This paper focuses on the I/O system performance debugging
and we bypass the OS caching model in our study. For the purpose of
comparing our performance model with real system measurement, we add
additional code in the operating system to disable the caching. More
information on this is provided in Section 4.1.
The rest of this section illustrates the other three layers of the I/O
throughput model in detail. While mostly applicable to many
general-purpose OSes, our model more closely follows the target system
of our debugging work -- the Linux 2.6 kernel.
3.1 OS Prefetching Model
We define a sequential access stream as a group of spatially contiguous
data items that are accessed by a single request handler. Note that the
request handler may not continuously access the entire stream at once. In
other words, it may perform interleaving I/O that does not belong to the
same stream. We further define a sequential access run as a portion
of a sequential access stream that does not have such interleaving I/O.
Figure 3 illustrates these two concepts. All read
accesses from request handlers are assumed to be synchronous.
Figure 3:
Illustration of the sequential access stream and the sequential access
run. The arrows indicate the data access sequence of the request handler.
 |
We consider the workload transformation of I/O prefetching
on a sequential access stream of length
 . I/O prefetching groups
data accesses of the stream into requests of size . I/O prefetching groups
data accesses of the stream into requests of size
 --
the I/O prefetching depth. Therefore, the number of I/O requests
for serving this sequential stream is: --
the I/O prefetching depth. Therefore, the number of I/O requests
for serving this sequential stream is:
 |
(1) |
Operating system prefetching may retrieve unneeded data due to the lack of
knowledge on how much data is desired by the application. In the
transformed workload, the total amount of fetched data for the stream is:
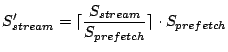 |
(2) |
Within the amount of fetched data
 , the effective amount is only
while the rest is not needed by the application. Therefore: , the effective amount is only
while the rest is not needed by the application. Therefore:
 |
(3) |
However, wasted prefetching does not exist when each sequential access stream
references a whole file since the OS would not prefetch beyond the end of a
file. In this case, I/O prefetching does not fetch unneeded data and it
does not change the I/O throughput. Therefore:
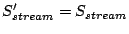 |
(4) |
 |
(5) |
3.2 OS-level I/O Scheduling Model
The I/O scheduling layer passes the retrieved data to the upper layer
without any change. Therefore it does not change the I/O throughput:
 |
(6) |
I/O scheduling transforms the workload primarily by sorting and merging
I/O requests to reduce the seek distance on storage devices.
We discuss such workload transformation by the traditional elevator-style
I/O scheduling and by the anticipatory I/O scheduling.
3.2.1 Elevator-style I/O Scheduling
I/O scheduling algorithms such as Cyclic-SCAN reorder outstanding
I/O requests based on data location and schedule the I/O request close
to the current disk head location. The effectiveness of such scheduling
is affected by the concurrency of the online server. Specifically,
a smaller average seek distance can be attained at higher server concurrency
when the disk scheduler can choose from more concurrent requests for seek
reduction.
We estimate that the number of simultaneous disk seek requests in the SCAN queue
is equal to the server concurrency level  . When the disk scheduler
can choose from requests at uniformly random disk locations, a
previous study [27] indicates that the inter-request seek
distance . When the disk scheduler
can choose from requests at uniformly random disk locations, a
previous study [27] indicates that the inter-request seek
distance  follows the following distribution: follows the following distribution:
![$\displaystyle Pr[D_{seek} \geq x] = (1-{x\over {\delta \cdot D_{disk}}})^\gamma$](img23.gif) |
(7) |
Here  is the proportion of the disk where the dataset resides
and is the proportion of the disk where the dataset resides
and  is the total disk size.
In other words, is the total disk size.
In other words,
 represents the span of the dataset
on the disk. represents the span of the dataset
on the disk.
During concurrent execution (concurrency greater than one), the I/O
scheduler switches to a different stream when a prefetching request
from one stream is completed. Therefore it does not change the
granularity of I/O requests passed from the prefetching layer.
Consequently the average size of an I/O request is:
 |
(8) |
At the concurrency of one, all I/O requests belonging to one sequential access
run is merged:
 |
(9) |
where
 is the average length of a sequential access run. is the average length of a sequential access run.
3.2.2 Anticipatory I/O Scheduling
During concurrent execution, the anticipatory I/O scheduling [14]
may temporarily idle the disk so that consecutive I/O requests that belong
to the same request handler are serviced without interruption. This
effectively merges all prefetching requests of each sequential access run
(defined in Section 3.1) into a single I/O request.
Thus the average size of an I/O request in the transformed workload is:
|
(10) |
The anticipatory I/O scheduling likely reduces the frequency of disk seeks,
but it does not affect the the inter-request seek distance modeled in
Equation (7).
The other effect of the anticipatory I/O scheduling is that it induces
disk idle time during anticipatory waiting when useful work could be
otherwise performed. The disk idle time for each I/O request  is the total inter-request thinktime for the corresponding sequential
access run.
is the total inter-request thinktime for the corresponding sequential
access run.
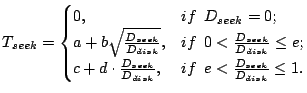
Let the disk transfer rate be  . Also let the seek time and
rotational delay be . Also let the seek time and
rotational delay be  and and
 respectively. The disk
resource consumption (in time) for processing a request of length respectively. The disk
resource consumption (in time) for processing a request of length
 includes a single seek, rotation, and the data transfer as well as the
idle time:
includes a single seek, rotation, and the data transfer as well as the
idle time:
 |
(11) |
Since
is independent of , we have:
 |
(12) |
Therefore:
 |
(13) |
Below we determine the average data transfer rate  , the average
rotation delay , the average
rotation delay
 , and the average seek time , and the average seek time
 .
The sequential transfer rate depends on
the data location (due to zoning on modern disks). With the knowledge of
the data span on the disk and the histogram of data transfer rate at each
disk location, we can then determine the average data transfer rate.
We consider the average rotational delay as the mean rotational time
between two random track locations (i.e., the time it takes the
disk to spin half a revolution). .
The sequential transfer rate depends on
the data location (due to zoning on modern disks). With the knowledge of
the data span on the disk and the histogram of data transfer rate at each
disk location, we can then determine the average data transfer rate.
We consider the average rotational delay as the mean rotational time
between two random track locations (i.e., the time it takes the
disk to spin half a revolution).
Earlier studies [25,28] have discovered that
the seek time depends on the seek distance (distance to be
traveled by the disk head) in the following way:
where is the total disk size.  are disk-specific
parameters and are disk-specific
parameters and
 . .
Combining the seek distance distribution in Equation (7) and
the above Equation (14), we have the following cumulative
probability distribution for the seek time:
Therefore, the expected average seek time is:
![\begin{displaymath}\begin{split}&E(T_{seek}) &= \int_0^a Pr[T_{seek} \geq x] ...
...a \choose i}$ indicates the binomial coefficient.} \end{split}\end{displaymath}](img45.gif) |
(16) |
Disk drives are usually equipped with limited amount of cache. Due to its
small size, its main usage is disk track prefetching while its caching
effects are negligible for data-intensive applications with large
working-set sizes. We do not consider such caching effects in our model.
For clarity, we list the definitions for all symbols used in the
previous subsections (Table 1).
Table 1:
Definition of symbols used in Section 3.
| Symbol |
Definition |
|
,
|
original and transformed sequential access stream lengths |
 |
the sequential access run length |
|
|
I/O prefetching depth |
 |
the number of I/O prefetching requests for accessing a stream |
|
|
the I/O request size |
|
|
the number of concurrent request executions in the server |
|
, |
the seek distance and the total disk size |
|
|
the proportion of the dataset span to the total disk size |
,
,
,

|
the disk seek, rotation, idle, and total usage time |
|
|
the disk data transfer rate |
 , ,  , ,  , ,  , ,  |
disk-specific parameters concerning the disk seek time |
|
3.5 Model Interfaces
We summarize the interfaces to our performance model, which include the
workload characteristics, operating system configuration, and storage
device properties.
- Table 2 lists the attributes of
workload characteristics passed into our model.
The table also lists the OS component in our performance model that is
most concerned with each workload attribute.
- The OS configuration consists of the I/O prefetching depth and
whether to employ the anticipatory I/O scheduler or the classic elevator
scheduler.
- The storage device properties include the disk size, rotational
speed, seek time model parameters of Equation (14),
and the histogram of data transfer rate at each disk location.
Table 2:
Attributes of workload characteristics. We also list the OS
component in our performance model that is most concerned with each
workload attribute.
| Workload attribute |
Unit |
Concerned OS component |
|
server concurrency |
a number |
I/O scheduling (Section 3.2) |
|
data span on storage medium |
ratio to the disk size |
I/O scheduling (Section 3.2) |
|
lengths of sequential access streams |
a histogram |
I/O prefetching (Section 3.1) |
|
whether each stream access whole file |
true or false |
I/O prefetching (Section 3.1) |
|
average sequential access run length |
unit of data size |
anticipatory I/O scheduling (Section 3.2.2) |
|
average application thinktime |
unit of time |
anticipatory I/O scheduling (Section 3.2.2) |
|
4 Model-driven Performance Debugging
Based on the whole-system performance model for I/O-intensive online
servers, this section describes our approach to acquire a representative
set of anomalous workload and configuration settings. We also present
techniques to cluster anomalous settings into groups likely attributed
to individual bugs. We then characterize each of them with correlated
system component and workload conditions. Although
certain low-level techniques in our approach are specifically designed for
our target system and workloads, we believe the general framework of our
approach can also be used for performance debugging of other large
software systems.
4.1 Anomaly Sampling
Performance anomalies (manifested by deviations of measurement results
from the model-predicted performance) occur for several reasons. In
addition to performance bugs in the implementation, measurement errors
and model inaccuracies can also cause performance anomalies. Aside
from significant modeling errors, anomalies caused by these other factors are
usually small in magnitude. We screen out these factors by only counting
the relatively large performance anomalies. Although this screening may
also overlook some performance bugs, those that cause significant
performance degradations would not be affected.
Performance anomalies may occur at many different workload conditions
and system configurations. We consider each occurrence under one setting
as a single point in the multi-dimensional space where each workload
condition and system configuration parameter is represented by a dimension.
For the rest of this paper, we call this multi-dimensional space simply
as the parameter space. Our anomaly sampling proceeds in the
following two steps. First, we choose a number of ( ) sample settings
from the parameter space in a uniformly random fashion. We then compare
measured system performance with model prediction under these
settings. Anomalous settings are those at which measured performance
trails model prediction by at least a certain threshold. ) sample settings
from the parameter space in a uniformly random fashion. We then compare
measured system performance with model prediction under these
settings. Anomalous settings are those at which measured performance
trails model prediction by at least a certain threshold.
We define the infliction zone of each performance bug as the union
of settings in the parameter space at which the bug would inflict
significant performance losses. By examining a uniformly random set of
sample settings, our anomaly sampling approach can achieve the following
property associated with false negatives (missing some bugs).
For a bug whose infliction zone is  proportion
( proportion
(
 ) of the total parameter space, the probability for at
least one of our random samples falls into the bug's infliction zone
is ) of the total parameter space, the probability for at
least one of our random samples falls into the bug's infliction zone
is  . With a reasonably large , it is unlikely for our
anomaly sampling to miss a performance bug that takes effects under a
non-trivial set of workload conditions and system configurations. . With a reasonably large , it is unlikely for our
anomaly sampling to miss a performance bug that takes effects under a
non-trivial set of workload conditions and system configurations.
We now describe the parameter space for our target workload and system.
We first explore the dimensions representing workload properties and
we will examine the system configuration dimensions next.
The inclusion of each workload property in the parameter space allows
the characterization of its relationship with performance bugs in
subsequent analysis. However, considering too many workload properties
may render the subsequent analysis intractable.
According to our performance model in Section 3, we
select workload properties from those that have large effects on
system performance.
For each workload property, we determine several representative parameter
settings for possible sampling.
- Server concurrency: 1, 2, 4, 8, 16, 32, 64, 128, 256.
- Average length of sequential access streams:
64KB, 128KB, 256KB, 512KB, 1MB, 2MB, 4MB.
- Whether each stream access whole file: true or false.
- Average length of sequential access runs:
16KB, 32KB, 64KB,
 , up to the average length of
sequential access streams. , up to the average length of
sequential access streams.
- Average application thinktime per megabyte of data access:
1ms, 2ms, 4ms, 8ms.
For the purpose of real system measurement, we design an adjustable
micro-benchmark that can exhibit any combination of workload
parameter settings.
The inclusion of system configurations in the parameter space allows the
characterization of their relationships with performance bugs in subsequent
analysis. In particular, the strong correlation between a performance bug
and the activation of a system component indicates the likelihood that the
bug is within the implementation of the said component. As indicated in
our performance model, the system performance is mainly affected by three
I/O system components: prefetching, the elevator I/O scheduler and the
anticipatory I/O scheduler.
For each system component that is considered for debugging,
we must include system configurations where the component is not activated.
The two I/O schedulers are natural alternatives to each other. We augment
the operating system to add an option to bypass the prefetching code. We
do so by ignoring the readahead heuristics and issuing I/O requests only
when data is synchronously demanded by the application. Since our performance
model does not consider OS caching, we also add additional code in the operating
system to disable the caching. We do so by simply overlooking the cached
pages during I/O.
Our changes are only a few hundred lines in the Linux 2.6.10 kernel.
Below are the specific dimensions in our parameter space that represent
system configurations:
- Prefetching: enabled or disabled.
- I/O scheduling: elevator or anticipatory.
Our performance model in Section 3 can predict system
performance at different prefetching sizes. However, varying the prefetching
size is not useful for our purpose of performance debugging. We use the
default maximum prefetching size (128KB for Linux 2.6.10) in our study.
4.2 Anomaly Clustering and Characterization
Given a set of anomalous workload condition and system configuration
settings, it is still hard to derive useful debugging information
without a succinct characterization on the anomalous settings.
Further, the system may contain multiple independent performance bugs and
the aggregate characteristics of several bugs may be too confusing to be
useful. This section presents an algorithm to cluster anomalous settings
into groups likely attributed to individual bugs and characterize each
cluster to guide performance debugging. At a high level, the anomaly
sampling described in Section 4.1 precedes the
clustering and characterization, which are then followed by the final
human debugging. Ideally, each such action sequence can discover one
performance bug and multiple bugs can be identified by iterating this
action sequence multiple times.
It is quite common for infliction zones of multiple bugs to
cross-intersect with each other. In other words, several bugs might
inflict performance losses simultaneously at a single workload condition
and system configuration. Classical clustering algorithms such as
Expectation Maximization (EM) [10] and K-means [19]
typically assume disjoint (or slightly overlapped) clusters and
spherical Gaussian distribution for points in each cluster. Therefore
they cannot be directly used to solve our problem.
To make our clustering problem more tractable, we assume that the
infliction zone of each performance bug takes a hyper-rectangle-like
shape in the parameter space. This means that if parameter settings
 and and
 in the in the  -dimensional
parameter space are inflicted by a bug, then any parameter setting -dimensional
parameter space are inflicted by a bug, then any parameter setting
 with with
also likely falls into the bug's infliction zone. For each dimension  that has no ordering among its value settings (e.g., a boolean or
categorical parameter), the corresponding element in
Condition (17) should be instead ``
that has no ordering among its value settings (e.g., a boolean or
categorical parameter), the corresponding element in
Condition (17) should be instead `` or or  ''. ''.
A bug's infliction zone takes a hyper-rectangle-like shape if it has a
range of triggering settings on each parameter (workload property or system
configuration) and the bug's performance effect is strongly correlated with
the condition that all parameters fall into respective triggering ranges.
When this assumption does not hold for a bug (i.e., its infliction
zone does not follow a hyper-rectangle-like shape), our algorithm
described below would identify a maximum hyper-rectangle encapsulated
within the bug's infliction zone. This might still provide some useful
bug characterization for subsequent human debugging.
To the best of our knowledge, the only known clustering algorithm that handles
intersected hyper-rectangles is due to Pelleg and Moore [21].
However, their algorithm requires hyper-rectangles to have soft boundaries
with Gaussian distributions and hence is not directly applicable to our case,
where hyper-rectangles could have infinitely steeply diminishing borders.
We describe our algorithm that identifies and characterizes one dominant
cluster from a set of anomalous settings.
More specifically, our algorithm attempts to identify a hyper-rectangle in
the parameter space that explores trade-off between two properties:
1) Most of the sample settings within the hyper-rectangle are anomalous
settings; 2) The hyper-rectangle contains as many anomalous settings as
possible. In our algorithm, property 1 is ensured by keeping the ratio of
 in the hyper-rectangle
above a certain pre-defined threshold.
Property 2 is addressed by greedily expanding the current hyper-rectangle
in a way to maximize the number of anomalous settings contained in the
expanded new hyper-rectangle. Algorithm 4.1 illustrates
our method to discover a hyper-rectangle that tightly bounds the cluster
of anomalous settings related to a dominant bug. in the hyper-rectangle
above a certain pre-defined threshold.
Property 2 is addressed by greedily expanding the current hyper-rectangle
in a way to maximize the number of anomalous settings contained in the
expanded new hyper-rectangle. Algorithm 4.1 illustrates
our method to discover a hyper-rectangle that tightly bounds the cluster
of anomalous settings related to a dominant bug.
![\begin{figure}\begin{center}
\begin{pseudocode}[ruled]{Cluster}{\text{$n$ sampl...
...and the point $y$. */}
\end{pseudocode}\end{center}\vspace*{-0.3in}
\end{figure}](img68.gif)
After the hyper-rectangle clustering, we characterize each cluster by
simply projecting the hyper-rectangle onto each dimension of the parameter
space. For each dimension (a workload property or a system configuration),
we include the projected parameter value range into the characterization.
For those dimensions at which the projections cover all possible parameter
values, we consider them uncorrelated to the cluster and we do not include
them in the cluster characterization.
The computation complexity of our algorithm is  since the algorithm
has three nested loops with at most since the algorithm
has three nested loops with at most  iterations for each. In the
innermost loop, the numbers of samples and anomalies within a hyper-rectangle
are computed by brute-force checking of all sample settings (an iterations for each. In the
innermost loop, the numbers of samples and anomalies within a hyper-rectangle
are computed by brute-force checking of all sample settings (an
 complexity).
Using pre-constructed orthogonal range trees [18], the
complexity of the innermost loop can be improved to complexity).
Using pre-constructed orthogonal range trees [18], the
complexity of the innermost loop can be improved to
 ,
where is the dimensionality of the parameter space and ,
where is the dimensionality of the parameter space and  is the answer
size. We use brute-force counting in our current implementation
due to its simplicity and satisfactory performance on our dataset (no more
than 1000 sample settings and less than 200 anomalies). is the answer
size. We use brute-force counting in our current implementation
due to its simplicity and satisfactory performance on our dataset (no more
than 1000 sample settings and less than 200 anomalies).
5 Debugging Results
We describe our performance debugging of the Linux 2.6.10 kernel (released
in December 2004) when supporting I/O-intensive online servers.
We repeatedly perform anomaly sampling, clustering, characterization,
and human debugging.
After each round, we acquire an anomaly cluster characterization that
corresponds to one likely bug. The characterization typically contains
correlated system component and workload conditions, which hints at
where and how to look for the bug. The human debugger has knowledge
on the general structure of the OS source code and is familiar with a kernel
tracing tool (LTT [37]). After each bug fix, we use the
corrected kernel for the next round of anomaly sampling, clustering,
characterization, and human debugging.
Our measurement uses a server equipped with dual 2.0GHz Xeon processors,
2GB memory, and an IBM 10KRPM SCSI drive (model "DTN036C1UCDY10").
We measure the disk drive properties as input to our performance model
(shown in Figure 4). The Equation (14)
parameters for this disk is
= ms, = ms, = ms, = ms, = ms, = ms, = ms, and
= ms, and
= . We choose 400
random workload and system configuration settings in the anomaly sampling.
The anomaly threshold is set at 10% (i.e., those settings at which
measured performance trails model prediction by at least 10% are
considered as anomalous settings). The clustering threshold ( . We choose 400
random workload and system configuration settings in the anomaly sampling.
The anomaly threshold is set at 10% (i.e., those settings at which
measured performance trails model prediction by at least 10% are
considered as anomalous settings). The clustering threshold ( )
in Algorithm 4.1 is set at 90%. )
in Algorithm 4.1 is set at 90%.
Figure 4:
Data transfer rate and seek time curve for the disk drive. We
also show the seek time fitting used in Equation (14)
of our performance model.
 |
We describe our results below and we also report the debugging time at
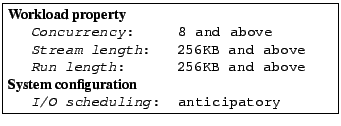
the end of this section. The first anomaly cluster characterization is:
This characterization shows that the corresponding bug concerns the
prefetching implementation and it inflicts performance losses for
high concurrency workloads with moderately long sequential access
streams. Based on this information, our subsequent tracing and
analysis discover the following performance bug. The kernel checks
for disk congestion when each I/O prefetching is initiated. If the
number of pending requests in the disk driver queue exceeds a certain
threshold (slightly below 128 in Linux 2.6.10),
the prefetching is canceled. The intuition
for this treatment is that asynchronous read-ahead should be
disabled when the I/O system is busy. However, the prefetching
operations may include some data that is synchronously demanded by
the application. By canceling these operations, it causes confusion
at upper-level I/O code and results in inefficient single-page makeup
I/Os for the needed data. In order to fix this problem, the corrected
kernel only cancels prefetching requests that do not contain any
synchronously demanded data when disk congestion occurs. We call this
bug fix #1.
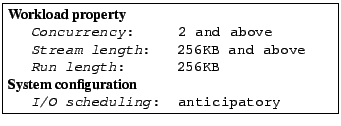
The second anomaly cluster characterization is:
This characterization concerns the anticipatory I/O scheduler. It
involves workloads at moderately high concurrency with stream and run
lengths larger than the maximum prefetching size (128KB). Our
subsequent investigation discovers the following performance bug.
The current implementation of the anticipatory scheduler stops an
ongoing anticipation if there exists a pending I/O request with
shorter seek distance (compared with the average seek distance
of the anticipating process). Due to a significant seek initiation
cost on modern disks (as shown in Figure 4),
the seek distance is not an accurate indication of the seek time cost.
For example, the average cost of a 0-distance seek and a  -distance
seek is much less than an -distance
seek is much less than an  -distance seek. As the result, the
current implementation tends to stop the anticipation when the
benefit of continued anticipation actually exceeds that of breaking it.
We solve this problem by using estimated seek time (instead of the
seek distance) in the anticipation cost/benefit analysis.
We call this bug fix #2. -distance seek. As the result, the
current implementation tends to stop the anticipation when the
benefit of continued anticipation actually exceeds that of breaking it.
We solve this problem by using estimated seek time (instead of the
seek distance) in the anticipation cost/benefit analysis.
We call this bug fix #2.
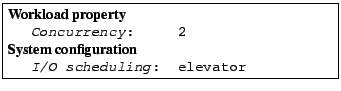
The third anomaly cluster characterization is:
This characterization concerns the elevator scheduler (also called
the deadline scheduler in Linux 2.6.10) and the corresponding bug
inflicts performance losses at the concurrency of 2. Our tracing and
analysis show that a reset function is called frequently
at very low concurrency. Possibly due to an overly-simplified
implementation, the kernel always searches from block address 0
for the next scheduled request after the
reset. We fix it by searching from the last I/O location according to
the elevator scheduling algorithm. We call this bug fix #3.
The fourth anomaly cluster characterization is:
This characterization concerns the anticipatory I/O scheduler for non-serial
concurrent workloads. Our subsequent investigation
uncovers the following problem. Large I/O requests (including maximum-sized
prefetching requests) from the file system are often split into smaller
pieces
before being forwarded to the disk drive. The completion
of each one of these pieces will trigger an I/O interrupt. The original
anticipatory scheduler would start the anticipation timer right after the
first such interrupt, which often causes premature timeout. We correct
the problem by starting the anticipation timer only after all pieces of a
file system I/O request have completed. We call this bug fix #4.
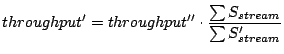
We show results on the effects of our bug fixes.
Figure 5 shows the top 10% model/measurement errors of
our anomaly sampling for the original Linux 2.6.10 kernel and after the
accumulative bug fixes. The error is defined as
``
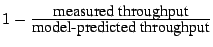 ''.
Results show that performance anomalies steadily decrease after each
bug fix and no anomaly with 14% or larger error exists after all four
bugs are fixed.
Figure 6 illustrates all-sample comparison between
model prediction and measured performance. Figure 6(A)
shows results for the original Linux 2.6.10 where the system performs
significantly worse than model prediction at many parameter settings.
Figure 6(B) shows the results when all four bugs are
fixed where the system performs close to model prediction at all parameter
settings. ''.
Results show that performance anomalies steadily decrease after each
bug fix and no anomaly with 14% or larger error exists after all four
bugs are fixed.
Figure 6 illustrates all-sample comparison between
model prediction and measured performance. Figure 6(A)
shows results for the original Linux 2.6.10 where the system performs
significantly worse than model prediction at many parameter settings.
Figure 6(B) shows the results when all four bugs are
fixed where the system performs close to model prediction at all parameter
settings.
Figure 5:
Top 10% model/measurement errors. Each unit on the X-axis
represents a sampled parameter setting in our anomaly sampling.
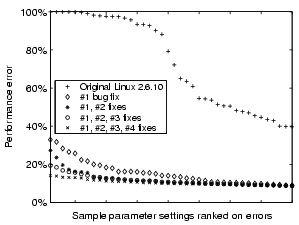 |
Figure 6:
All-sample comparison between model prediction and measured performance.
Each unit on the X-axis represents a sampled parameter setting in our anomaly sampling.
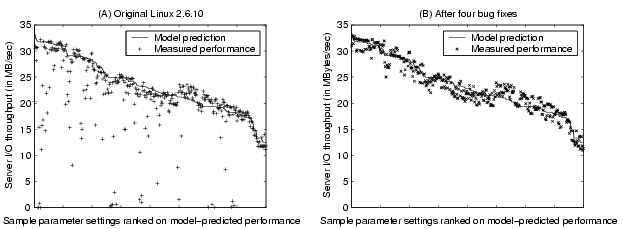 |
We provide statistics on the debugging time. For each bug fix, time is spent
on anomaly sampling, clustering and characterization, and final human
debugging.
- The primary time cost for anomaly sampling is on the system
measurement for all sample workload condition and system configuration
settings. The measurement of each sample setting took around 6 minutes
and the total 400 sample measurements took around two days using one test
server. More test servers would speed up this process proportionally.
- Due to the relative small sample size, our clustering and characterization
algorithm took less than a minute to complete.
- The final human debugging took about one or two days for each bug fix.
6 Evaluation with Real Workloads
We experiment with real server workloads to demonstrate the performance
benefits of our bug fixes.
All measurements are conducted on servers each equipped with dual
2.0GHz Xeon processors, 2GB memory, and an IBM 10KRPM SCSI drive
(as characterized in Figure 4).
Each experiment involves a server and a load generation client. The
client can adjust the number of simultaneous requests to control the
server concurrency level.
6.1 Workload Descriptions
We evaluate four server workloads in our study:
- SPECweb99:
We include the SPECweb99 benchmark [30] running on the
Apache 2.0.44 Web server.
This workload contains 4 classes of files with sizes at 1KB, 10KB,
100KB, and 1,000KB respectively.
During each run, the four classes of files are accessed according
to a distribution that favors small files. Within each class, a Zipf
distribution with parameter
 is used to access individual files. is used to access individual files.
- Media clips: Web workloads such as SPECweb99 contain mostly
small file accesses. In order to examine the effects of relatively large
sequential access streams, we use a Web workload containing a set of media
clips, following the file size
and access distribution of the video/audio clips portion of the
1998 World Cup workload [3]. About 67% (in total size) of
files in the workload are large video clips, while the rest are small audio
clips. The file sizes of both small and large clips follow Lognormal
distributions, with average sizes of 20KB and 1,464KB respectively.
During the tests, individual media files are chosen as client requests in
a uniformly random fashion.
- Index searching: We acquired a prototype of the
index searching server and a dataset from the Web search engine Ask
Jeeves [4]. The dataset contains the search index for
12.6 million Web pages. It includes a
mapping file that maps MD5-encoded keywords to proper locations in the
search index.
For each keyword in an input query, a binary search is first performed
on the mapping file and then the search index is accessed following a
sequential access pattern. Multiple prefetching streams on the
search index are accessed for each multi-keyword query.
The search query words in our test workload are based on a one-week
trace recorded at the Ask Jeeves site in early 2002.
- TPC-C database benchmark:
We include a local implementation of the TPC-C online transaction
processing benchmark [32] in our evaluation. TPC-C simulates
a population of terminal operators executing Order-Entry transactions
against a database. Some of the TPC-C transactions do not consume
much I/O resource. We use a workload that contains only the ``new order''
transactions, which are the most I/O-intensive among five types of
TPC-C transactions. In our experiments, the TPC-C
benchmark runs on the MySQL 5.0.2-alpha database with a dataset of 8.8GB.
To better understand these workloads, we extract their characteristics
through profiling. During profiling runs, we intercept relevant I/O system
calls in the OS kernel, including open, close,
read, write, and seek.
We extract desired application characteristics after analyzing the system
call traces collected during profiling runs.
However, system call interception does not work well for memory mapped I/O
used by the TPC-C database. In this case, we intercept device
driver-level I/O traces and use them to infer the data access pattern of
the workload.
Table 3 lists some characteristics of the four server
workloads. The stream statistics for TPC-C are for read streams only.
Among the four workloads, we observe that media clips has long
sequential access streams while SPECweb99 and TPC-C have relatively
short streams. We also observe that the three workloads except the index
searching have about one run per stream, which indicates that each request
handler does not perform interleaving I/O when accessing a sequential stream.
Table 3:
Characteristics of four server workloads used in our evaluation.
| Workload |
Data size |
Data popularity |
Whole file access |
Mean stream len. |
Runs/stream |
Thinktime/MB |
|
SPECweb99 |
22.4GB |
Zipf |
yes |
67.2KB |
1.00 |
1.11ms |
|
Media clips |
27.2GB |
Uniformly random |
yes |
1213.3KB |
1.01 |
1.78ms |
|
Index searching |
18.5GB |
Trace-driven |
no |
267.2KB |
1.75 |
0.22ms |
|
TPC-C |
8.8GB |
Uniformly random |
no |
43.8KB |
1.00 |
11.69ms |
|
Figure 7 illustrates the throughput of the four server
workloads. For each workload, we show measured performance at different
concurrency levels under the original Linux kernel and after various performance
bug fixes.
The elevator I/O scheduler is employed for SPECweb99 and media clips while
the anticipatory I/O scheduler is used for index searching and TPC-C.
Therefore bug fix #3 is only meaningful for SPECweb99 and media clips
while fixes #2 and #4 are only useful for index searching and TPC-C.
The I/O throughput results are those observed at the application level.
They are acquired by instrumenting the server
applications with statistics-collection code. We were not able to make
such instrumentation for the MySQL database used by TPC-C so we only
show the request throughput for this workload.
Figure 7:
Throughput of four server workloads under various kernels.
The elevator I/O scheduler is employed for SPECweb99 and media clips while
the anticipatory I/O scheduler is used for index searching and TPC-C.
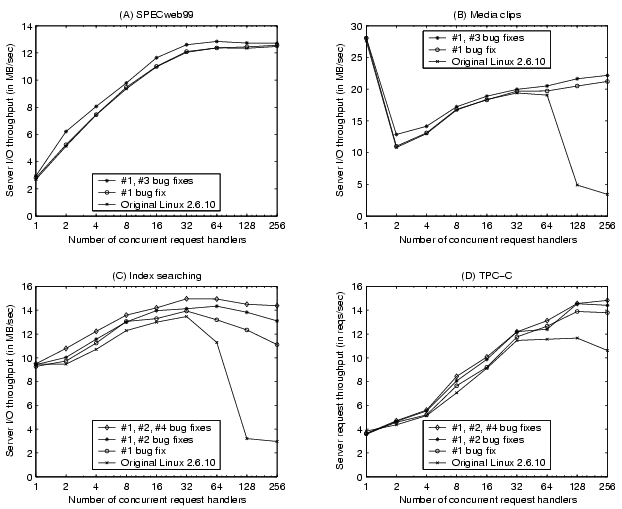 |
Suggested by the characterization of bug #1,
Figure 7(B) and (C) confirm substantial performance
improvement (around five-fold) of the bug fix at high execution
concurrencies. We notice that its effect is not as obvious for SPECweb99
and TPC-C. This can also be explained by our characterization of
bug #1 since these workloads do not have long enough sequential access
streams. The other bug fixes provide moderate performance enhancement
for workloads that they affect. The average improvement (over all affected
workload conditions) is 6%, 13%, and 4% for bug fix #2, #3, and #4 respectively.
Aggregating the effects of all bug fixes, the average improvement (over
all tested concurrencies) of the corrected kernel over the original kernel
is 6%, 32%, 39%, and 16% for the four server workloads respectively.
7 Related Work
Performance debugging.
Earlier studies have proposed techniques such as program instrumentation
(e.g., MemSpy [20] and Mtool [13]),
complete system simulation (e.g., SimOS [24]),
performance assertion checking [22], and detailed overhead
categorization [9] to understand performance problems in
computer systems and applications. These techniques focus on offering
fine-grained examination of the target system/application in specific
workload settings. Many of them are too expensive to be used for
exploring wide ranges of workload conditions and system configurations.
In comparison, our approach trades off detailed execution statistics at
specific settings for comprehensive characterization of performance
anomalies over wide ranges of workloads.
Recent performance debugging work employs statistical analysis of online
system traces [1,7] to identify faulty
components in complex systems.
Such techniques are limited to reacting to anomalies under past and present
operational environments and they cannot be used to debug a system before
such operational conditions are known. Further, our approach can provide
the additional information of correlated workload conditions with each
potential performance bug, which is helpful to the debugging process.
Identifying non-performance bugs in complex systems.
Several recent works investigated techniques to discover non-performance
bugs in large software systems. Engler et al. detect potential
bugs by identifying anomalous code that deviates from the common
pattern [11]. Wang et al. discover erroneous
system configuration settings by matching with a set of known correct
configurations [34]. Li et al. employ data mining
techniques to identify copy-paste and related bugs in operating system
code [17]. However, performance-oriented debugging can be
more challenging because many performance bugs are strongly connected
with the code semantics and they often do not follow certain patterns.
Further, performance bugs may not cause obvious mis-behaviors such as
incorrect states or system crashes. Without an understanding on the
expected performance (e.g., through the performance model that
we built), it may not even be easy to tell the existence of performance
anomalies in complex systems.
I/O system performance modeling.
Our performance debugging approach requires the construction of a
whole-system performance model for targeted I/O-intensive server workloads.
A large body of previous studies have constructed various analytical and
simulation models to examine the performance of storage and I/O systems,
including those for disk
drives [5,16,25,28,36],
disk arrays [2,8,33], I/O scheduling
algorithms [23,26,35], and
I/O prefetching [6,29,31].
However, performance models for individual system components do not
capture the interplay between different components.
This paper presents a whole-system throughput model that considers the
combined impact of the application characteristics and several relevant
operating system components on the overall server performance.
Using system-level models to predict the performance of I/O-intensive
workloads is not new. Ganger and Patt argued that the I/O subsystem
model must consider the criticality of I/O requests, which is
determined by application and OS behaviors [12].
Shriver et al. studied I/O system performance using a combined disk
and OS prefetching model [29]. However, these
models do not consider recently proposed I/O system features.
In particular, we are not aware of any prior I/O system modeling work
that considers the anticipatory I/O scheduling, which can significantly
affect the performance of our targeted workloads.
8 Conclusion
This paper presents a new performance debugging approach for complex
software systems using model-driven anomaly characterization. In our
approach, we first construct a whole-system performance model according
to the design protocol/algorithms of the target system.
We then acquire a representative set of
anomalous workload settings by comparing measured system performance
with model prediction under a number of sample settings. We
statistically cluster the anomalous settings into groups likely attributed
to individual bugs and characterize them with specific system components
and workload conditions. Compared with previous performance debugging
techniques, the key advantage of our approach is that we can
comprehensively characterize performance anomalies of a complex system
under wide ranges of workload conditions and system configurations.
We employ our approach to quickly identify four performance bugs in the
I/O system of the recent Linux 2.6.10 kernel. Our anomaly characterization
provides hints on the likely system component each performance bug may be located
at and workload conditions for the bug to inflict significant performance
losses. Experimental results demonstrate substantial performance benefits
of our bug fixes on four real server workloads.
This work was supported in part by NSF grants CCR-0306473, ITR/IIS-0312925,
and an NSF CAREER Award CCF-0448413.
We benefited greatly from Athanasios Papathanasiou's expertise in
Linux kernel development and particularly his help in identifying the
cause for the first bug described in Section 5.
We would also like to thank Christopher Stewart, Yuan Sun, and the
anonymous referees for helpful discussions and valuable comments
during the course of this work.
- 1
-
M. K. Aguilera, J. C. Mogul, J. L. Wiener, P. Reynoll ds, and
A. Muthitacharoen.
Performance Debugging for Distributed Systems of Black Boxes.
In Proc. of the 19th ACM SOSP, pages 74-89, Bolton Landing,
NY, October 2003.
- 2
-
E. Anderson, R. Swaminathan, A. Veitch, G. A. Alvarez, and J. Wilkes.
Selecting RAID Levels for Disk Arrays.
In Proc. of the 1st USENIX Conf. on File and Storage
Technologies, pages 189-201, Monterey, CA, January 2002.
- 3
-
M. Arlitt and T. Jin.
Workload Characterization of the 1998 World Cup Web Site.
Technical Report HPL-1999-35, HP Laboratories Palo Alto, 1999.
- 4
-
Ask Jeeves Search.
https://www.ask.com.
- 5
-
R. Barve, E. Shriver, P. B. Gibbons, B. K. Hillyer, Y. Matias, and J. S.
Vitter.
Modeling and Optimizing I/O Throughput of Multiple Disks on A Bus.
In Proc. of the ACM SIGMETRICS, pages 83-92, Atlanta, GA, June
1999.
- 6
-
P. Cao, E. W. Felten, A. R. Karlin, and K. Li.
A Study of Integrated Prefetching and Caching Strategies.
In Proc. of the ACM SIGMETRICS, pages 188-197, Ottawa, Canada,
June 1995.
- 7
-
M. Chen, E. Kiciman, E. Fratkin, A. Fox, and E. Brewer.
Pinpoint: Problem Determination in Large, Dynamic Systems.
In Proc. of Int'l Conf. on Dependable Systems and Networks,
pages 595-604, Washington, DC, June 2002.
- 8
-
P. M. Chen, G. A. Gibson, R. H. Katz, and D. A. Patterson.
An Evaluation of Redundant Arrays of Disks using an Amdahl 5890.
In Proc. of the ACM SIGMETRICS, pages 74-85, Boulder, CO, May
1990.
- 9
-
M. E. Crovella and T. J. LeBlanc.
Parallel Performance Prediction Using Lost Cycles Analysis.
In Proc. of SuperComputing, pages 600-610, Washington, DC,
November 1994.
- 10
-
A. P. Dempster, N. M. Laird, and D. B. Rubin.
Maximum Likelihood from Incomplete Data Via the EM Algorithm.
Journal of the Royal Statistical Society, Series B, (1):1-38,
1977.
- 11
-
D. Engler, D. Chen, S. Hallem, A. Chou, and B. Chelf.
Bugs as Deviant Behavior: A General Approach to Inferring Errors in
Systems Code.
In Proc. of the 18th ACM SOSP, pages 57-72, Banff, Canada,
October 2001.
- 12
-
G. R. Ganger and Y. N. Patt.
Using System-Level Models to Evaluate I/O Subsystem Designs.
IEEE Trans. on Computers, 47(6):667-678, June 1998.
- 13
-
A. J. Goldberg and J. L. Hennessy.
Mtool: An Integrated System for Performance Debugging Shared Memory
Multiprocessor Applications.
IEEE Trans. on Parallel and Distributed Systems, 4(1):28-40,
January 1993.
- 14
-
S. Iyer and P. Druschel.
Anticipatory Scheduling: A Disk Scheduling Framework to Overcome
Deceptive Idleness in Synchronous I/O.
In Proc. of the 18th ACM SOSP, pages 117-130, Banff, Canada,
October 2001.
- 15
-
P. Jelenkovic and A. Radovanovic.
The Persistent-Access-Caching Algorithm.
Technical Report EE-2004-03-05, Dept. of Electrical Engineering,
Columbia University, 2004.
- 16
-
D. Kotz, S. B. Toh, and S. Radhakrishnan.
A Detailed Simulation Model of the HP 97560 Disk Drive.
Technical Report PCS-TR94-220, Dept. of Computer Science, Dartmouth
College, July 1994.
- 17
-
Z. Li, S. Lu, S. Myagmar, and Y. Zhou.
CP-Miner: A Tool for Finding Copy-paste and Related Bugs in
Operating System Code.
In Proc. of the 6th USENIX OSDI, pages 289-302, San Francisco,
CA, December 2004.
- 18
-
G. S. Lueker.
A Data Structure for Orthogonal Range Queries.
In Proc. of the 19th IEEE Symp. on Foundations of Computer
Science, pages 28-34, 1978.
- 19
-
J. B. MacQueen.
Some Methods for Classification and Analysis of Multivariate
Observations.
In Proc. of the 5th Berkeley Symp. on Mathematical Statistics
and Probability, pages 281-297, 1967.
- 20
-
M. Martonosi, A. Gupta, and T. Anderson.
MemSpy: Analyzing Memory System Bottlenecks in Programs.
In Proc. of the ACM SIGMETRICS, pages 1-12, Newport, RI, June
1992.
- 21
-
D. Pelleg and A. Moore.
Mixtures of Rectangles: Interpretable Soft Clustering.
In Proc. of the 18th Int'l Conf. on Machine Learning, pages
401-408, Berkshires, MA, June 2001.
- 22
-
S. E. Perl and W. E. Weihl.
Performance Assertion Checking.
In Proc. of the 14th ACM SOSP, pages 134-145, Asheville, NC,
December 1993.
- 23
-
F. I. Popovici, A. C. Arpaci-Dusseau, and R. H. Arpaci-Dusseau.
Robust, Portable I/O Scheduling with the Disk Mimic.
In Proc. of the USENIX Annual Technical Conf., pages 297-310,
San Antonio, TX, June 2003.
- 24
-
M. Rosenblum, E. Bugnion, S. Devine, and S. A. Herrod.
Using the SimOS Machine Simulator to Study Complex Computer
Systems.
ACM Trans. on Modeling and Computer Simulation, 7(1):78-103,
January 1997.
- 25
-
C. Ruemmler and J. Wilkes.
An Introduction to Disk Drive Modeling.
IEEE Computer, 27(3):17-28, March 1994.
- 26
-
P. J. Shenoy and H. M. Vin.
Cello: A Disk Scheduling Framework for Next Generation Operating
Systems.
In Proc. of the ACM SIGMETRICS, pages 44-55, Madison, WI, June
1998.
- 27
-
E. Shriver.
Performance Modeling for Realistic Storage Devices.
PhD thesis, Dept of Computer Science, New York University, 1997.
- 28
-
E. Shriver, A. Merchant, and J. Wilkes.
An Analytical Behavior Model for Disk Drives with Readahead Caches
and Request Reordering.
In Proc. of the ACM SIGMETRICS, pages 182-192, Madison, WI,
June 1998.
- 29
-
E. Shriver, C. Small, and K. A. Smith.
Why Does File System Prefetching Work?
In Proc. of the USENIX Annual Technical Conf., pages 71-84,
Monterey, CA, June 1999.
- 30
-
SPECweb99 Benchmark.
https://www.specbench.org
[1]/osg/web99.
- 31
-
A. Tomkins, R. H. Patterson, and G. A. Gibson.
Informed Multi-Process Prefetching and Caching.
In Proc. of the ACM SIGMETRICS, pages 100-114, Seattle, WA,
June 1997.
- 32
-
Transaction Processing Performance Council.
TPC Benchmark C, Revision 5.4, April 2005.
https://www.tpc.org/tpcc/.
- 33
-
M. Uysal, G. A. Alvarez, and A. Merchant.
A Modular, Analytical Throughput Model for Modern Disk Arrays.
In Proc. of the 9th MASCOTS, pages 183-192, Cincinnati, OH,
August 2001.
- 34
-
H. J. Wang, J. C. Platt, Y. Chen, R. Zhang, and Y.-M. Wang.
Automatic Misconfiguration Troubleshooting with PeerPressure.
In Proc. of the 6th USENIX OSDI, pages 245-258, San Francisco,
CA, December 2004.
- 35
-
B. L. Worthington, G. R. Ganger, and Y. N. Patt.
Scheduling Algorithms for Modern Disk Drives.
In Proc. of the ACM SIGMETRICS, pages 241-251, Santa Clara,
CA, May 1994.
- 36
-
B. L. Worthington, G. R. Ganger, Y. N. Patt, and J. Wilkes.
On-Line Extraction of SCSI Disk Drive Parameters.
In Proc. of the ACM SIGMETRICS, pages 146-156, Ottawa, Canada,
June 1995.
- 37
-
K. Yaghmour and M. R. Dagenais.
Measuring and Characterizing System Behavior Using Kernel-Level
Event Logging.
In Proc. of the USENIX Annual Technical Conf., San Diego, CA,
June 2000.
|


![$\displaystyle Pr[T_{seek}\geq x] = \begin{cases}1, & if x \leq a; \left( ...
...\cdot e< x \leq c+d\cdot \delta; 0, & if c+d\cdot \delta < x. \end{cases}$](img44.gif)