
| ||||||||||||||||||||||||||||||||||||||||||||||||||||
|
FAST '04 Paper
[FAST '04 Technical Program]
Buttress: A toolkit for flexible and high fidelity I/O benchmarking
Abstract:In benchmarking I/O systems, it is important to generate, accurately, the I/O access pattern that one is intending to generate. However, timing accuracy ( issuing I/Os at the desired time) at high I/O rates is difficult to achieve on stock operating systems. We currently lack tools to easily and accurately generate complex I/O workloads on modern storage systems. As a result, we may be introducing substantial errors in observed system metrics when we benchmark I/O systems using inaccurate tools for replaying traces or for producing synthetic workloads with known inter-arrival times. In this paper, we demonstrate the need for timing accuracy for I/O benchmarking in the context of replaying I/O traces. We also quantitatively characterize the impact of error in issuing I/Os on measured system parameters. For instance, we show that the error in perceived I/O response times can be as much as +350% or -15% by using naive benchmarking tools that have timing inaccuracies. To address this problem, we present Buttress, a portable and flexible toolkit that can generate I/O workloads with microsecond accuracy at the I/O throughputs of high-end enterprise storage arrays. In particular, Buttress can issue I/O requests within 100µs of the desired issue time even at rates of 10000 I/Os per second (IOPS).
| ||||||||||||||||||||||||||||||||||||||||||||||||||||||||||||||
 |
The main assumption in using traces and synthetic workloads to
benchmark I/O systems is that the workload being generated is really
the
one that is applied to the test system. However, this is quite
difficult to
achieve. Our results indicate that naive implementations of
benchmarking
tools, which rely on the operating system to schedule I/Os, could skew
the
mean inter-I/O issue times by as much as 7ms for low I/O loads. This is
especially erroneous in the case of high-end storage systems which
might
have response times in the 100s of microseconds, and can handle 10s of
thousands of I/Os per second. As we shall show in Section 2, this deviation can have
significant impact on measured system parameters such as the mean
device
response time.
The main challenge in building useful benchmarking tools is to be able to generate and issue I/Os with accuracies of about 100 µs, and at throughputs achieved by high-end enterprise storage systems. In this paper, a) we quantitatively demonstrate that timing errors in benchmarking tools can significantly impact measured system parameters, and b) we present and address the challenges in building a timing accurate benchmarking tool for high end storage systems.
The rest of the paper is organized as follows. In Section 2 we analyze the impact of not issuing I/Os at the right time on system metrics. Motivated by the need for having accurate benchmarking tools, we first present the complexities in designing such a system which runs on commodity operating systems in Section 3. In Section 4 we present solutions in terms of a flexible and nearly symmetric architecture for Buttress. We detail some specific optimizations of interest in Section 5. Experiments to validate that our implementation achieves high fidelity are described in Sections 6. We conclude with related work in Section 7 and a summary in Section 8.
|
In this section, we quantify the impact of errors in issuing I/O at the designated time on measured application statistics. We define issue-error as the difference in time between when an I/O is intended to be issued and when it is actually issued by the benchmarking tool. One may intuitively feel that I/O benchmarks can adequately characterize applications despite timing inaccuracies in issuing I/O, as long as the remaining characteristics of the workload, such as sequentiality, read/write ratio, and request offsets are preserved. In fact, most studies that do system benchmarking seem to assume that the issue accuracy achieved by using standard system calls is adequate. Our measurements indicate that this is not the case and that errors in issuing I/Os can lead to substantial errors in measurements of I/O statistics such as mean latency and number of outstanding I/Os.
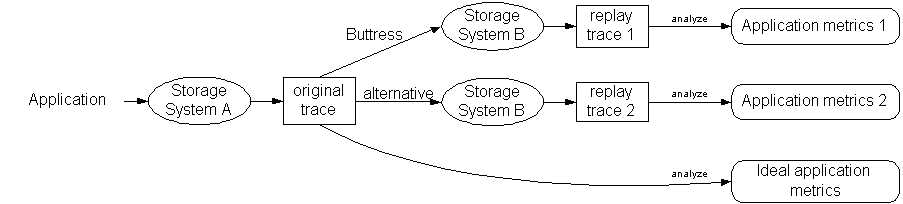
Figure 1 illustrates our evaluation methodology. We use I/O trace replay to evaluate different mechanisms of I/O scheduling, each attempting to issue the I/Os as specified in the original trace. The I/O trace contains information on both when I/Os were issued and when the responses arrived. During trace replay, we collect another trace, called the replay trace, which includes the responses to the replayed I/Os. We then analyze the traces to get statistics on I/O metrics such as I/O response times and queue lengths at devices. We use these metrics to compare the different trace replay methods.
Note that the I/O behavior of an application depends upon the storage system; hence the I/O trace of the application running on system A is generally quite different from the I/O trace on system B. We expect the I/O issue times to be similar if the replay program is accurate, though the response time statistics and I/O queue sizes on system B are likely to be different. In practice, we rarely have the ability to use the actual application on system B; for rare cases that we could run the application on system B, we collect a replay trace running the application and use it as an ideal baseline. We compare the results of the analysis of the different traces between each other and to the results of the analysis of the ideal trace to evaluate the impact of I/O issue accuracy on the storage system performance metrics.
We used four different mechanisms to replay the application trace (original trace) on the storage system B. All programs we used were multi-threaded and used the pthreads package. We issued I/Os synchronously, one per thread, and all programs used the same mechanism for I/O issue. The most elaborate of these programs is Buttress and is the main subject of this paper - we briefly describe the other three programs below.
The first two programs, SELECT and SLEEP used standard OS mechanisms to schedule and issue I/Os (select() and usleep() system calls respectively) to wait until the time for an I/O issue arrives. Each of these had a number of worker threads to issue I/Os and a master thread that hands I/Os to available worker threads. Once a worker thread is assigned to issue an I/O, it sleeps using either the select() or the usleep() call, and the OS scheduler wakes the worker when the time for the I/O arrives. These two programs rely entirely on standard OS mechanisms to keep the time and issue the I/Os and hence their accuracy is determined by the scheduling granularity of the underlying OS.
The third program, DED-CLOCK, uses a dedicated clock thread, and CPU cycle counters to schedule the I/Os. The clock thread spins continuously and wakes up worker threads at the appropriate times and hands them I/Os to issue. The CPU cycle counters are usually much more precise than the standard OS timers, but the throughput of this approach depends on how fast the clock thread can wake up workers to issue I/Os.
These three programs are simple approaches of how one might normally architect a trace-replay program using existing mechanisms. In general, the problem with these approaches is that the accuracy of I/O scheduling is contingent upon the thread being scheduled at the right time by the OS. As a result, they are unable to replay I/O bursts accurately and tend to either cluster I/Os at OS scheduling boundaries or flatten bursts.
Figure 2 presents two storage-level performance metrics using various trace-replay mechanisms. It shows the relative change in I/O response time and average queue size using two applications (omail and harp), across three different storage arrays and benchmark systems (the details of the experimental setup are in Section 6). The figure presents the average measured response time, when different trace replay tools were used, normalized to the average response time when Buttress was used. The main point from these graphs is that the inaccuracies in scheduling I/Os in time may result in as much as a factor of 3.5 difference in measured response time and a factor of 26 in measured queue sizes (both happen for SELECT) - these differences are too large to ignore.
First, it is a challenge to design a high performance I/O load generator that can effectively utilize the available CPU resources to generate I/Os at high rates accurately. Existing mid-range and high-end disk arrays have hundreds to thousands of disk drives, which means that a single array can support 100,000 back-end IOPS. The large array caches and the high-speed interconnects used to connect these arrays to the host systems exacerbate this problem: workloads could achieve 500,000 IOPS with cache hits. These I/O rates imply that the I/O workload generators have about a few microseconds to produce each I/O to attain these performance rates. Therefore it is necessary to use multiple CPUs in shared memory multiprocessors to generate these heavy workloads.
Second, the scheduling granularity of most operating systems is too large (around 10ms) to be useful in accurately scheduling I/Os. The large scheduling granularity results in quantization of I/O request initiations around the 10ms boundary. This is despite the fact that most computer systems have a clock granularity of a microsecond or less. As shown in Figure 2, this quantization effect distorts the generated I/O patterns, and as a result, the observed behavior from the I/O system with a synthetic load generator does not match the observed behavior under application workload (details in Section 6).
Third, the complexity of modern non-real-time operating systems usually results in unpredictable performance effects due to interrupts, locking, resource contention, and kernel scheduling intricacies. These effects are most pronounced for the shared memory multiprocessor platforms as the OS complexity increases. For example, calling the gettimeofday() function on an SMP from multiple threads may cause locking to preserve clock invariance, even though the threads are running on separate processors. An alternative is to use the CPU cycle counters; however, this is also complicated because these counters are not guaranteed to be synchronized across CPUs and a thread moving from one CPU to another has difficulty keeping track of the wall clock time.
Portability: To be useful the tool should be highly portable. Specifically it is desirable that the tool not require kernel modification to run.
 |
In the rest of this section and Section 5, we describe how we developed Buttress to satisfy these requirements. In Buttress we architecturally separated the logic for describing the I/O access pattern and the functionality for scheduling and executing I/Os. This separation enables Buttress to generate a variety of I/O patterns easily. Most of the complexity of Buttress is in the ``core'', which is responsible for actually scheduling and executing I/Os. The Buttress core is architected as a multi-threaded event processing system. The individual threads are responsible for issuing the I/Os at the right time, and executing the appropriate I/O generation function to get future I/Os to issue.
As implemented currently, Buttress does not require any kernel modifications. It uses POSIX pthreads and synchronization libraries to implement its threads and locking. This makes Buttress very portable - we have been running Buttress on both Linux and HPUX. On the flip side, the performance of Buttress in terms of its maximum throughput and accuracy in issuing I/Os depends on the performance of the underlying OS.
The logic for determining the I/O access pattern is implemented in a collection of C++ objects, called filaments. The functionality for scheduling and executing I/Os is embedded in threads called workers. The implementation of the workers and the interface to filaments forms the core of Buttress. Filaments themselves are written by Buttress' users, and currently we provide a library of filaments to generate common I/O patterns.
A filament is called with the event that triggered a worker to call that filament. The filament then generates additional events to occur in the future, and queues them up. Workers then remove events from the queues at the time the event is to occur, and process them by either calling the appropriate filament at the right time, or issuing the I/O if the event represents an I/O. Currently, we have three types of events in Buttress:
From now on we refer to Timer and Messaging events as filament events and differentiate them when necessary.
Workers are responsible for processing events at their scheduled time. Each worker is implemented as a separate thread so that Buttress can take advantage of multiple CPUs. Workers wait until an event is ready to be processed, and based on the event they either issue the I/O in the event, or call the appropriate filament.
The last worker to finish processing an event maintains the time until the next event is ready to be processed. In addition, because we found keeping time using gettimeofday() and usleep() to be slow and inaccurate, the worker keeps time by spinning; that is, executing a tight loop and keeping track of the time using the CPU cycle counter.
Let us now describe, with a simple example, the functions that a worker performs. We will then translate these worker functions into a generic state transition diagram. We simplify the exposition below for convenience, and in the following section, we discuss specific details needed to achieve higher timing accuracy and throughput.
A worker (A) starts by checking if there are events to be processed. Say it found a timer event, and that it was time to process it. If this worker was spinning, then it wakes up a worker thread (B) to keep time. Worker A then processes the timer event by calling the appropriate filament. Say that the filament generates an I/O to execute in the future. Worker A queues it for later processing, and then checks if any events are ready. Since none are ready and worker B is spinning, it goes to sleep. Meanwhile worker B spins until it is time to process the I/O event, wakes up worker A (as before), while B issues the I/O. Once the I/O completes worker B calls the filament with the completed I/O and goes back to checking for ready events. This procedure continues until there are no events left and there, are no outstanding I/Os to be issued.
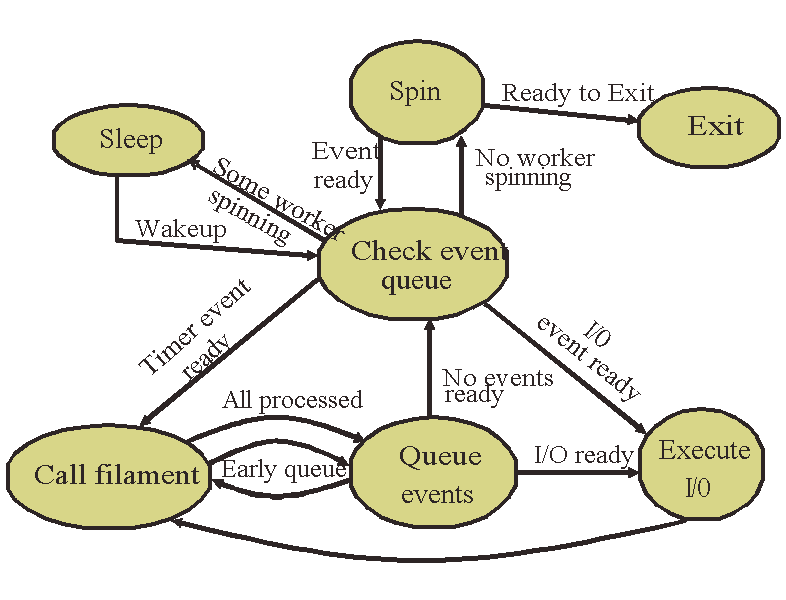
We now generalize the above example with generic state transitions (see Figure 3).
1. Check event queue: This is the central dispatch state. In this state, the worker determines if a filament is runnable, or if an I/O is issuable, and transitions to the appropriate state to process the filament or I/O. It also wakes up another worker to replace itself to guarantee someone will be spinning. If no event is ready, the worker either transitions to the spin state or the sleep state based on whether another worker is already spinning.
2. Call Filament: The worker calls the filament when either a timer/messaging event is ready, or when an I/O completes. The filament may generate more events. Once all the ready events are processed, the worker transitions to ``Queue Events'' state to queue the events the filament generated. The worker may queue events while processing filament events (``early queue'') to avoid waiting for all events to get processed for slow filaments.
3. Queue events: In this state, the worker queues events which were generated by a filament. If none of those events are ready, the worker transitions into the ``check event queue'' state. If any of the events is ready, the worker transitions directly to processing it: either issuing the I/O or calling an appropriate filament.
4. Execute I/O: In this state, the worker executes a ready I/O event. Because implementations of asynchronous I/O on existing operating systems are poor, Buttress uses synchronous I/O, and hence the worker blocks for I/O completion. Once the I/O completes, the worker transitions directly to calling the appropriate filament with the completed I/O event.
5. Spin: A worker starts ``spinning'' when, after checking the event queue for events to process, it finds that there are no ready events and no other spinning worker.
To prevent deadlock, it is necessary to ensure that not all workers go to sleep. Recall that in Buttress, there is no single thread that is responsible for dispatching events; the functionality is distributed among the workers. Hence if all the workers went to ``sleep'', there will be a deadlock. Instead, one of the workers always spins, periodically checking if the event at the head of the central queue is ready to be processed.
When the event queue is empty and all other workers are asleep, the spinning worker wakes one thread up and exits; the rest of the workers repeat this process until all threads exit.
There are two ways one can use Buttress: a) configure and run pre-defined library filaments, and b) implement new workloads by implementing new filaments.
Currently Buttress includes filaments that: a) implement different distributions for inter I/O time and device location accessed, b) replay an I/O trace, and c) approximate benchmarks such as TPC-B [21] and SPC-1 [9].
To support programming new filaments, Buttress exports a simple single threaded event-based programming interface. All the complexity of actually scheduling, issuing, and managing events is completely hidden from the filaments. The programmer needs to implement only the logic required to decide what event to generate next. Programmers may synchronize between filaments using message events.
To allow for shared and slow statistics, Buttress uses the same event processing core to pass I/O completion events to filaments which are dedicated to keeping statistics. The set of statistics to keep is specified at run time in a configuration file, which causes Buttress to build up multiple statistic filaments that may be shared by I/O generating filaments.
Some statistics, such as mean and standard deviation are easy to compute, other statistics such as approximate quantiles [16], or recording a full I/O trace can potentially take much longer due to occasional sorting or disk write. For this reason, we separate the steps of generating I/Os, which needs to run sufficiently fast that I/Os always reach the core before their issue time, and statistics, which can be computed independent of the I/O processing. In Buttress, information regarding each I/O is copied into a collection buffer in a filament, without computing the required statistics. Once the collection buffer is full, it is sent to a ``statistics thread'' using a messaging event. This allows the I/O generation filament to run quickly, and it improves the efficiency of computing statistics because multiple operations are batched together.
The architecture presented in the previous section requires
optimization to achieve the desired high throughput and low
issue-error. Some of the important implementation questions that need
to be addressed are:
In this section, we present some of the techniques we use to address the above questions, and also describe our technique for identifying where optimization is necessary.
Shared data structures must be protected by locks. However locks cause trains of workers, contending on the lock, which builds up increasing latency. Additionally, interrupts can force locks to be held longer than expected. Worse, we observed that on Linux, with the default 2.4 threads package, it takes about 10 times longer to release a lock if another thread is waiting on it. Therefore it is important to a) minimize waiting on shared locks, b) minimize the time spent in the critical section, and c) minimize the total number of lock operations. We address the locking problems using bypass locking to allow a thread to bypass locked data structures to find something useful to do, reduce the critical section time by pairing priority queues with dequeues, and minimize lock operations using filament event batching and carried events.
The queues, where workers queue and pick events to process, are shared data structues and accesses to these queues is protected by locks. Hence to reduce the number of lock operations we try to avoid queuing events on these central structures if possible, and attempt to process events in batches.
Workers get new events in the queue-events state or the execute-I/O state, and process events that are ready to be processed in the execute-I/O or call-filament states. To minimize lock operations we enable workers to carry, without any central queuing, events that are ready to be processed directly from the queue-events state to the execute-I/O or call-filament states, or execute-I/O to the call-filament state. This simple optimization directly reduces the number of lock operations. Buttress workers prefer to carry I/O events over other events that could be ready, because I/O events are the most time critical.
When processing filament events, workers remove all of the ready events in a single batch; this allows a worker to process multiple filament events with just one lock acquisition (recall that a filament is single threaded and thus locked by the worker executing it). To enable such batch processing, Buttress keeps a separate event queue for each filament rather than placing the events in a central priority queue, which would tend to intermingle events from different filaments. To enable such distributed (per filament) queues, while still allowing for a centrally ordered queue, what is stored centrally is a hint that a filament may have a runnable event at a specified time, rather than the actual event. Workers thus skip hints which correspond to events that have already been processed when working through the central queues.
The same optimization cannot be performed for I/O events because unlike filament events, I/O events cannot be batched - Buttress uses synchronous I/O because we found support for asynchronous I/O inadequate and lacking in performance on stock operating systems. However because I/Os happen frequently and are time critical, we use different queues for the pending hints and pending I/O events, and directly store the I/O events in their own priority queue.
Though removing an element from a priority queue is theoretically only logarithmic in the length of the queue, when shared between many separate threads in a SMP, each of those operations becomes a cache miss. To alleviate this problem, we pair together a priority queue with a deque, and have a thread move all of the ready events into the deque. This benefits from the fact that, once the queue is searched for a ready event, all the requisite cache lines are already retrieved, and moving another event will cause very few additional cache misses. Removing an entry from the double ended queue only takes at most 2 cache misses: one to get the entry and one to update the head pointer. This combination minimizes the time in critical sections when bursts of events need to be removed from the priority queues.
While we have minimized the number of lock operations and the time spent in critical sections, at high load it is likely that a thread will get interrupted while holding one of the filament hint or I/O locks. If there are multiple runnable events, we would prefer that the thread remove one of the other events and continue processing, rather than waiting on a single lock, and incurring the high wakeup penalty.
Therefore, we partition the hint queue and the I/O queues. When queuing events, the worker will try each of the queues in series, trying to find one which is unlocked, and then putting events on that one. If all the queues are locked, it will wait on one of the locks rather than spin trying multiple ones. When removing entries, the worker will first check a queue-hint to determine if it is likely that an entry is ready, and if so, will attempt to lock and remove an entry. If the lock attempt fails, it will continue on to the next entry. If it finds no event, and couldn't check one of the possibilities, it will wait on the unchecked locks the next time around.
This technique generally minimizes the amount of contention on the locks. Our measurements indicate that going from one to two or three queues will reduce the amount of contention by about a factor of 1000, greatly reducing the latency of accessing shared data structures. However, at very high loads, we still found that workers were forming trains, because they were accessing the different queues in the same order, so we changed each worker to pick a random permutation order to access the queues; this increases the chance that with three or more queues two workers which simultaneously find one queue busy will choose separate queues for trying next.
We use a similar technique for managing the pool of pages for data for I/Os, except that in this case all threads check the pools in the same order, waiting on the last pool if necessary. This is because we cache I/O buffers in workers, and so inherently have less contention, and by making later page pools get used less, we pre-allocate less memory for those pools.
Buttress is designed to run on stock operating systems and multiprocessor systems, which implies that it needs to work around delays in system calls, occasional slow execution of code paths due to cache misses, and problems with getting accurate, consistent time on multiprocessor systems.
There are three sources of delay between when an event is to be processed and when the event is actually processed: a) a delay in the signal system call, b) a scheduling delay between when the signal is issued and the signaled thread gets to run, and c) a delay as the woken thread works through the code-path to execute the event. Pre-spinning and low priority spinners are techniques to address these problems.
Pre-spin is a technique whereby we start processing events ``early'', and perform a short, unlocked spin right before processing an event to get the timing entirely right. This pre-spin is necessary because the thread wake-up, and code path can take a few 10s of µs under heavy load. By setting the pre-spin to cover 95-99% of that time, we can issue events much more accurately, yet only spin for a few µs. Naturally setting the pre-spin too high results in many threads spinning simultaneously, leading to bad issue error, and low throughput.
Pre-spin mostly covers problems (a) and (c), but we find that unless we run threads as non-preemptable, that even the tight loop of while(cur_time() < target_time) {} will very occasionally skip forward by substantially more than the 1µs that it takes to calculate cur_time(). This may happen if a timer or an I/O completion interrupt occurs. Since these are effectively unavoidable, and they happen infrequently (less than 0.01% at reasonable loads), we simply ignore them.
If the spinning thread is running at the same priority as a thread actively processing events, then there may be a delay in scheduling a thread with real work to do unless the spinning thread calls sched_yield(). Unfortunately, we found that calling sched_yield() can still impact the scheduling delay because the spinning thread is continually contending for the kernel locks governing process scheduling. We found this problem while measuring the I/O latency of cache hits with a single outstanding I/O.
Low priority spinners solve this problem by re-prioritizing a thread as lowest priority, and only allowing it to enter the spin state. This thread handles waking up other threads, and is quickly preempted when an I/O completes because it is low priority and so doesn't need to yield.
In Buttress, each worker maintains its own time, re-synchronizing its version of the time with gettimeofday() infrequently, or when changes in the cycle counter indicate the worker must have changed CPUs. However, small glitches in timing could result in incorrect execution. Consider the following situation: worker 1 with a clock of 11µs is processing a filament event, when worker 2 with a clock of 15µs tries to handle an event at 15µs. Since the filament is already running, worker 2 cannot process the event, but it assumes that worker 1 will process the event. However worker 1 thinks the event is in the future, and so with the hint removed, the event may never get processed. This tiny 4µs clock skew can result in incorrect behavior. The solution is for workers to mark filaments with their current clock, so that inter-worker clock skew can be fixed. The problem occurs rarely (a few times in a 10+ minute run), but it is important to handle it for correctness.
One of the well known problems with the standard template library (STL) is the abstraction penalty [20], the ratio of the performance of an abstract data structure to a raw implementation. We encountered the abstraction penalty in two places: priority queues and double-ended queues. The double ended queue is implemented with a tree, which keeps the maximum operation time down at the expense of slower common operations. Using a standard circular array implementation made operations faster at the expense of a potentially slow copy when the array has to be resized. Similarly, a re-implementation of the heap performed approximately 5x faster than STL for insertion and removal when the heap is empty, and about 1.2x faster when the heap is full (on both HP-UX and Linux with two different compilers each). The only clear difference between the two implementations was that STL used abstraction much more (inserting a single item nested about eight function calls deep in the STL, and one in the rewrite).
Other performance problems were due to operations on long long type, such as mod and conversion to double. The mod operation was used in quantization; our solution was to observe that the quantized values tend to be close to each other, and therefore, we calculate a delta with the previous quantized value (usually only 32-bits long) and use the delta instead followed by addition.
Locating bottlenecks in Buttress is challenging because many of them only show up at high loads. We addressed this with two approaches. First, we added counters and simple two-part statistics along many important paths. The two part statistics track ``high'' and ``low'' values separately for a single statistic, which is still fast, and allows us to identify instances when variables are beyond a threshold. This is used for example to identify the situations when a worker picks up an event from the event queue before the event should happen or after; or the times when few (say less than 75%) of the workers are active.
Second, we added a vector of (time, key, value) trace entries that are printed at completion. These trace entries allow us to reconstruct, using a few simple scripts, the exact pattern of actions taken at runtime. The vectors are per worker, and hence lock-free, leading to low overhead when in used. The keys are string pointers, allowing us to quickly determine at runtime if two trace entries are for the same trace point, and optionally collapse the entries together (important, for example, for tracing in the time-critical spin state).
The counters and statistics identify which action paths should be instrumented when a performance problem occurs, and the trace information allows us to identify which parts of those paths can be optimized.
We used three SMP servers and five disk arrays covering a wide variety of hardware. Two of the SMP servers were HP 9000-N4000 machines: one with eight 440MHz PA-RISC 8500 processors and 16GB of main memory (timpani), the other with two 440MHz PA-RISC 8500 processors and 1 GB of main memory (bongo). The third was an HP rp8400 server with two 750MHz PA-RISC 8500 processors and 2 GB of main memory (piccolo). All three were running HP-UX 11.0 as the operating system.
We used five disk arrays as our I/O subsystem: two HP FC-60 disk arrays [11], and one HP XP512 disk array [2], one HP XP1024 disk array [1], and one HP VA7400 disk array [3]. Both the XP512 and XP1024 had in-use production data on them during our experiments.
The XP1024 is a high end disk array. We connected timpani directly to front-end controllers on the XP1024 via eight 1 GBps fibre-channel links, and used two back end controllers each with 24 four-disk RAID-5 groups. The array exported a total of 340 14 GB SCSI logical units spread across the array groups for a total of about 5 TB of usable disk space.
Piccolo was connected via three 1 GBps links to a Brocade Silkworm 2400 fibre-channel switch, that was also connected to the XP512 and VA7400. The XP512 used two array groups on one back-end controller exporting 17 logical units totaling 240 GB of space. The VA7400 is a mid-range virtualized disk array that uses AutoRaid [24] to change the RAID level dynamically, alternating between RAID-1 and RAID-6. It exported 50 virtual LUs, each 14 GB in size for a total of 700 GB of space spread across 48 disks.
Bongo was connected to two mid-range FC-60 disk arrays via three 1GBps fibre channel links to a Brocade Silkworm 2800 switch. The FC-60 is a mid-range disk array; one exported 15 18GB 2-disk RAID-1 LUs, and the other 28 36GB 2-disk RAID-1 LUs for a total of 1300 GB of disk space.
We used both synthetic workloads and two application traces: a file server containing home directories of a research group (harp), and an e-mail server for a large company (omail). In order to create controlled workloads for our trace replay experiments, we also used a modified version of the PostMark benchmark (postmark).
The synthetic workload consisted of uniformly spaced 1KB I/Os, issued to 10 logical units spread over all of the available paths; the workload is designed so that most of the I/Os are cache hits. We use timpani as the host and the XP1024 disk array as the storage system for the experiments that use this workload.
The file-system trace (harp) represents 20 minutes of user activity on September 27, 2002 on a departmental file server at HP Labs. The server stored a total of 59 file-systems containing user home directories, news server pools, customer workload traces, HP-UX OS development infrastructure, among others for a total of 4.5 TB user data. This is a typical I/O workload for a research group, mainly involving software development, trace analysis, simulation, and e-mail.
The omail workload is taken from the trace of accesses done by an OpenMail e-mail server [10] on a 640GB message store; the server was configured with 4487 users, of whom 1391 were active. The omail trace has 1.1 million I/O requests, with an average size of 7KB.
The PostMark benchmark simulates an email system and consists of a series of transactions, each of which performs a file deletion or creation, together with a read or write. Operations and files are randomly chosen. We used a scaled version of the PostMark benchmark that uses 30 sets of 10,000 files, ranging in size from 512 bytes to 200KB. To scale the I/O load intensity, we ran multiple identical copies of the benchmark on the same file-system.
We now present a detailed analysis of various trace replay schemes, including Buttress, on their behavior to achieve good timing accuracy as the I/O load on the system changes for a variety of synthetic and real application workloads. In Section 2, we demonstrated that the issue error impacts the workload characteristics; in this section, we focus on the issue error itself.
In Figures 4 and 5 we plot the
CDF of the issue error for Buttress, DED-CLOCK, SLEEP, and
SELECT using the harp and the omail workload. We use two variants
of these workloads: we replay the workload at the original speed and
quadruple the speed. This lets us quantify the issue error as the
throughput changes. These experiments were performed on timpani
using the XP1024 disk array.
|
|
These results show that Buttress issues about 98% of the I/Os in the omail workload within 10µs of the actual time in the original workload and 95% of the I/Os in the harp workload within less than 50µs of their actual time. On the other hand, OS-based trace replay mechanisms fare worst: both SLEEP and SELECT could achieve 1 millisecond of issue accuracy for only about 30% of the I/Os in either workload. The DED-CLOCK was slightly better, issuing 89% of the I/Os in the harp trace and 60% of the I/Os in the omail trace within 100µs of their intended time. This is because DED-CLOCK can more accurately keep time using the CPU cycle counters, but overwhelmed by the thread wakeup overhead when dealing with moderate I/O rates.
The results with the faster replays indicate that Buttress continues
to
achieve high I/O issue accuracy for moderate loads: 92% of the I/Os in
the
harp workload and the 90% of the I/Os in the omail workload are issued
within 50µs of their intended issue times. An
interesting observation
is that the SLEEP and SELECT based mechanisms perform slightly
better at higher load (4x issue rate) than at lower loads. This is
because
in the higher load case, the kernel gets more opportunities to schedule
threads, and hence more I/O issuing threads get scheduled at the right
time. The dedicated clock-thread based approach, however, is restrained
by
the speed at which the clock-thread can wake up worker threads for I/O
issue - especially for the omail workload where the I/O load steadily
runs at a moderate rate.
![\includegraphics[width=3.1in]{plots/bongo/gpout.issueerror.harp.1.ps}](img14.png) |
Figure 6 shows the issue
error for the harp workload
when we use the 2-processor server bongo and the two mid-range FC-60
disk arrays. While this environment has sufficient resources to handle
the steady state workload, it does not have enough resources to handle
the peaks. When the arrays fall behind in servicing I/Os, contention
occurs; as a result, both Buttress and DED-CLOCK show heavy-tailed
issue error graphs. Also, having only two processors to handle all
system events introduces additional delays when interrupts are being
processed.
We also used synthetic, more regular workloads to determine how accurately Buttress issues I/Os as the load increases. We measured the difference between the time that the I/O was supposed to be issued and the time when it was actually issued. The results presented are averages of 3 runs of the experiments using 3 different sets of 10 destination devices. Figure 7 presents the results, with the issue error being plotted against the number of IOPS performed by Buttress. We use IOPS because it correlates with the number of events that Buttress needs to handle.
|
|
|
Another measure of Buttress' performane in terms of its overhead, is whether Buttress can get throughputs comparable to those of I/O generation tools specifically engineered to generate only a particular pattern of I/Os. To answer this question we wrote a special-purpose program that uses multiple threads issuing I/Os using pread() to each of the available devices. We used timpani with the XP1024 for these experiments, and noticed that the maximum throughput we could achieve using the special-purpose program was 44000 IOPS (issuing I/Os to cached 1KB blocks). On the same hardware and setup, Buttress could issue I/Os at 40000 IOPS, only 10% less.
In this section, we examine the characteristics of the I/O workloads produced using trace replay and expand our discussion in Section 2. We focus on two characteristics of the I/O workload: response time and burstiness - Figure 8 (the detailed version of Figure 2(a)) presents the CDF of the measured response times across various trace replay mechanisms; and Figure 10 compares the burstiness characteristics of the original workload with the burstiness characteristics of the workload generated by Buttress. Figure 10 visually shows that Buttress can mimic the burstiness characteristics of the original workload, indicating that Buttress may be ``accurate enough'' to replay traces.
For the omail workload, all of the trace replay mechanisms are comparable in terms of the response time of the produced workload: the mean response times were within 15% of each other. For this trace, even though the I/Os were issued at a wide range of accuracy, the effects on the response time characteristics were not substantial. This is not so for the harp workload - different trace replay mechanisms produce quite different response time behavior. This is partially explained by the high-burstiness exhibited in the harp workload; sharp changes in the I/O rate are difficult to reproduce accurately.
In order to understand the impact of I/O issue accuracy on the
application I/O behaviour, we studied the effect of controlled issue
error using two means: a) by introducing a uniform delay to the issue
times of each I/O and b) by quantizing the I/O issue times around
simulated scheduling boundaries. Figure 9 shows
the results of the sensitivity experiments for two application
metrics, response time and burstiness. It shows that the mean response
time changes as much as 37% for the harp workload and 19% for the
omail workload. The effects of issue error on the burstiness
characteristics (mean queue size) is more dramatic: as much as 11
times for the harp workload and five times for the omail
workload. This shows that the bursty workloads are more sensitive to
the delays in I/O issue times leading to modify their I/O behavior.
![\includegraphics[width=3.1in]{plots/gpout.resp.postmark.1.ps}](img24.png) |
So far, we used application workloads collected on different
systems;
we now look at the PostMark workload and present its characteristics
from the trace replays when we use the same host and the array to
replay trace as we used running PostMark. Figure 11
shows the response time characteristics of the PostMark workload on
the XP1024 measured from the workload and from the trace
replays. The high-accuracy of Buttress helps it to produce almost the
exact response time statistics as the actual workload, while the
less accurate mechanisms deviate significantly more.
Several benchmarks attempt to emulate the real application behavior: TPC benchmarks [22] emulate common database workloads (e.g., OLTP, data warehousing), Postmark [15], SPECsfs97 [8], and Andrew [12] emulate file system workloads. The I/O load generated from these benchmarks still uses the real systems, e.g., a relational database or a UNIX file system, but the workload (e.g., query suite, file system operations) are controlled in the benchmark. In practice, setting up infrastructures for some of these benchmarks is complex and frequently very expensive; Buttress complements these benchmarks as a flexible and easier to run I/O load generation tool, which does not require expensive infrastructure.
A variety of I/O load generators measure the I/O systems behavior at maximum load: Bonnie [6], IOBENCH [25], IOmeter [13], IOstone [19], IOzone [14], and lmbench [17]. While Buttress could also be used to determine the maximum throughput of a system, it has the capability to generate complex workloads with think-times and dependencies (e.g., SPC-1 benchmark [9] and TPC-B [21]) and can be used in trace replays. In addition, many of these benchmarks can easily be implemented on top of the Buttress infrastructure, due to its portability, flexibility, and high-performance. Moreover, Buttress can handle general open and closed I/O workloads in one tool.Fstress [5], a synthetic, flexible, self-scaling [7] NFS benchmark has a load generator similar to the one in Buttress. While the Fstress load generator specifically targets NFS, Buttress is general purpose and can be tailored to generate a variety of I/O workloads. Furthermore, we expect that extending Fstress's ``metronome event loop'' in a multi-processor environment will face the same set of design issues we address in this paper.
Several papers [18,23,4] have been written on programming models based on events and threads, and they make a case for one or the other. The architecture of Buttress can be viewed as using both models. In particular, Buttress uses event-driven model implemented with threads. Buttress uses pthreads so that it can run on SMPs, and multiplexes event-based filaments across them to support potentially millions of filaments each temporarily sharing a larger stack space. Since Buttress is implemented in C++, and C++ facilitates state packaging, we have not found that it poses an issue for us as other researchers have found for implementations in C.
We presented Buttress, an I/O generation tool that can be used to issue pre-recorded traces accurately, or generate a synthetic I/O workload. It can issue almost all I/Os within a few tens of µs of the target issuing time, and it is built completely in user space to improve portability. It provides a simple interface for programmatically describing I/O patterns which allows generation of complex I/O patterns and think times. It can also replay traces accurately to reproduce workloads from realistic environments.
We thank our shepherd Fay Chang for her help in making the presentation better, and the anonymous referees for their valuable comments. We also thank Hernan Laffitte for the substantial help in setting up the machines and arrays so that the experiments could actually be run.
|
This paper was originally published in the
Proceedings of the 3rd USENIX Conference on File and Storage Technologies,
Mar 31-Apr 2, 2004, San Francisco, CA, USA Last changed: 17 March 2004 aw |
|
![\includegraphics[width=3.1in]{plots/resp}](img4.png)
![\includegraphics[width=3.1in]{plots/qlen}](img5.png)
![\includegraphics[width=3.1in]{plots/timpani/gpout.issueerror.openmail.1.ps}](img10.png)
![\includegraphics[width=3.1in]{plots/timpani/gpout.issueerror.openmail.0.25.ps}](img11.png)
![\includegraphics[width=3.1in]{plots/timpani/gpout.issueerror.harp.1.ps}](img12.png)
![\includegraphics[width=3.1in]{plots/timpani/gpout.issueerror.harp.0.25.ps}](img13.png)
![\includegraphics[width=3.1in]{plots/issue_error.eps}](img15.png)
![\includegraphics[width=3.1in]{plots/timpani/gpout.resp.openmail.1.ps}](img16.png)
![\includegraphics[width=3.1in]{plots/timpani/gpout.resp.harp.1.ps}](img17.png)
![\includegraphics[width=3.1in]{plots/resp-sens}](img18.png)
![\includegraphics[width=3.1in]{plots/qsize-sens}](img19.png)
![\includegraphics[width=3.1in]{plots/gpout.burst.om.80.vital.b.ps}](img20.png)
![\includegraphics[width=3.1in]{plots/gpout.burst.harp.80.vital.b.ps}](img21.png)
![\includegraphics[width=3.1in]{plots/timpani/gpout.burst.openmail.0.25.ps}](img22.png)
![\includegraphics[width=3.1in]{plots/timpani/gpout.burst.harp.0.25.ps}](img23.png)