


Next: Playing the Trace at
Up: Experimental Results
Previous: The Alternative Disk Array
Playing the Trace at Original Speed
Figure 10:
Comparison of TPC-C I/O response time
on several disk array configuration alternatives as we vary the number
of disks in the array. The SR-Arrays and EW-Arrays are labeled with
their configuration parameters: an ``RaSb'' label denotes a
 SR-Array configuration, and an ``MaSbDc'' label
denotes a
SR-Array configuration, and an ``MaSbDc'' label
denotes a
 EW-Array
configuration.
EW-Array
configuration.
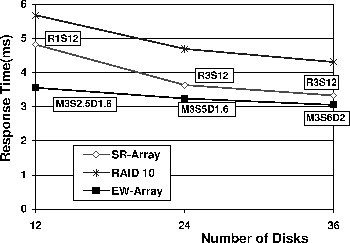 |
We play the TPC-C trace at original speed in the experiments reflected
in Figure 10. It compares I/O response times of the
optimally configured EW-Arrays against those of the RAID-10s and the
optimally configured SR-Arrays as we increase the number of disks. In
these experiments, the second and subsequent replicas, if any, are
propagated in the background.
An SR-Array generally outperforms RAID-10 because its combination of
striping and rotational replication balances the reduction
of seek and rotational delays better. An EW-Array
outperforms both because of its substantially lower write latency,
which also enables a higher degree of replication, which in turn
lowers read latency. As we increase the number of disks, the
performance benefit derived by an SR-Array from an increasing number
of disks is larger than that of an EW-Array because the aggressive
rotational delay reduction of the former benefits both reads and
writes, while the write latency on an EW-Array is small to begin with
and further improvements are marginal. In general, far fewer disks
are necessary to achieve a specific latency goal on an EW-Array.
Next: Playing the Trace at
Up: Experimental Results
Previous: The Alternative Disk Array
Chi Zhang
2001-11-16