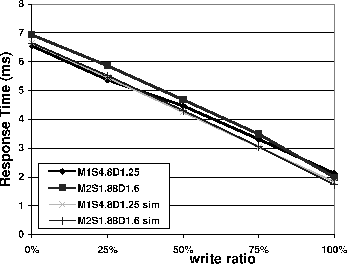
Figure 8:
Comparison of response times on the
EW-Array prototype and those predicted by the simulator as we vary the
read/write ratio.
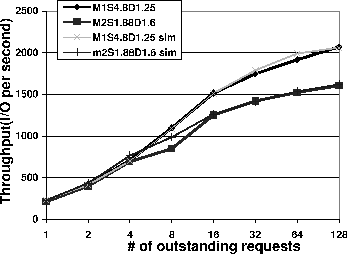
Figure 9:
Comparison of throughput on the
EW-Array prototype and that predicted by the simulator as we vary the
per-disk queue length.
Due to the large number of configurations and the long traces that we
must experiment with, the experimental results reported in
Section 6
are based on those obtained on the simulator; therefore
it is necessary to validate the EW-Array simulator using our EW-Array
prototype.
Table 1 lists some of the platform characteristics of
the prototype.
We run a benchmark called ``Iometer'', a benchmark developed by the
Intel Server Architecture Lab [15]. Iometer can generate
workloads of various characteristics including read/write
ratio, request size, and the maximum number of outstanding requests.
Figure 8 compares the response times measured on
a number of six-disk EW-Array prototype configurations with those
predicted by the simulator as we vary the read/write ratio. In these
Iometer experiments, the number of outstanding requests is one, and
the dilution factor of the EW-Array is two. The two EW-Array
configurations (
, and
) have similar response times and they are closely
matched by those predicted by the simulations. Since the eager-writes
have much lower latency than reads, the response time decreases as the
write ratio increases.
Figure 9 compares the throughput obtained on
the same six-disk EW-Array configurations with that predicted by the
simulator as we vary the queue length per disk. In these Iometer
experiments, the write ratio is 50%. As the per-disk queue length
increases, the
EW-Array achieves greater
throughput than the
configuration because it
becomes increasingly difficult for the latter configuration to mask
the replica propagation even with a larger dilution factor. The
throughput measured on the prototype matches closely the simulated
result.
Next:Experimental Results Up:Implementation Previous:Updating and Recovering theChi Zhang 2001-11-16