
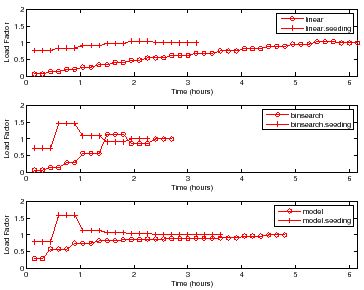
Figure 7 shows the choice of load factors for finding
the peak rate for a sample with ![]() disks and
disks and ![]() nfsds using the policies
outlined in Section 4. Each point on the curve represents a
single trial for some load factor. More points indicate higher number of trials
at that load factor. For brevity, we show the results only for DB_TP.
Other workloads show similar behavior.
nfsds using the policies
outlined in Section 4. Each point on the curve represents a
single trial for some load factor. More points indicate higher number of trials
at that load factor. For brevity, we show the results only for DB_TP.
Other workloads show similar behavior.
For all policies, the controller conducts more trials at load factors near
![]() than at other load factors to find the peak rate with the target accuracy
and confidence. All policies without seeding start at a low load factor and take
longer to reach a load factor of
than at other load factors to find the peak rate with the target accuracy
and confidence. All policies without seeding start at a low load factor and take
longer to reach a load factor of ![]() as compared to policies with
seeding. All policies with seeding start at a load factor close to
as compared to policies with
seeding. All policies with seeding start at a load factor close to ![]() , since
they use the peak rate of a previous sample with
, since
they use the peak rate of a previous sample with ![]() disks and
disks and ![]() nfsds as the
seed load.
nfsds as the
seed load.
Linear takes a significantly longer time because it uses a fixed
increment by which to increase the test load. However, Binsearch jumps to
the peak rate region in logarithmic number of steps. The Model policy is
the quickest to jump near the load factor of ![]() , but incurs most of its cost
there. This happens because the model learned is sufficiently accurate for
guiding the search near the peak rate, but not accurate enough to search
the peak rate quickly.
, but incurs most of its cost
there. This happens because the model learned is sufficiently accurate for
guiding the search near the peak rate, but not accurate enough to search
the peak rate quickly.
 |
varun 2008-05-13