


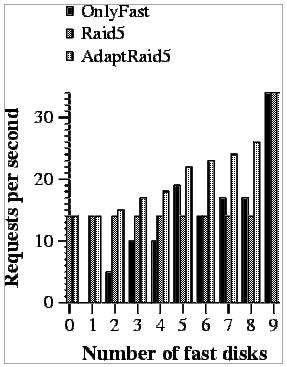
If we concentrate our attention on each of the systems individually, we can see that RAID5 does not change its performance when more of the disks are fast. This happens because this algorithm does not know how to use the better performance of newer disks.
The second system, OnlyFast, has a very inconsistent behavior. It can achieve high performance under some configurations and a very bad one under others. The reason behind this behavior is the increase in the number of small writes. As we have mentioned in Section 4.1, if the number of data disks used is not a divisor of number data blocks in a stripe, a full-stripe write operation ends up performing a small write. This scenario occurs when the system has 4, 6, 7 and 8 disks. In the rest of the configurations, the performance obtained by OnlyFast is quite good and proportional to the number of fast disks. We should notice that this system has not been evaluated for 0 or 1 fast disks because we need at least 2 disks to build a RAID5.
The last evaluated system is our proposal (AdaptRaid5). We can observe that the performance of this system increases at a similar pace as the number of fast disks used, which was our objective.
If we compare the behavior of traditional RAID5 with our proposal, we can see that AdaptRaid5 always achieves a much better performance. This happens because AdaptRaid5 knows how to take advantage of fast disks while RAID5 does not. The only exception to this rule appears when only 0 or 1 fast disks are used. In this case, AdaptRaid5 cannot use the fast disks in any special way.
The comparison between AdaptRaid5 and OnlyFast also shows that our proposal is a better one. On the one hand, AdaptRaid5 is much more consistent than OnlyFast and it does not present a bad performance in any of the configurations. On the other hand, our system always obtains a better performance than OnlyFast. AdaptRaid5 is faster because it takes advantage of the parallelism within a request (it has more disks), which is very important when only a few fast disks are available or when requests are large. Furthermore, when OnlyFast starts to take advantage of the parallelism (when more fast disks are used), AdaptRaid5 starts to use the slow disks less frequently, which out-weighs the improvements of OnlyFast.
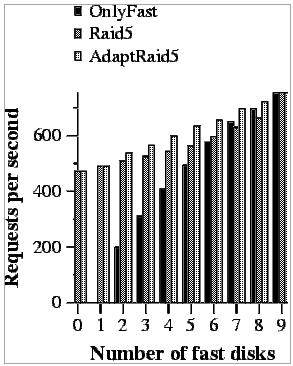
To do this evaluation we have measured the number of requests per second achieved by each evaluated system when 8Kbytes and 256Kbytes requests are done (workloads W8 and W256 described in Section 5.2) (Figures 9 and 10).


In this case, AdaptRaid5 is also better than RAID5, for the same reason as before. It knows how to use the fast disks. Furthermore, we can also see that the extra parallelism RAID5 can exploit is not enough compared to the benefit of only using fast disks for many of the requests.
When we compare AdaptRaid5 with OnlyFast, we observe that our proposal has a better performance than OnlyFast. This happens because AdaptRaid5 can use more disks and it can take advantage of the parallelism between requests.
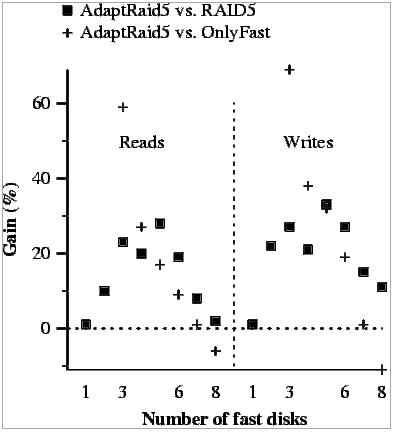
In the first case (Figure 11), where requests are 8Kbytes, we observe a very similar behavior as in the previous cases. The only difference is that the performance of RAID5 and OnlyFast gets closer to AdaptRaid5 than in previous experiments. This happens because on these read operations, only one disk is used per request and more parallelism between requests can be achieved by OnlyFast and the probability of using a slow disk decreases in RAID5.

In the second case (Figure 12), the requests are much larger and this has two effects. If we observe RAID5 performance, it remains unmodified when more fast disks are added. This is because all disks are used in the request and thus, slow disks are always included. If we focus on OnlyFast, we can see that it outperforms AdaptRaid5 when more than 6 fast disks are used. This happens because when these many fast disks are used, OnlyFast has enough parallelism within a request to obtain a good performance. On the other hand, AdaptRaid5 has to handle slow disks in many of the requests slowing down its performance. This means that if enough fast disks are used and only large reads are to be done, AdaptRaid5 is not the best solution.
As expected, our algorithm is significantly faster than the other ones tested. The reasons are the same ones we have been discussing so far. The only exception is when 8 fast disks are used. In this case, OnlyFast is faster as it can achieve enough parallelism between requests and no slow disks are ever used. Nevertheless, maintaining only one slow disk does not seem to be very reasonable, and in this case we would recommend to discard the old disk (unless the capacity is needed.)

Figure 14 presents the average read times obtained in these experiments. The first thing we can observe is that, in general, the more the slow disks are used, the longer it takes to perform read operations. The exception to this rule appears when only a few fast disks are used. In this case, the higher speed of fast disks cannot outweigh the parallelism obtained by the larger number of slow ones and the best read access time is achieved when slow disks are used half the time the fast ones.
It is also important to notice, that the curves are not perfect because there are other parameters that also have their effect in the performance. Changing the UF values also changes the placement of data and parity blocks, which also has an effect in performance.

Figure 15 presents the results of the same experiments, but for the average write time. In this figure we can observe the same behavior as with read operations.
Summarizing, the election of UF values is especially important if the number of fast disks is small and the higher performance of the fast disks cannot outweigh the parallelism of the large number of slow disks. Otherwise, using the fast disks as much as possible seems to be the way to go. Nevertheless, this election should also take capacity into account because different UF values achieve arrays with different capacities.