
|
||||||||||||||
|
![]()
![]()
![]()
Lei Guo![]() ,
Songqing Chen
,
Songqing Chen![]() ,
Zhen Xiao
,
Zhen Xiao![]() , Enhua
Tan
, Enhua
Tan![]() , Xiaoning Ding
, Xiaoning Ding![]() , and Xiaodong Zhang
, and Xiaodong Zhang![]()
|
|
|
|
|
|
|
|
|
|
|
|
|
{lguo, etan, dingxn, zhang}@cs.wm.edu |
sqchen@cs.gmu.edu |
xiao@research.att.com |
Existing studies on BitTorrent systems are single-torrent based, while more than 85% of all peers participate in multiple torrents according to our trace analysis. In addition, these studies are not sufficiently insightful and accurate even for single-torrent models, due to some unrealistic assumptions. Our analysis of representative BitTorrent traffic provides several new findings regarding the limitations of BitTorrent systems: (1) Due to the exponentially decreasing peer arrival rate in reality, service availability in such systems becomes poor quickly, after which it is difficult for the file to be located and downloaded. (2) Client performance in the BitTorrent-like systems is unstable, and fluctuates widely with the peer population. (3) Existing systems could provide unfair services to peers, where peers with high downloading speed tend to download more and upload less. In this paper, we study these limitations on torrent evolution in realistic environments. Motivated by the analysis and modeling results, we further build a graph based multi-torrent model to study inter-torrent collaboration. Our model quantitatively provides strong motivation for inter-torrent collaboration instead of directly stimulating seeds to stay longer. We also discuss a system design to show the feasibility of multi-torrent collaboration.
BitTorrent [8] is a new generation of Peer-to-Peer (P2P) system that has become very popular recently. According to a recent CNN report, BitTorrent traffic represents 53% of all P2P traffic on the Internet in June 2004 [16]. Unlike traditional P2P systems such as Gnutella [1], KaZaa [2], and eDonkey/eMule/Overnet [3], in which peers sharing different files are organized together and exchange their desired files with each other, BitTorrent organizes peers sharing the same file into a P2P network and focuses on fast and efficient replication to distribute the file. In BitTorrent, a file is divided into small chunks, and a peer can download multiple chunks of the file in parallel. Peers with different file chunks are stimulated to exchange with each other through a ``tit-for-tat'' incentive mechanism, which enables peers with high uploading bandwidth to have corresponding high downloading bandwidth. In this way, BitTorrent prevents free riding effectively, which is very common in early P2P systems [5]. P2P systems for exchanging different files such as KaZaa and eMule use participation levels or credit/reputation systems to track the contribution of each peer, and encourage peers to contribute by giving higher service priority to those peers with more contribution. However, such systems are either too complex and unrealistic or very easy to be circumvented [4,6]. Compared to these systems, the direct ``tit-for-tat'' mechanism of BitTorrent is very simple and effective. In practice, BitTorrent-like systems scale fairly well during flash crowd period and are now widely used for various purposes, such as for distributing large software packages [7,14].
Research has been conducted to study the effectiveness of BitTorrent-like systems [7,14,17,18,23]. The most recent work shows the stability of BitTorrent-like systems through a fluid model, and verifies the effectiveness of the current incentive mechanism [18]. However, this fluid model assumes a Poisson arrival model for the requests, which has been shown to be unrealistic during a long period (eight months) of trace study [17]. Consequently, the model can only characterize the performance of the BitTorrent system under stable conditions. In reality, as shown by our trace analysis, the stable period is very short. In addition, all existing studies on BitTorrent-like systems focus on the behaviors of single-torrent systems only, while our traces show that most peers ( > 85%) participate in multiple torrents.
In this work, we present an extensive study of BitTorrent-like P2P systems through measurements, trace analysis, and modeling. We first study the evolution of BitTorrent systems based on realistic assumptions analyzed from traces. We find that although the existing system is effective to address the ``flash crowd'' problem upon the debut of a new file, it has the following limitations:
Motivated by the results for the single-torrent system, we further study the multi-torrent system through trace analysis and modeling. Although it was generally understood that collaboration among multiple torrents might overcome some of the limitations of the single-torrent system, to our best knowledge, our work is the first to quantitatively and comprehensively analyze the multi-torrent system. In detail, we (1) characterize the peer request pattern in multiple torrents; (2) study the service potentials a torrent can provide to and get from other torrents; (3) demonstrate the benefit of inter-torrent collaboration. In addition, we discuss a new architecture to facilitate inter-torrent collaboration and show the feasibility and compatibility to the current BitTorrent systems.
Our contributions in this work are:
The remainder of the paper is organized as follows. Section 2 presents related work. We demonstrate the limitations of existing BitTorrent-like systems through measurements, trace analysis, and modeling in Section 3, and present our multi-torrent model in Section 4. Section 5 proposes and discusses an architecture for inter-torrent collaboration. We make concluding remarks in Section 6.
The amount of P2P traffic and the population of P2P users on the Internet keeps increasing. A lot of studies have been performed on the measurements, modeling, and algorithms of different P2P systems.
Measurement studies [19,20] characterize the P2P traffic over the Internet, including Napster, Gnutella, and KaZaa systems. Study [12] analyzes the popularity of P2P content over the Internet and characterizes the ``download at most once" property of P2P clients. Extensive measurements and traffic analysis on BitTorrent systems have also been conducted recently. Study [14] analyzes a five-month workload of a single BitTorrent system for software distribution that involved thousands of peers, and assesses the performance of BitTorrent at the flash crowd period. In [7], authors analyze the BitTorrent traffic of thousands of torrents over a two-month period, with respect to file characteristics and client access characteristics. Work [17] presents the current infrastructure of BitTorrent file sharing systems, including the Web servers/mirrors for directory service, meta-data distribution, and P2P content sharing. The authors also find that the arrival, abort, and departure processes of downloaders do not follow a Poisson distribution in the eight-month trace they collected, which was assumed in the previous modeling study [18].
A queuing model for P2P file sharing systems is proposed in [11]. Study [23] analyzes the service capacity of BitTorrent-like systems, and finds that multi-part downloading helps P2P systems to improve performance during flash crowd period. Study [18] further characterizes the overall performance of BitTorrent-like systems using a simple fluid model, and analyzes the effectiveness of BitTorrent incentive mechanism using game theory. Study [15] introduces a probabilistic model of coupon replication systems, and analyzes the performance under an environment where neither altruistic user behaviors nor load balancing strategies (such as rarest first in BitTorrent) are supported.
Study [22] proposes an interest-based content location approach for P2P systems. By self-organizing into small groups, peers with the same interest can collaborate more efficiently, which is similar to the BitTorrent networks, where all peers share the same file. In [21], a P2P protocol is proposed for bulk data transfer, which aims to improve client performance and to reduce server load, by using enhanced algorithms over BitTorrent systems.
Different from all studies above, our modeling and trace analysis provide an understanding of torrent evolution in the BitTorrent systems and the relation among multiple torrents over the Internet. Furthermore, our results reveal three limitations in current BitTorrent systems, and propose an innovative architecture to facilitate inter-torrent collaboration, which represents the first step towards making the current BitTorrent-like system a reliable and efficient content delivery vehicle.
In a BitTorrent system, the content provider creates a meta file (with the .torrent suffix name) for the torrent file it wants to share, and publishes the meta file on a Web site. Then the content provider starts a BitTorrent client with a full copy of the torrent file as the original seed. For each torrent file, there is a tracker site, whose URL is encoded in the meta file, to help peers find each other to exchange the file chunks. A user starts a BitTorrent client as a downloader at the beginning to download file chunks from other peers or seeds in parallel. A peer that has downloaded the file completely also becomes a seed that could in turn provide downloading service to other peers. All peers in the system, including both downloaders and seeds, self-organize into a P2P network, known as a torrent. The initial seed can leave the torrent when there are other seeds available, and content availability and system performance in the future depend on the arrival and departure of downloaders and other seeds.
Previous research has studied BitTorrent-like systems through trace analysis and modeling, and verified its effectiveness during flash crowds, which normally happen soon upon the debut of a new file [18]. However, no existing work has characterized overall client performance in the lifetime of a torrent when the file popularity changes. This is particularly important for BitTorrent-like systems where service availability relies purely on the voluntary participation of peers. This is in contrast to a client-server model where a permanent site (i.e., a server) can provide persistent service.
In this section, we study torrent evolution, downloading service availability, client performance fluctuation, and service fairness in BitTorrent-like systems based on torrent popularity characterization. We propose an evolution model for BitTorrent-like systems and analyze the torrent lifespan, ratio of failed peers, and the service policy of seeds, based on both the modeling and trace analysis.
In this study, we analyze and model BitTorrent
traffic based on two kinds of traces. The first one contains the statistics
collected from two popular dedicated tracker sites (although each torrent can
have its own tracker site, there are many dedicated tracker sites on the
Internet providing persistent service, each of which may host thousands of
torrents), sampled every half an hour for 48 days from 2003-10-23 to 2003-12-10.
This trace was collected by
In order to better understand BitTorrent traffic over the Internet, we also collected the BitTorrent meta file downloading trace from a large commercial server farm hosted by a major ISP and a large group of home users connected to the Internet via a well-known cable company, using the Gigascope appliance [10], from 2004-09-28 to 2004-10-07. The server farm trace includes about 50 tracker sites hosting hundreds of torrents, and the cable network trace includes about 3,000 BitTorrent users (by IP addresses) requesting thousands of torrents on the Internet. Both traces include the first IP packets of all HTTP downloading of the .torrent files, with the timestamp when the packet is captured (the downloading time of the .torrent file). This timestamp represents the peer arrival time to the torrent. We also extract the timestamp encoded in each .torrent file, which is the creation time of the meta file and represents the torrent birth time.
|
|
|
|
|
(a) Tracker trace |
(b) Server farm trace |
(c) Cable network trace |
|
Figure 1: The complementary CDF distribution of peer arrival time (time of a peer's first request to a torrent or time when a meta file was downloaded) after torrent birth for three BitTorrent traces (y-axis is in log scale) |
||
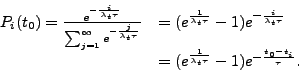
Figure 1(a) shows the complementary CDF (CCDF) distribution of the time after torrent birth for the requests to all fully-traced torrents in the tracker trace. For peers downloading the file in multiple sessions, only the first requests are considered. The y-axis at time t denotes the total number of requests for all torrents in the trace minus the cumulative number of requests for all torrents after time t since they are born. Figures 1(b) and 1(c) show the CCDF distribution of the time when a .torrent file was downloaded after torrent birth in the server farm and in the cable network, respectively. Note that y-axis is in log scale in the three figures.
All three curves can be fitted with straight lines. This
consistent trend strongly suggests that after a torrent is born, the number of
peer arrivals to the torrent decreases exponentially with time in general. To
validate that this conjecture holds for individual torrents as well, we use the
least square method to fit the logarithm of the complementary of the number of
peer arrivals for each torrent in the tracker trace. We define the relative
deviation of the fitting for the number of requests at a time instant as ![]() , where
, where ![]() is the actual complementary value of the
number of requests and
is the actual complementary value of the
number of requests and ![]() is the fitting result. Figure 2 shows the distribution of average fitting
deviation for each fully-traced torrent that has at least 20 peers during its
lifetime. In this figure, each point in the x-axis denotes a torrent,
sorted in non-ascending order of torrent population during the entire lifetime,
and the corresponding value in y-axis denotes the average of relative fitting
deviation of this torrent. We can see the fitting is more accurate for torrents
with larger population, and the overall average relative deviation is only
about 6%. We do not fit the curve for individual torrents in the server farm
and cable network trace, because the data collection duration is short so that
they do not cover the whole lifespans of torrents. In
the remainder part of this paper, we only use the tracker trace for modeling
and analysis.
is the fitting result. Figure 2 shows the distribution of average fitting
deviation for each fully-traced torrent that has at least 20 peers during its
lifetime. In this figure, each point in the x-axis denotes a torrent,
sorted in non-ascending order of torrent population during the entire lifetime,
and the corresponding value in y-axis denotes the average of relative fitting
deviation of this torrent. We can see the fitting is more accurate for torrents
with larger population, and the overall average relative deviation is only
about 6%. We do not fit the curve for individual torrents in the server farm
and cable network trace, because the data collection duration is short so that
they do not cover the whole lifespans of torrents. In
the remainder part of this paper, we only use the tracker trace for modeling
and analysis.
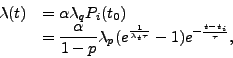
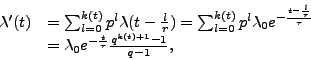
We define the torrent popularity at a time instant
as the peer arrival rate of the torrent at that time, which is the derivative
of the peer arrival time distribution of that torrent. Since the derivative of
an exponential function is also an exponential function, we assume that the
peer arrival rate of a torrent follows an exponential decreasing rule with time
![]()
where ![]() is the initial arrival rate when the torrent
starts, and
is the initial arrival rate when the torrent
starts, and ![]() is the attenuation parameter of the torrent
evolution. In Section 3.3, we will use a fluid
model to evaluate our assumption again.
is the attenuation parameter of the torrent
evolution. In Section 3.3, we will use a fluid
model to evaluate our assumption again.
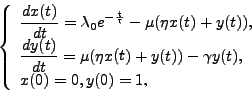
We define the torrent lifespan as the duration from the birth of the torrent to the time after which there is no complete copy of the file in the system, and the new arriving peers cannot complete downloading. To simplify the modeling, we assume that the initial seed exits the system as soon as a downloader has downloaded the file completely. In practice, the initial seed may stay online in the system for a longer time, and some seeds may return to the system to serve the content.
The inter-arrival time between two successive
arriving peers ![]() can be approximated as
can be approximated as ![]() . Denote the rate at which seeds leave
the system as
. Denote the rate at which seeds leave
the system as ![]() , then the average
service time of a seed can be approximated as
, then the average
service time of a seed can be approximated as ![]() . As shown in Figure 3, peer
. As shown in Figure 3, peer ![]() and peer
and peer ![]() +1 are the
+1 are the ![]() -th and (
-th and (![]() +1)-th arriving peers in the torrent, at the time
+1)-th arriving peers in the torrent, at the time ![]() and
and ![]() , respectively. The inter-arrival
time between peer
, respectively. The inter-arrival
time between peer ![]() and peer
and peer ![]() +1 can be estimated as
+1 can be estimated as ![]() . Peer
. Peer ![]() downloads the file with speed
downloads the file with speed ![]() and then stays in the torrent for a time duration
and then stays in the torrent for a time duration ![]() . Peer
. Peer ![]() +1 downloads at speed
+1 downloads at speed ![]() . According to the exponential
decrease of peer arrival rate, the inter-arrival time
of peers will grow exponentially, and finally there will be only one seed at a
time. When the peer arrival rate
. According to the exponential
decrease of peer arrival rate, the inter-arrival time
of peers will grow exponentially, and finally there will be only one seed at a
time. When the peer arrival rate ![]() is small enough
(
is small enough
(![]() is large), peer
is large), peer ![]() +1 can only be served by peer
+1 can only be served by peer ![]() , and we have
, and we have ![]() . Thus, when
. Thus, when ![]() , peer
, peer ![]() cannot complete downloading before peer
cannot complete downloading before peer ![]() leaves, and the torrent is dead. Using Equation 3.1, we get the torrent lifespan
leaves, and the torrent is dead. Using Equation 3.1, we get the torrent lifespan
Equation 3.2 shows the
expectation of the real torrent lifespan. To verify Equation 3.2, we compute the initial peer arrival rate ![]() and the torrent attenuation parameter
and the torrent attenuation parameter ![]() for fully
traced torrents in the tracker trace. From Equation 3.1,
we have
for fully
traced torrents in the tracker trace. From Equation 3.1,
we have
|
|
(3.3) |
Both ![]() and
and ![]() for each peer
arrival can be extracted from the trace and we get
for each peer
arrival can be extracted from the trace and we get ![]() and
and ![]() using linear regression. We also compute
the seed leaving rate
using linear regression. We also compute
the seed leaving rate ![]() as the the
reciprocal of the average seed service time, which is extracted from the trace,
too. Figure 4 shows the comparison of torrent
lifespan computed from the tracker trace (indicated by trace) and that
from the Equation 3.2 (indicated by model).
In this figure, each point in x-axis denotes a torrent, while each point
in y-axis denotes the measurement result or the modeling result of
torrent lifespan. The torrents in the x-axis are sorted in non-ascending
order of the modeling results of torrent lifespans.
As shown in the figure, our model fits the real torrent lifespan very well. The
average lifespan of torrents is about 8.89 days based on the trace analysis and
8.34 days based on our model. The lifespans of most
torrents are between 30 - 300 hours, and there are only a small number of
torrents with extremely short or extremely long lifespans.
as the the
reciprocal of the average seed service time, which is extracted from the trace,
too. Figure 4 shows the comparison of torrent
lifespan computed from the tracker trace (indicated by trace) and that
from the Equation 3.2 (indicated by model).
In this figure, each point in x-axis denotes a torrent, while each point
in y-axis denotes the measurement result or the modeling result of
torrent lifespan. The torrents in the x-axis are sorted in non-ascending
order of the modeling results of torrent lifespans.
As shown in the figure, our model fits the real torrent lifespan very well. The
average lifespan of torrents is about 8.89 days based on the trace analysis and
8.34 days based on our model. The lifespans of most
torrents are between 30 - 300 hours, and there are only a small number of
torrents with extremely short or extremely long lifespans.
The total population of a torrent (in the number of
peers) is
Among them, some peers may not be able to complete
downloading due to lack of seeds, which we call failed peers, denoted
as follows:
Thus, the downloading failure ratio of the torrent
is
|
|
|
|
|
(a) The comparison of torrent population: modeling and trace
analysis (in log-log scale) |
(b) The comparison of downloading failure ratio: modeling and
trace analysis (y-axis is in log scale) |
(c) The relation between torrent population and downloading
failure ratio (y-axis is in log scale) |
|
Figure 5: Torrent population and downloading failure ratio for all fully-traced torrents |
||
Figure 5(a) shows the comparison of the torrent population computed from the tracker trace with that from our model for each individual fully-traced torrent. In this figure, each point in x-axis denotes a torrent, while each point in y-axis denotes the measurement result or the modeling result of the total population of the torrent during its entire lifespan. The torrents in the x-axis are sorted in non-ascending order of the modeling results of torrent populations. As evidenced by the figure, the modeling result and trace analysis are consistent. In addition, we can see that the distribution of the torrent population is heavily skewed: although there are several large torrents, most torrents are very small, and the average population of torrents is only about 102 peers.
Figure 5(b) shows the downloading failure ratio based on trace analysis and on our model (plotted in the similar manner as that of Figure 5(a)). The real failure ratio of torrents is slightly lower than what our model predicts, because there are some altruistic peers that serve the torrent voluntarily. That also explains why the torrent lifespan in the trace analysis (8.89 days) is slightly higher than that in our model (8.34 days). Furthermore, there are some torrents that have no failed peers in the trace because the seeds leave after the downloaders finish, but cannot be shown in the log scale plot. However, the average downloading failure ratio based on the trace analysis is still about 10%, which is non-trivial for a content distribution system.
Equation 3.5 implies that the
number of failed peers in a torrent is independent of the initial peer arrival rate.
Instead, the number of failed peers depends on the speed of torrent evolution
(the attenuation exponent of peer arrival rate) and the seed departure rate.
Figure 5(c) shows downloading failure
ratios of torrents and their corresponding populations (plotted in the similar
manner as that of Figure 5(a) and 5(b)). As reflected in the figure and indicated by
Equation 3.5, the larger the torrent population, the
lower the downloading failure ratio. It is interesting to note that the
population of torrents, sorted in non-ascending order of their corresponding
downloading failure ratios, forms several clear curves, each of which
represents those torrents with similar evolution patterns (the popularity
attenuation parameter ![]() ). On the
right side of the figure, the failure ratio of the torrents is 0 due to the
existence of some altruistic seeds, which always stay until the last downloader
completes.
). On the
right side of the figure, the failure ratio of the torrents is 0 due to the
existence of some altruistic seeds, which always stay until the last downloader
completes.
|
|
|
|
(a) The downloading speed distribution (complementary CDF, in
log-log scale) |
(b) The downloading progress distribution (complementary CDF) |
|
Figure 6: The peers abort downloading voluntarily |
|
In the above analysis, we assume that peers always complete their downloading unless they cannot. We do not consider peers that abort downloading voluntarily when seeds are still available in the torrent. A peer may abort downloading due to (1) loss of interest to the torrent file; (2) slow downloading speed or small downloading progress. Figure 6(a) shows the distribution of the average downloading speed of peers that voluntarily abort and peers that download the file completely. Figure 6(b) shows the distribution of downloading progress (the percentage of the entire file that has been downloaded) when peers abort downloading voluntarily. The figures indicate that the probability for a peer to abort downloading voluntarily is almost independent of its downloading speed and the current downloading progress. Hence, the voluntary aborting of some downloaders does not affect our analysis above.
Study [18] proposed a fluid model
for BitTorrent-like systems with constant peer
arrival rate. We follow the idea of the fluid model, but using the evolution of
peer arrival rate described in Equation 3.1. The
basic ODE (ordinary differential equation) set for the fluid model is
where the meanings of the parameters in our fluid model are listed in Table 1. These notations are adopted from work [18,23].
When the ODE set has two different real eigenvalues ![]() , the
resolution can be expressed as:
, the
resolution can be expressed as:
|
|
(3.8) |
where ![]() are
constant. The value of these constants and the detailed resolution of the fluid
model can be found in our technical report [13].
are
constant. The value of these constants and the detailed resolution of the fluid
model can be found in our technical report [13].
The average downloading speed of peers at time ![]() is
is
|
|
|
|
(a) Torrent evolution |
(b) Downloading speed |
|
Figure 7: Torrent evolution under the fluid model |
|
We use the tracker trace to validate the torrent evolution
model. Similar to the peer arrival rate, the modeling results fit the trace
better for torrents with larger populations. Figure 7(a) shows the torrent evolution by both our
fluid model and the analysis results of a typical torrent in the trace. The
figure shows that the number of downloaders increases
exponentially in a short period of time after the torrent's birth (the flash
crowd period), and then decreases exponentially, but at a slower rate. The
number of seeds also increases exponentially at first, and then decreases
exponentially at a slower rate. The peak time of the number of seeds lags
behind that of the number of downloaders. As a
result, ![]() increases until the torrent is dead, and the
resources of seeds cannot increase in proportion to service demand.
Furthermore, due to the random arrival of downloaders
and the random departure of seeds, average downloading performance fluctuates
significantly when the number of peers in the torrent is small, as shown in
Figure 7(b).
increases until the torrent is dead, and the
resources of seeds cannot increase in proportion to service demand.
Furthermore, due to the random arrival of downloaders
and the random departure of seeds, average downloading performance fluctuates
significantly when the number of peers in the torrent is small, as shown in
Figure 7(b).
|
|
|
|
|
|
(a) The downloading speed in the lifetime of a typical torrent |
(b) The downloading speed (in log scale) and the number of downloaders/seeds for each torrent at a time instant |
(c) The average downloading speed (in log scale) and the total number of downloaders/seeds for all torrents in the system |
|
|
Figure 8: Performance variations in BitTorrent systems |
|||
Figure 8(a) shows the performance variations of the torrent under two kinds of granularities. The instant speed represents the mean downloading speed of all peers in the torrent at that time instant, sampled every half an hour. The average speed represents the average value of the instant speed over the typical downloading time (the average downloading time of all peers). The figure shows that the client downloading speed at different time stages is highly diverse and can affect client downloading time significantly. The reason is that seeds play an important role in the client downloading performance. However, the generation of seeds is the same as the completeness of peer downloading, so the random fluctuation of downloading speed cannot be smoothed in the scale of typical downloading time when the number of peers is small.
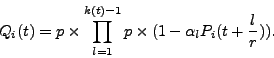
Figure 8(b) shows the
number of downloaders and seeds (a stack figure), and
the average downloading speed for each torrent in the trace at
Figure 8(c) shows the total number of peers in all torrents (a stack figure) and the average downloading speed of all downloaders in the trace at different time stages. The average downloading speed of all torrents is shown to be much more stable than that of one torrent. The reason is that the downloader/seed ratio is much more stable due to the large population of the system. This motivates us to balance the service load among different torrents, so that each torrent can provide relatively stable downloading performance to clients in its lifespan.
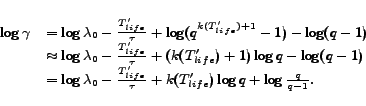
In a BitTorrent system, the service policy of seeds favors peers with high downloading speed, in order to improve the seed production rate in the system, i.e., to have these high speed downloaders complete downloading as soon as possible and wish they will then serve other downloaders. In this subsection, we investigate whether this wish comes true in practice.
|
|
|
|
(a) The peer downloading speed and contribution ratio |
(b) The the number of torrents that each
peer involves and the corresponding contribution ratio |
|
Figure 9: Fairness of seed service policy in BitTorrent systems (y-axis is in log scale) |
|
We define the contribution ratio of a peer as the total uploaded bytes over the total downloaded bytes of the peer. Figure 9(a) shows the peer downloading speed and the corresponding contribution ratio extracted from the trace. In this figure, each point in the x-axis denotes a peer, while the left y-axis denotes the contribution ratio of this peer, and the right y-axis denotes the average downloading speed of this peer. On the x-axis, peers are sorted in non-ascending order of their contribution ratios. The figure shows the rough trend that the peer contribution ratio increases when the downloading speed decreases. That is, the higher the downloading performance peers have, the less uploading service they actually contribute. This indicates that peers with high speed finish downloading quickly and then quit the system soon, which defeats the design purpose of the seed service policy.
Figure 9(b) shows the number of torrents that each peer involves and its corresponding contribution ratio (plotted in the similar way as that of Figure 9(a)). The figure shows no distinguishable correlation between the two, indicating that the main reason for seeds to leave old torrents is not to start new downloading tasks.
In summary, we observe that the BitTorrent's biased seed service policy in favor of high speed downloaders really affects the fairness to peers in downloading, and an incentive mechanism is needed to encourage seeds to contribute.
In the previous section, we have shown that client performance fluctuates significantly in single-torrent systems, but is very stable when aggregated over multiple torrents. Based on this observation, in this section, we study the correlation among multiple torrents through modeling and trace analysis, aiming to look for solutions to enable inter-torrent collaboration.
Although different torrents are independent from each other in the current BitTorrent systems, they are inherently related by peers that request multiple torrent files. A peer may download a torrent file, serve as a seed for that torrent for a while, and then go offline to sleep for some period of time. The peer may return sometime later and repeat the activities above. Thus, a peer's lifecyle consists of a sequence of downloading, seeding, and sleeping activities. If a peer stops using BitTorrent for a long time that is much longer than its typical sleeping time, we consider the peer as dead.
In the current BitTorrent systems, a peer is encouraged to exchange file chunks with other peers that are downloading the same file instead of serving old torrent files it has downloaded. Thus, in our model, we assume each peer joins (downloading and seeding) each torrent at most once, and joins one torrent at a time. Having these assumptions, we start to characterize peers in multiple torrents.
|
|
|
|
|
|
(a) Torrent birth |
(b) Request arrival of all peers over all torrents |
(c) Peer birth |
|
|
Figure 10: The CDFs of torrent birth, peer request arrival, and peer birth over the trace collection time |
|||
In the multi-torrent environment, both torrents and peers
are born and die continuously. Figure 10(a) shows
the CDF of torrent birth in the trace (indicated by raw data) and our
linear fit. The average torrent birth rate (denoted as ![]() in the following context) is about 0.9454 torrent per hour. Figure
10(b) shows the CDF of torrent request arrivals
(for all peers over all torrents) and our linear fit. We define the torrent
request rate as the number of downloading requests for all torrents per
unit time in the multi-torrent system, denoted as
in the following context) is about 0.9454 torrent per hour. Figure
10(b) shows the CDF of torrent request arrivals
(for all peers over all torrents) and our linear fit. We define the torrent
request rate as the number of downloading requests for all torrents per
unit time in the multi-torrent system, denoted as ![]() in the
following context. Although the peer arrival rate of a single-torrent system
decreases exponentially as shown in Figure 1, the
torrent request rate in the multi-torrent system is almost a constant, about
133.39 per hour.
in the
following context. Although the peer arrival rate of a single-torrent system
decreases exponentially as shown in Figure 1, the
torrent request rate in the multi-torrent system is almost a constant, about
133.39 per hour.
Since both the torrent birth rate and torrent request rate
are almost constant, it is natural to assume that the peer birth rate
(denoted as ![]() in the following context) is also a constant. A
peer is born when it appears in the system for the first time.
However, as shown in Figure 10(c), the peer birth
rate is high at the beginning of the trace collection duration, and then
converges to a constant rate asymptotically. The reason is that peers appear in
the trace for the first time may actually be born before the trace collection,
and the number of such peers decreases quickly after the trace collection
starts. Thus, we take the asymptotic birth rate as the real birth rate of
peers, which is about 19.37 per hour.
in the following context) is also a constant. A
peer is born when it appears in the system for the first time.
However, as shown in Figure 10(c), the peer birth
rate is high at the beginning of the trace collection duration, and then
converges to a constant rate asymptotically. The reason is that peers appear in
the trace for the first time may actually be born before the trace collection,
and the number of such peers decreases quickly after the trace collection
starts. Thus, we take the asymptotic birth rate as the real birth rate of
peers, which is about 19.37 per hour.
The constant peer birth rate and torrent request rate
indicate that each peer only joins a limited number of torrents. However, the
request rate of a peer might still change over time. We define the peer
request rate as the number of requests a peer submits for different
torrents per unit time. Assume the peer request rate can be expressed as
where ![]() is the time duration after the peer is born,
is the time duration after the peer is born, ![]() is the initial request rate, and
is the initial request rate, and ![]() is the attenuation
parameter of the request rate. When
is the attenuation
parameter of the request rate. When ![]() , the peer has a constant request rate;
when
, the peer has a constant request rate;
when ![]() , the peer has an increasing request rate.
, the peer has an increasing request rate.
The inter-arrival time between two successive requests of a
peer ![]() is
is ![]() . Thus, we have
. Thus, we have
|
|
(4.11) |
|
|
|
|
|
(a) The attenuation of peers' requesting rates and number of
torrents peers request (y-axis is in log scale) |
(b) The inter-arrival time of peers' requests and number of
torrents they join (in log-log scale) |
(c) The downloading speed and number of torrents peers join
(y-axis is in log scale) |
|
Figure 11: The request pattern of peers |
||
We extract ![]() and
and ![]() from the trace for each peer requesting multiple torrents, and use
linear regression to compute
from the trace for each peer requesting multiple torrents, and use
linear regression to compute ![]() and
and ![]() . Figure 11(a) shows the number of torrents that
each peer requests and the corresponding
. Figure 11(a) shows the number of torrents that
each peer requests and the corresponding ![]() . In this figure, each point in the x-axis denotes a peer,
while the left y-axis denotes the
. In this figure, each point in the x-axis denotes a peer,
while the left y-axis denotes the ![]() value of this peer,
and the right y-axis denotes the number of torrents this peer
participates. In x-axis, peers are sorted in non-ascending order of the
number of torrents they join. As shown in the figure, the value of parameter
value of this peer,
and the right y-axis denotes the number of torrents this peer
participates. In x-axis, peers are sorted in non-ascending order of the
number of torrents they join. As shown in the figure, the value of parameter ![]() in Equation 4.10 is very large,
with the mean value of about 77 years, which implies that the average request
rates of peers do not change significantly over time. Further,
in Equation 4.10 is very large,
with the mean value of about 77 years, which implies that the average request
rates of peers do not change significantly over time. Further, ![]() is
independent of the number of torrents that peers join. Thus, we can assume that
the request processes of peers are Poisson-like processes with constant average
request rates.
is
independent of the number of torrents that peers join. Thus, we can assume that
the request processes of peers are Poisson-like processes with constant average
request rates.
Figure 11(b) shows
the average inter-arrival time of torrent requests for peers requesting
multiple torrent files (plotted in the similar manner as that of Figure 11(a)). As shown in the figure, it is
intuitive to find that the upper bound of the number of torrents each peer
requests increases with the decrease of inter-arrival time. However, for peers
with similar request rates, the number of torrents
they request are very diverse, since they stay in the system for different time
durations. Figure 11(c) further plots the
downloading speed versus the number of torrents peers join (plotted in the
similar manner as that of Figure 11(a)).
There is no strong correlation between the two for peers with downloading speed
![]() 1 KB per second. This implies that for peers whose downloading
speed is large enough, the numbers of torrent files different peers request do
not depend on their request rates and their downloading speed.
1 KB per second. This implies that for peers whose downloading
speed is large enough, the numbers of torrent files different peers request do
not depend on their request rates and their downloading speed.
Thus, we assume that a peer joins a new torrent with probability ![]() . For
. For ![]() peers
in the system, during their whole lifecycles, there are
peers
in the system, during their whole lifecycles, there are ![]() peers
that request at least
peers
that request at least ![]() torrents. Ranking peers in non-ascending
order of the number of torrents they join, the number of torrents that a peer
ranked
torrents. Ranking peers in non-ascending
order of the number of torrents they join, the number of torrents that a peer
ranked ![]() joins is
joins is
In addition, a peer has the probability ![]() to
download exactly 1 file, probability
to
download exactly 1 file, probability ![]() to download exactly
2 files, and probability
to download exactly
2 files, and probability ![]() to download exactly
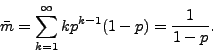
to download exactly ![]() files. So the mean number of torrents that a peer joins is:
files. So the mean number of torrents that a peer joins is:
|
|
(4.13) |
|
|
|
|
(a) For all peers in the trace |
(b) For peers born in the middle of trace collection time |
|
Figure 12: Torrent involvement of peers (x-axis is in log scale) |
|
Figure 12(a) shows the
distribution of number of torrent files that each peer downloads in the trace.
The curve in the figure is a little convex, deviating from what Equation 4.12 predicts (a straight line when ![]() -axis
is in log scale). The reason is that the number of torrents joined by peers
born before the trace collection is under-estimated, since some of these
requests cannot be recorded in the trace. A similar situation exists for peers
that are not dead before the end of trace collection.
-axis
is in log scale). The reason is that the number of torrents joined by peers
born before the trace collection is under-estimated, since some of these
requests cannot be recorded in the trace. A similar situation exists for peers
that are not dead before the end of trace collection.
Figure 12(b) shows
the distribution of number of torrents joined by each peer that was born in the
middle of the trace collection duration (indicated by raw data) and
our linear fit. The curve fits Equation 4.12 very
well, and we estimate from the analysis that ![]() , while the average number of torrents
each peer joins is about
, while the average number of torrents
each peer joins is about ![]() .
.
To verify the probability model we use in the above
analysis, we estimate ![]() in another way as follows. Assuming the
peer birth rate is
in another way as follows. Assuming the
peer birth rate is ![]() and the torrent request rate is
and the torrent request rate is ![]() , since each peer joins
, since each peer joins ![]() torrents during its lifetime in average, we
have
torrents during its lifetime in average, we
have
|
|
(4.14) |
Based on the peer request arrival rate and the peer birth rate
we derived before (see Figure 10(b) and 10(c)), we have ![]() . This is
very close to the value we got from Equation 4.12,
. This is
very close to the value we got from Equation 4.12, ![]() , meaning that there are more than
85% peers joining multiple torrents.
, meaning that there are more than
85% peers joining multiple torrents.
|
|
|
|
|
(a) The probability distribution of seeding time |
(b) The probability distribution of sleeping time |
|
|
Figure 13: The seeding time and sleeping time of peers (y-axis is in log scale) |
||
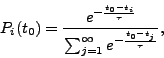
Having characterized the torrent request pattern of peers,
finally we consider the distribution of the seeding time and the sleeping time
of peers. According to our fluid model, ![]() represents the average seeding time.
Figure 13(a) and 13(b)
show the probability distribution functions of the peer seeding time and the peer
sleeping time in the system. Note that the
represents the average seeding time.
Figure 13(a) and 13(b)
show the probability distribution functions of the peer seeding time and the peer
sleeping time in the system. Note that the ![]() -axis is in log scale.
Both the peer seeding time and sleeping time roughly follow the exponential
distribution with probability density function
-axis is in log scale.
Both the peer seeding time and sleeping time roughly follow the exponential
distribution with probability density function ![]() , and
, and ![]() , respectively. Based on the trace analysis, we estimate
, respectively. Based on the trace analysis, we estimate ![]() hours, and
hours, and ![]() hours.
hours.
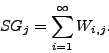
In this part we study how different torrents are connected through peers that download multiple files, based on our previously verified assumptions.
For simplification, we consider a homogeneous multi-torrent
environment where all torrents and peers have the same ![]() ,
, ![]() ,
, ![]() ,
, ![]() ,
, ![]() ,
, ![]() , and average sleeping time. We denote each torrent in the system
as torrent
, and average sleeping time. We denote each torrent in the system
as torrent ![]() with birth time
with birth time ![]() (
( ![]() ). For any two torrents that are born
successively, torrent
). For any two torrents that are born
successively, torrent ![]() first born and torrent
first born and torrent ![]() born
next, we have
born
next, we have ![]() and
and ![]() .
.
Assume the probability that a peer selects torrent ![]() at time
at time ![]() as its
as its ![]() -th torrent is
-th torrent is ![]() ,
, ![]() when
when ![]() . We also
denote
. We also
denote ![]() as
as ![]() for simplicity.
Without loss of generality, we assume that the most recently born torrent by
time
for simplicity.
Without loss of generality, we assume that the most recently born torrent by
time ![]() is torrent 1, and
is torrent 1, and ![]() satisfies
satisfies
|
|
(4.15) |
where ![]() ,
, ![]() . Thus, we have
. Thus, we have
|
|
(4.16) |
For a peer that requests its ![]() -th torrent file, the peer does not
select the torrents that it has requested. Assuming
-th torrent file, the peer does not
select the torrents that it has requested. Assuming
the peer arrival rate of a torrent can be expressed as
where ![]() . When
. When ![]() , we have
, we have ![]() and
and ![]() . Comparing Equation 3.1 with 4.18, we have
. Comparing Equation 3.1 with 4.18, we have ![]() .
.
Considering that a peer in a torrent may have downloaded
files from other torrents, we can model the relationship among different
torrents in the P2P system as a directed graph. Each node in the graph
represents a torrent. A directed edge from torrent ![]() to torrent
to torrent ![]() denotes that some peers in torrent
denotes that some peers in torrent ![]() have downloaded
the file from torrent
have downloaded
the file from torrent ![]() , and thus have the potential to provide
service to peers in torrent
, and thus have the potential to provide
service to peers in torrent ![]() , even though they are not in torrent
, even though they are not in torrent ![]() currently. The weight of the directed edge
currently. The weight of the directed edge ![]() represents
the number of such peers. For simplicity, we define
represents
the number of such peers. For simplicity, we define ![]() .
.
The graph changes dynamically over time. Now let us
consider the graph at time ![]() . During time
. During time
![]() ,
, ![]() , there are
, there are ![]() peers
who joined torrent
peers
who joined torrent ![]() . Let
. Let ![]() . During time
. During time ![]() , these peers can download up to
, these peers can download up to ![]() torrents
completely in addition to torrent
torrents
completely in addition to torrent ![]() and may request (or be
requesting) the next torrent at time
and may request (or be
requesting) the next torrent at time ![]() . If torrent
. If torrent ![]() is not requested before the last requests during time
is not requested before the last requests during time ![]() , the probability of such events
is
, the probability of such events
is
|
|
(4.19) |
When ![]() , we have
, we have
|
|
(4.20) |
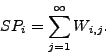
Therefore, the weighted out-degree of torrent ![]() represents the total potential capability its peers can provide to
peers in other torrents, denoted as
represents the total potential capability its peers can provide to
peers in other torrents, denoted as ![]() ,
where
,
where
|
|
(4.21) |
Correspondingly, the weighted in-degree of torrent ![]() represents the total potentials its peers can get from peers in
other torrents, denoted as
represents the total potentials its peers can get from peers in
other torrents, denoted as ![]() , where
, where
|
|
(4.22) |
|
|
|
|
|
(a) Weighted out-degree |
(b) Weighted in-degree |
|
|
Figure 14: The inter-torrent relation (y-axis is in log scale) |
||
Figure 14(a) and 14(b) show the weighted out-degree and weighted in-degree at a time instant based on trace analysis and our probability model, respectively. In the figures, each point in the x-axis denotes a torrent, sorted in non-ascending order of weighted out-degree or weighted in-degree. The right y-axis in the figures denotes torrent size, the number of peers in the torrent at this time instant. In general, torrents with more peers tend to have large out-degree and in-degree. The weighted out-degree and in-degree distribution according to our trace analysis follows power law rules roughly. It deviates from our model somewhat because of the heterogeneity of torrents in the real system.
In the multi-torrent environment, old peers that had
downloaded the file from a torrent may come back for other torrent files, and
the lifespan of this torrent can be extended if these old peers are willing to
provide service. Assume the request arrival rate of this torrent is ![]() and
and ![]() when
when ![]() . If we consider both new requesting peers and old returning
peers, the peer arrival rate of the torrent is
. If we consider both new requesting peers and old returning
peers, the peer arrival rate of the torrent is
|
|
(4.23) |
where ![]() and
and ![]() (
(![]() based
on our trace analysis).
based
on our trace analysis).
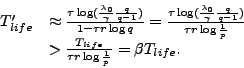
When ![]() ,
the torrent is truly dead. The lifespan of a torrent without inter-torrent
collaboration is
,
the torrent is truly dead. The lifespan of a torrent without inter-torrent
collaboration is ![]() . Denoting
the lifespan of the torrent with inter-torrent collaboration as
. Denoting
the lifespan of the torrent with inter-torrent collaboration as
![]() , then
, then ![]() , we have
, we have
It leads to ![]() . Thus
. Thus
|
|
(4.24) |
According to the trace analysis and our modeling, ![]() . So we have
. So we have
Comparing Equation 4.25
with 3.6, we can see that inter-torrent
collaboration is much more effective than decreasing the seed leaving rate ![]() for reducing downloading failure ratio. Decreasing seeds leaving
rate has polynomial effect, while inter-torrent collaboration has exponential
effect. For example, if the current downloading failure rate is 0.1, and seeds
can be stimulated to stay 10 times longer (i.e.,
for reducing downloading failure ratio. Decreasing seeds leaving
rate has polynomial effect, while inter-torrent collaboration has exponential
effect. For example, if the current downloading failure rate is 0.1, and seeds
can be stimulated to stay 10 times longer (i.e., ![]() will
decrease 10 times), then the downloading failure rate will decrease 10 times to
will
decrease 10 times), then the downloading failure rate will decrease 10 times to ![]() . However, by inter-torrent
collaboration, the downloading failure ratio can be as low as
. However, by inter-torrent
collaboration, the downloading failure ratio can be as low as ![]() . The reason is that extending
seed staying time only increases the service time for peers that arrive close
to the seed generation time. With the passage of time, the peer arrival rate
decreases exponentially, and finally the seed serving
time will not be long enough for newly arriving peers. On the other hand, by
exploiting inter-torrent collaboration, peers that have downloaded the file may
return multiple times during a much longer period, and the downloading failure
ratio can be significantly reduced to near zero.
. The reason is that extending
seed staying time only increases the service time for peers that arrive close
to the seed generation time. With the passage of time, the peer arrival rate
decreases exponentially, and finally the seed serving
time will not be long enough for newly arriving peers. On the other hand, by
exploiting inter-torrent collaboration, peers that have downloaded the file may
return multiple times during a much longer period, and the downloading failure
ratio can be significantly reduced to near zero.
In this section, we discuss the principle of a system design for multi-torrent collaboration. A more detailed discussion can be found in [13]. The system design and implementation are ongoing.
In BitTorrent systems, peers in
different torrents cannot collaborate because they cannot find and communicate
with each other. The inter-torrent relation graph presented in Section 4.2 motivates us to organize the tracker sites of
different torrents into an overlay network to help the peers sharing different
files find each other and coordinate the collaboration among these peers. In
such an overlay network, each tracker site maintains a Neighbor-Out Table
and a Neighbor-In Table to record the relationship with its
neighboring torrents. The Neighbor-Out Table records the torrents that
its peers can provide service to. The Neighbor-In Table records the
torrents whose peers can provide service to this torrent. When a peer ![]() joins a new torrent
joins a new torrent ![]() , it
uploads to its tracker site the information about from which torrents it had
downloaded files previously. Then
, it
uploads to its tracker site the information about from which torrents it had
downloaded files previously. Then ![]() 's
tracker site forwards this information to the tracker sites of those torrents
where
's
tracker site forwards this information to the tracker sites of those torrents
where ![]() had downloaded files from. By doing so, the torrents
that are created independently by different content providers are connected
together to form a tracker site overlay, as shown in Figure 15. Tracker site overlay also provides a built-in
mechanism to search content among multiple torrents. Currently, BitTorrent users have to rely on Web-based search engines
to look for the content they want to download.
had downloaded files from. By doing so, the torrents
that are created independently by different content providers are connected
together to form a tracker site overlay, as shown in Figure 15. Tracker site overlay also provides a built-in
mechanism to search content among multiple torrents. Currently, BitTorrent users have to rely on Web-based search engines
to look for the content they want to download.
BitTorrent assumes each peer is selfish, and exchanges file chunks with those peers that provide it the best service. The incentive mechanism in BitTorrent systems is instant, because each peer must get corresponding benefit at once for the service it provides. For multi-torrent collaboration, an exchange based mechanism can be applied for instant collaboration through the tracker site overlay, which still follows the ``tit-for-tat" idea.
First, peers in adjacent torrents in the overlay can exchange file chunks directly, such as torrent A, B in Figure 15. Second, if there exists a cycle among several torrents, then peers in adjacent torrents can exchange file chunks through the coordination of the tracker site overlay, such as torrent B, C, D, E in Figure 15. More specifically, when a peer q wants to get service from peers in other torrents, it sends a request to its tracker site with its list of downloaded files. Then the tracker forwards its request to the trackers in its Neighbor-In Table. These tracker sites then search their tables to find qualified peers, with whom this peer can exchange file chunks to get service.
When a peer q wants to get service from peers in other torrents and it has no service to exchange, it may join these torrents temporarily and download some chunks of the files, even if it does not want these files itself. Through the coordination of corresponding tracker sites, the peer can provide uploading service for these chunks only, and attribute its service contribution to the peers it wants to get service from, so that these peers can get benefit from the peers that q serves and offer q the service it needs. Since a file chunk can be served to multiple peers in the system, this method is very effective and the overhead is trivial. Research [6,9] presents similar idea of using file exchange as an incentive for P2P content sharing. Different from these studies, our system aims to share bandwidth as well as content across multiple P2P systems.
BitTorrent-like systems have become increasingly popular for object distribution and file sharing, and have contributed to a large amount of traffic on the Internet. In this paper, we have performed extensive trace analysis and modeling to study the behaviors of such systems. We found that the existing BitTorrent system provides poor service availability, fluctuating downloading performance, and unfair services to peers. Our model has revealed that these problems are due to the exponentially decreasing peer arrival rate and provides strong motivation for inter-torrent collaborations instead of simply giving seeds incentives to stay longer. We also discuss the design of a new system where the tracker sites of different torrents are organized into an overlay to facilitate inter-torrent collaboration with the help of an exchange based incentive mechanism.
We would like to thank our shepherd, Keith W. Ross, and the anonymous reviewers for their constructive comments. We are grateful to Oliver Spatscheck for many insightful discussions on this topic. Mikel Lzal helped us get access to their BitTorrent traces and William L. Bynum provided valuable comments on an early draft of the paper. This work is partially supported by the National Science Foundation under grants CNS-0098055, CNS-0405909, and CNS-0509054/0509061.
https://www.gnutelliums.com/.
https://www.kazaa.com/.
https://www.edonkey2000.com/.
Hack kazaa participation level - the easy answer.
https://www.davesplanet.net/kazaa/.
ADAR, E., AND B.HUBERMAN.
Free riding on gnutella.
Tech. rep., Xerox PARC, August 2000.
ANAGNOSTAKIS, K. G.,
AND GREENWALD, M. B.
Exchange-based incentive mechanisms for peer-to-peer file sharing.
In Proc. of IEEE ICDCS (March 2004).
BELLISSIMO, A., LEVINE, B. N., AND SHENOY, P.
Exploring the use of BitTorrent as the basis for a
large trace repository.
Tech. Rep. 04-41,
COHEN, B.
Incentives build robustness in BitTorrent.
In Proc. of Workshop on Economics of Peer-to-Peer Systems (May 2003).
COX, L. P., AND NOBLE, B. D.
Samsara - honor among thieves in P2P storage.
In Proc. of ACM SOSP (October 2003).
CRANOR, C., JOHNSON, T., AND SPATSCHECK, O.
Gigascope: a stream database for network
applications.
In Proc. of ACM SIGMOD (June 2003).
GE, Z., FIGUEIREDO, D. R.,
JAISWAL, S., KUROSE, J., AND TOWSLEY, D.
Modeling peer-peer file sharing systems.
In Proc. of IEEE INFOCOM (March 2003).
GUMMADI, K. P., DUNN, R. J., SAROIU,
S., GRIBBLE,
S. D., LEVY, H. M., AND ZAHORJAN, J.
Measurement, modeling, and analysis of a peer-to-peer file-sharing workload.
In Proc. of ACM SOSP (October 2003).
GUO, L., CHEN, S., XIAO, Z., TAN, E., DING, X., AND ZHANG, X.
Measurements, analysis, and modeling of BitTorrent
systems.
Tech. Rep. WM-CS-2005-08,
IZAL, M., URVOY-KELLER, G., BIERSACK, E., FELBER, P., HAMRA, A. A., AND GARC'ES-ERICE, L.
Dissecting BitTorrent: Five months in a torrent's
lifetime.
In Proc. of the 5th Annual Passive & Active Measurement Workshop
(April 2004).
MASSOULIE, L., AND VOJNOVIC, M.
Coupon replication systems.
In Proc. of ACM SIGMETRICS (June 2005).
PARKER, A.
The true picture of peer-to-peer file sharing.
https://www.cachelogic.com, 2004.
POUWELSE, J., GARBACKI, P., EPEMA, D., AND SIPS, H.
The BitTorrent P2P
file-sharing system: Measurements and analysis.
In Proc. of the 4th International Workshop on Peer-to-Peer Systems
(February 2005).
QIU, D., AND SRIKANT,
R.
Modeling and performance analysis of BitTorrent-like peer-to-peer networks.
In Proc. of ACM SIGCOMM (August 2004).
SAROIU, S., GUMMADI, K., DUNN, R., GRIBBLE, S., AND LEVY, H.
An analysis of Internet content delivery systems.
In Proc. of USENIX OSDI (December 2002).
SAROIU, S., GUMMADI, K., AND GRIBBLE, S.
A measurement study of peer-to-peer file sharing systems.
In Proc. of ACM/SPIE MMCN (January 2002).
SHERWOOD, R., BRAUD, R., AND BHATTACHARJEE, B.
Slurpie: A cooperative bulk data transfer protocol.
In Proc. of IEEE INFOCOM (March 2004).
SRIPANIDKULCHAI, K., MAGGS, B., AND ZHANG, H.
Efficient content location using interest-based locality in peer-to-peer
systems.
In Proc. of IEEE INFOCOM (March 2003).
YANG, X., AND D. VECIANA, G.
Service capacity of peer to peer networks.
In Proc. of IEEE INFOCOM (March 2004).
Measurements, Analysis, and Modeling of BitTorrent-like Systems
This document was generated using the LaTeX2HTML translator Version 2002-2-1 (1.70)
Copyright © 1993, 1994, 1995, 1996, Nikos Drakos, Computer
Based Learning Unit,
Copyright © 1997, 1998, 1999, Ross Moore, Mathematics
Department,
The translation was initiated by Lei Guo on 2005-08-01
![]()
![]()
![]()
|
Last changed: 22 Sept. 2005 aw |

![\includegraphics[width=0.325\textwidth]{matlab-file/torr-req-dt.eps}](img10.png)
![\includegraphics[width=0.33\textwidth]{matlab-file/farm-metainfo-dl-dt.eps}](img11.png)
![\includegraphics[width=0.33\textwidth]{matlab-file/cable-metainfo-dl-dt.eps}](img12.png)
![\includegraphics[width=0.35\textwidth]{matlab-file/tor-exp-individual.eps}](img14.png)
![\includegraphics[width=0.4\textwidth]{tor-death-jpg.ps}](img21.jpg)
![\includegraphics[width=0.33\textwidth]{matlab-file/torr-lifespan.eps}](img40.png)
![\includegraphics[width=0.325\textwidth]{matlab-file/torr-population.eps}](img44.png)
![\includegraphics[width=0.33\textwidth]{matlab-file/torr-fail-ratio.eps}](img45.png)
![\includegraphics[width=0.345\textwidth]{matlab-file/failratio-population.eps}](img46.png)
![\includegraphics[width=0.33\textwidth]{matlab-file/abort-speed.eps}](img47.png)
![\includegraphics[width=0.33\textwidth]{matlab-file/abort-ratio.eps}](img48.png)
![\includegraphics[width=0.35\textwidth]{matlab-file/torr-evolution.eps}](img49.png)
![\includegraphics[width=0.35\textwidth]{matlab-file/torr-evolution-speed.eps}](img50.png)
![\includegraphics[width=0.31\textwidth]{matlab-file/download-speed.eps}](img62.png)
![\includegraphics[width=0.345\textwidth]{matlab-file/torr-snapshot-popu.eps}](img63.png)
![\includegraphics[width=0.355\textwidth]{matlab-file/all-torr-speed.eps}](img64.png)
![\includegraphics[width=0.36\textwidth]{matlab-file/dlspeed-udratio.eps}](img65.png)
![\includegraphics[width=0.36\textwidth]{matlab-file/numtorr-udratio.eps}](img66.png)
![\includegraphics[width=0.34\textwidth]{matlab-file/torr-birth.eps}](img68.png)
![\includegraphics[width=0.33\textwidth]{matlab-file/peer-arrival.eps}](img69.png)
![\includegraphics[width=0.33\textwidth]{matlab-file/allu-ipidarrival.eps}](img70.png)
![\includegraphics[width=0.33\textwidth]{matlab-file/peer-sleeping-time-parameter.eps}](img71.png)
![\includegraphics[width=0.33\textwidth]{matlab-file/avgsleeptime-numtor.eps}](img72.png)
![\includegraphics[width=0.33\textwidth]{matlab-file/dlspeed-numtorr.eps}](img73.png)
![\includegraphics[width=0.5\textwidth]{matlab-file/num-torr-ipid-new.eps}](img86.png)
![\includegraphics[width=0.49\textwidth]{matlab-file/allu-num-torr-ipid-early.eps}](img87.png)
![\includegraphics[width=0.5\textwidth]{matlab-file/seeding-time.eps}](img88.png)
![\includegraphics[width=0.5\textwidth]{matlab-file/sleeping-time.eps}](img89.png)
![\includegraphics[width=0.35\textwidth]{matlab-file/outdegree.eps}](img111.png)
![\includegraphics[width=0.35\textwidth]{matlab-file/indegree.eps}](img112.png)
![\includegraphics[width=0.4\textwidth]{matlab-file/tor-graph.eps}](img169.png)