
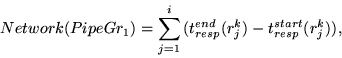
We use the following functions to denote the critical timestamps for connection conn and request r:
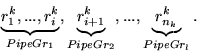
We consider the requests
rik,...,rnk to belong to the same pipelining group (denoted as
![]() )
if for any j
such that
)
if for any j
such that
![]() ,
,
![]() .
.
Thus for all the requests on the same connection connk:
r1k, ...
, rnkk, we define the maximum pipelining groups in such a way that
they do not intersect, e.g.,
Let us consider the following example. For convenience, let us denote
![]() .
.
Then
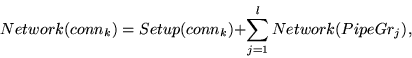
If connection connk is a newly established connection to retrieve a web page, we observe additional connection setup time:
otherwise the setup time is 0. Additionally, we define tstart(connk)= tsyn(connk) for a newly established connection, otherwise, tstart(connk)= treqstart(r1k).
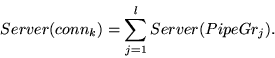
Similarly, we define the breakdown for a given connection connk:
All the above formulae use
trespend(r) to calculate response
time. An alternative way is to use as the end of a transaction the
time
trespack(r) when the ACK for the last byte of the
response is received by a server.
Figure 4 shows an
example of a simplified scenario where a 1-object page is downloaded
by the client: it shows the communication protocol for connection
setup between the client and the server as well as the set of
major timestamps collected by the EtE monitor on the server side. The
connection setup time measured on the server side is the time between
the client SYN packet and the first byte of the client request.
This represents a close approximation for the original
client setup time (we present more detail on this point
in Section 8 when reporting our validation
experiments).
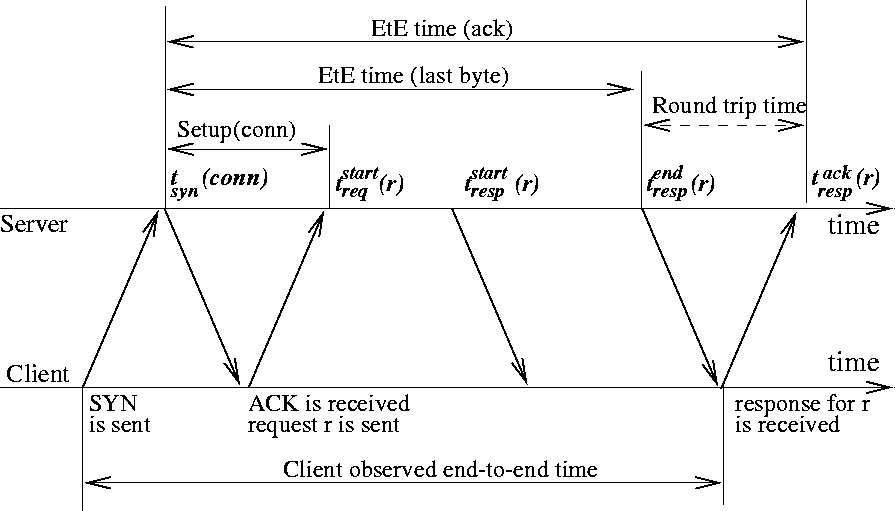 |
If the ACK for the last byte of the client response is not delayed or lost, trespack(r) is a more accurate approximation of the end-to-end response time observed by the client: it ``compensates'' for the latency of the first client SYN packet that is not measured on the server side. The difference between the two methods, i.e. EtE time (last byte) and EtE time (ack), is only a round trip time, which is on the scale of milliseconds. Since the overall response time is on the scale of seconds, we consider this deviation an acceptably close approximation. However, to avoid the problems with delayed or lost ACKs, EtE monitor determines the end of a transaction as the time when the last byte of a response is sent by a server.
Metrics introduced in this section account for packet retransmission. However, if the retransmission happens on connection establishment (i.e. due to dropped SYNs), EtE monitor cannot account for this.
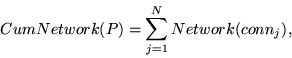
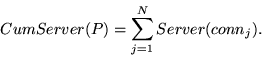
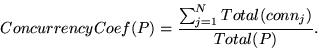
The functions
CumNetwork(P) and
CumServer(P) give the
sum of all the network-related and server processing portions of the
response time over all connections used to retrieve the web
page. However, the connections can be opened concurrently by the
browser. To evaluate the concurrency impact, we introduce
the page concurrency coefficient ConcurrencyCoef(P):
EtE monitor can distinguish the requests sent to a web server from clients behind proxies by checking the HTTP via fields. If a client page access is handled via the same proxy (which is typically the case, especially when persistent connections are used), EtE monitor provides correct measurements for end-to-end response time and other metrics, as well as provides interesting statistics on the percentage of client requests coming from proxies. Clearly, this percentage is an approximation, since not all the proxies set the via fields in their requests. Finally, EtE monitor can only measure the response time to a proxy instead of the actual client behind it.