
 |  |  | General Performance Trends |
General Performance Trends
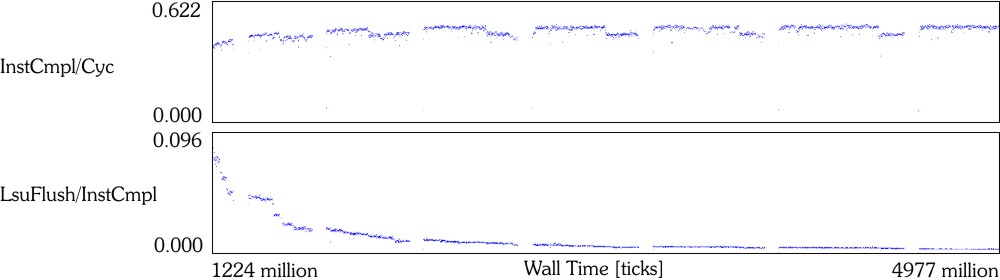
A graph over time of the warehouse thread's instruction per cycle and
flushes per instructions completed
A graph over time of the warehouse thread's instruction per cycle and
flushes per instructions completed.
|
| | AOS | |
|
Metric |
JIT-base |
start (Delta%) |
end (Delta%) |
JIT-opt0 (Delta%) |
|
IPC |
0.348 | 0.415 (+19.3%) | 0.489 (+42.5%) | 0.500 (+43.7%) |
|
LSU_FLUSH/INST_CMPL |
15.2% | 7.0% (-54.2%) | 0.3% (-97.4%) | 0.1% (-99.3%) |
|
INST_CMPL |
4.18M | 4.05M (+16.0%) | 5.84M (+42.6%) | 5.96M (+42.6%) |
|
|
Metrics across JIT and AOS configurations.
The top graph in Figure * presents
a graph of the IPC of a
warehouse thread over time.
For clarity of presentation, only the IPC trace records of the warehouse thread
are displayed;
all other Java threads are not shown.
The noticeable gaps in the warehouse trace records are stop-the-world
garbage collections, which
disable Java thread scheduling when it runs.
Two general performance anomalies are noticeable in this graph.
First, IPC improves over time.
The IPC in the left corner is around 0.41, while the IPC in the right corner is
above 0.49, a 20% increase.
Second, before each of the GCs there is a significant IPC degradation or drop.
We used the Performance Explorer to help us explore both of these phenomena.
| | | General Performance Trends |