| ||||||||||||||||||||||||||||||||||||||||||||||||||||
|
USENIX '05 Paper
[USENIX '05 Technical Program]
CHAMELEON: a self-evolving, fully-adaptive resource arbitrator for storage systemsSandeep Uttamchandani
sandeepu@us.ibm.com, yinli@eecs.berkeley.edu, {alvarezg,jdp}@us.ibm.com, agha@cs.uiuc.edu
AbstractEnterprise applications typically depend on guaranteed performance from the storage subsystem, lest they fail. However, unregulated competition is unlikely to result in a fair, predictable apportioning of resources. Given that widespread access protocols and scheduling policies are largely best-effort, the problem of providing performance guarantees on a shared system is a very difficult one. Clients typically lack accurate information on the storage system's capabilities and on the access patterns of the workloads using it, thereby compounding the problem. CHAMELEON is an adaptive arbitrator for shared storage resources; it relies on a combination of self-refining models and constrained optimization to provide performance guarantees to clients. This process depends on minimal information from clients, and is fully adaptive; decisions are based on device and workload models automatically inferred, and continuously refined, at run-time. Corrective actions taken by CHAMELEON are only as radical as warranted by the current degree of knowledge about the system's behavior. In our experiments on a real storage system CHAMELEON identified, analyzed, and corrected performance violations in 3-14 minutes--which compares very favorably with the time a human administrator would have needed. Our learning-based paradigm is a most promising way of deploying large-scale storage systems that service variable workloads on an ever-changing mix of device types.
|
 |
CHAMELEON can react to workload changes in a nimble manner, resulting in a marginal number of quality of service (QoS) violations. In our experiments on a real storage system using real-world workload traces, CHAMELEON managed to find the set of throttling decisions that yielded the maximum value of the optimization function, while minimizing the amount of throttling required to meet the targets and while maximizing the number of clients whose QoS requirements are satisfied. Since our approach does not depend on pre-existing device or workload models, it can be easily deployed on heterogeneous, large-scale storage systems about which little is known. Our ultimate vision, of which CHAMELEON is just a part, is to apply a variety of corrective actions to solve a variety of systems management problems while operating on incomplete information [25].
Section 2 presents the architecture of CHAMELEON. We then proceed to describe the main components: the models (Section 3), the reasoning engine (Section 4), the base heuristics (Section 5), and the feedback-based throttling executor (Section 6). Section 7 describes our prototype and experimental results. Section 8 reviews previous research in the field; we conclude in Section 9.
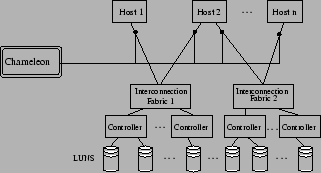
CHAMELEON is a framework for providing predictable performance to multiple
clients accessing a common storage infrastructure, as shown in
Figure 2. Multiple hosts connect to storage
devices in the back end via interconnection fabrics. CHAMELEON
can monitor, and optionally delay, every I/O processed by the
system; this can be implemented at each host (as in our prototype), or
at logical volume managers, or at block-level virtualization
appliances [9].
Each workload ![]() has a known SLA
has a known SLA![]() associated with it, and uses a fixed set of components--its invocation path--such as controllers, logical volumes,
switches, and logical units (LUNs).
When SLAs are not being met, CHAMELEON identifies and throttles workloads;
when it detects unused bandwidth, it unthrottles some of the
previously-throttled workloads.
associated with it, and uses a fixed set of components--its invocation path--such as controllers, logical volumes,
switches, and logical units (LUNs).
When SLAs are not being met, CHAMELEON identifies and throttles workloads;
when it detects unused bandwidth, it unthrottles some of the
previously-throttled workloads.
Our SLAs are conditional: a workload will be guaranteed a specified upper bound on average I/O latency, as long as its I/O rate (i.e., the throughput) is below a specified limit. An SLA is violated if the rate is below the limit, but latency exceeds its upper bound. If workloads exceed their stated limits on throughput, the system is under no obligation of guaranteeing any latency. Obviously, such rogue workloads are prime candidates for throttling; but in some extreme cases, well-behaved workloads may also need to be restricted. CHAMELEON periodically evaluates the SLAs, i.e., the average latency and throughput value of each workload; depending on how much the workload is being throttled, it receives tokens (one per I/O) for flow control using a leaky bucket protocol [24]. The periodic interval for SLA evaluation has to be large enough to smooth out bursty intervals, and small enough for the system to be reasonably responsive; we empirically set this interval to 60 s. in our prototype implementation.
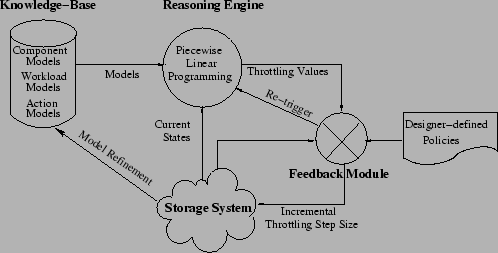
The core of CHAMELEON consists of four parts, as shown in Figure 3:
CHAMELEON builds models in an automatic, unsupervised way. It uses them to characterize the capabilities of components of the storage system, the workload being presented to them, and its expected response to different levels of throttling.
Models based on simulation or emulation require a fairly detailed knowledge of the system's internals; analytical models require less, but device-specific optimizations must still be taken into account to obtain accurate predictions [26]. Black-box models are built by recording and correlating inputs and outputs to the system in diverse states, without regarding its internal structure. We chose them because of properties not provided by the other modeling approaches: black-box models make very few assumptions about the phenomena being modeled, and can readily evolve when it changes. Because of this, they are an ideal building block for an adaptive, deployment-independent management framework that doesn't depend on preexisting model libraries.
At the same time, the black-box models used in CHAMELEON are less accurate than their analytical counterparts; our adaptive feedback loop compensates for that. The focus of this paper is to demonstrate how several building blocks can work together in a hybrid management paradigm; we do not intend to construct good models, but to show that simple modeling techniques are adequate for the problem. CHAMELEON's models are constructed using Support Vector Machines (SVM) [16], a machine-learning technique for regression. This is similar to the CART [29] techniques for modeling storage device performance, where the response of the system is measured in different system states and represented as a best-fit curve function. Table-based models [2], where system states are exhaustively recorded in a table and used for interpolation, are not a viable solution as they represent the model as a very large lookup table instead of the analytic expressions that our constraint solver takes as input.
Black-box models depend on collecting extensive amounts of performance samples. Some of those metrics can be monitored from client hosts, while others are tallied by each component--and collected via proprietary interfaces for data collection, or via standard protocols such as SMI-S [20].
A key challenge is bootstrapping, i.e., how to make decisions when models have not yet been refined. There are several solutions for this: run a battery of tests in non-production mode to generate baseline models, or run in a monitor-only mode until models are sufficiently refined, or start from a pre-packaged library (e.g., a convenient oversimplification such as an M/M/1 queueing system.) We follow different approaches for different model types.
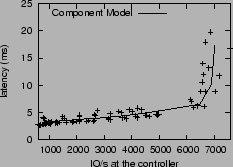
A component model predicts values of a delivery metric
as a function of
workload characteristics. CHAMELEON can in principle accommodate models
for any system component. In particular, the model for the response
time of a storage
device ![]() takes the form: c
takes the form: c![]() (req_size,
req_rate, rw_ratio, random/sequential, cache_hit_rate).
Function
(req_size,
req_rate, rw_ratio, random/sequential, cache_hit_rate).
Function ![]() is
inherently non-linear, but can be approximated as piecewise linear
with a few regions; a projection of a sample
is
inherently non-linear, but can be approximated as piecewise linear
with a few regions; a projection of a sample ![]() is shown in Figure 4.
Another source of error is the effect of multiple
workloads sending interleaved requests to the same component.
We approximate this nontrivial computation by estimating the wait
time for each individual stream as in a multi-class queueing
model [14]; more precise solutions [5]
incorporate additional workload characteristics. The effects of
caching at multiple levels (e.g., hosts, virtualization engines, disk
array controllers, disks) also amplify errors.
is shown in Figure 4.
Another source of error is the effect of multiple
workloads sending interleaved requests to the same component.
We approximate this nontrivial computation by estimating the wait
time for each individual stream as in a multi-class queueing
model [14]; more precise solutions [5]
incorporate additional workload characteristics. The effects of
caching at multiple levels (e.g., hosts, virtualization engines, disk
array controllers, disks) also amplify errors.
We took the liberty of bootstrapping component models by running
off-line calibration tests against the component in question: a
single, unchanging, synthetic I/O stream at a time, as part of a
coarse traversal of ![]() 's parameter space.
's parameter space.
Figure 5 shows the workload models for the SPC web-search trace [21] accessing a 24-drive RAID 1 LUN on an IBM FAStT 900 storage controller. From the graph, a workload request rate of 1500 IOPS in SPC translates to 2000 IOPS at the controller.
In practical systems, reliable workload data can only be gathered from production runs. We therefore bootstrap workload models by collecting performance observations; CHAMELEON resorts to throttling heuristics in the meantime, until workload models become accurate enough.
Function ![]() will, in general, also deviate from our linear model
because of performance-aware applications (that modify their access
patterns depending on the I/O performance they experience) and of
higher-level dependencies between applications that magnify the impact
of throttling.
will, in general, also deviate from our linear model
because of performance-aware applications (that modify their access
patterns depending on the I/O performance they experience) and of
higher-level dependencies between applications that magnify the impact
of throttling.
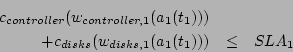
The reasoning engine computes the rate at which each workload stream should be allowed to issue I/Os to the storage system. It is implemented as a constraint solver (using piecewise-linear programming [8]) that analyzes all possible combinations of workload token rates and selects the one that optimizes an administrator-defined objective function, e.g., ``minimize the number of workloads violating their SLA'', or ``ensure that highest priority workloads always meet their guarantees''. Based on the errors associated with the models, the output of the constraint solver is assigned a confidence value.
It should be noted that the reasoning engine is not just invoked upon an SLA violation to decide throttle values, but also periodically to unthrottle the workloads if the load on the system is reduced.
We formulate the task of computing throttle values in terms of variables, objective function, and constraints as follows.
Variables:
One per workload, representing its token issue rate:
![]()
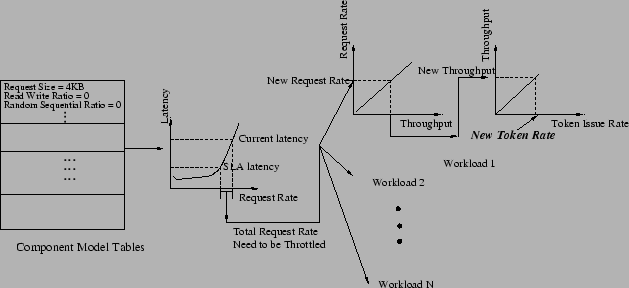
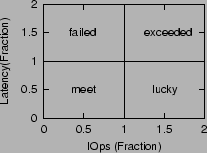
Objective function: Workloads are pigeonholed into one of four regions as in Figure 7, according to their current request rate, latency, and SLA goals. Region names are mostly self-explanatory--lucky workloads are getting a higher throughput while meeting the latency goal, and exceeded workloads get higher throughput at the expense of high latency.
Many objective functions can be accommodated by the current CHAMELEON
prototype (e.g., all linear functions); moreover, it is possible to
switch them on
the fly. For our experiments, we minimized
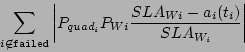
|
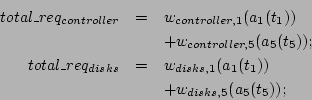
Constraints:
Constraints are represented as inequalities: the latency of a workload
should be less than or equal to the value specified in the SLA. More
precisely, we are only interested in solutions that satisfy
![]() for all workloads
for all workloads ![]() running in the
system. We estimate the contribution of component
running in the
system. We estimate the contribution of component ![]() to the latency
of
to the latency
of ![]() by composing our models in the knowledge base, i.e.,
by composing our models in the knowledge base, i.e.,
![]() .
.
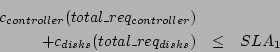
For example, the latency constraint for a single workload ![]() running in the system with its I/O requests being served by a storage
controller followed by physical disks is
running in the system with its I/O requests being served by a storage
controller followed by physical disks is
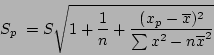
There are multiple ways of capturing statistical confidence
values [14]. CHAMELEON uses the following formula to capture both the
errors from regression and from residuals (i.e., models being used on
inputs where they were not trained):
The system designer defines heuristics for coarse-grained throttling control. Heuristics are used to make decisions whenever the predictions of the models cannot be relied upon--either during bootstrapping or after significant system changes such as hardware failures. Sample heuristics include ``if system utilization is greater than 85%, start throttling workloads in the lucky region'', or ``if the workload-priority variance is less than 10%, uniformly throttle all workloads sharing the component''.
These heuristics can be expressed in a variety of ways such as Event-Condition-Action (ECA) rules or hard-wired code. In any case, fully specifying corrective actions at design time is an error-prone solution to a highly complex problem [25], especially if they are to cover a useful fraction of the solution space and to accommodate priorities. It is also very hard to determine accurate threshold values to differentiate different scenarios, in the absence of any solid quantitative information about the system being built. In CHAMELEON, the designer-defined heuristics are implemented as simple hard-wired code which is a modified version of the throttling algorithm used in Sleds [7]:
1. Determine the ![]() of components being used by the
underperforming workload.
of components being used by the
underperforming workload.
2. For each component in the ![]() , add the non-underperforming
workloads using it to the
, add the non-underperforming
workloads using it to the ![]() .
.
3. Sort the ![]() first by
current operating quadrant: lucky first, then exceed, then
meet. Within each quadrant, sort by workload priority.
first by
current operating quadrant: lucky first, then exceed, then
meet. Within each quadrant, sort by workload priority.
4. Traverse the ![]() and
throttle each workload, either uniformly or proportionally to its
priority (the higher the priority, the less significant the throttling).
and
throttle each workload, either uniformly or proportionally to its
priority (the higher the priority, the less significant the throttling).
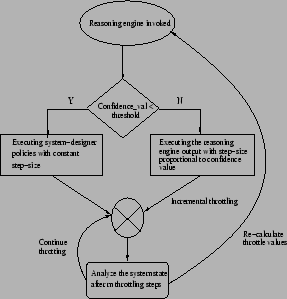
The feedback module (Figure 8) incrementally throttles workloads based on the decisions of either the reasoning engine or the system-designer heuristics. If CHAMELEON is following the reasoning engine, throttling is applied at incremental steps whose size is proportional to the confidence value of the constraint solver; otherwise, the throttling step is a small constant value.
After every ![]() throttling steps, the feedback module analyzes
the state of the system. If any of the following conditions is true,
it re-invokes the reasoning engine; otherwise it continues applying
the same throttling decisions in incremental steps:
throttling steps, the feedback module analyzes
the state of the system. If any of the following conditions is true,
it re-invokes the reasoning engine; otherwise it continues applying
the same throttling decisions in incremental steps:
The key capability of CHAMELEON is to regulate resource load so that SLAs are achieved. The experimental results use numerous combinations of synthetic and real-world request streams to evaluate the effectiveness of CHAMELEON. As expected, synthetic workloads are easier to handle compared to their real-world counterparts that exhibit burstiness and highly variable access characteristics.
These tests serve two objectives. First, they evaluate the correctness of the decisions made by the constraint solver. Throttling decisions should take into account each workload's priority, its current operating point compared to the SLA, and the percentage of load on the components generated by the workload. Second, these tests quantify the effect of model errors on the output values of the constraint solver and how incremental feedback helps the system converge to an optimal state.
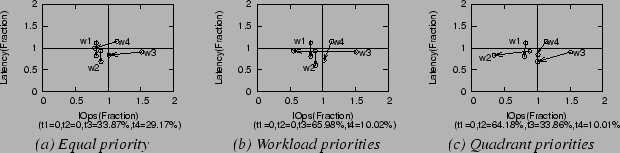
We report experimental results by showing each workload's original and new (i.e., post-throttling) position in the classification chart, as defined in Figure 7.
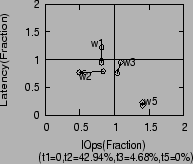
This test is a sanity check with workload ![]() operating primarily
from the controller cache (2KB sequential read requests). Because
operating primarily
from the controller cache (2KB sequential read requests). Because ![]() does not consume disk
bandwidth, the reasoning engine should not attempt to solve solve the
SLA violation for
does not consume disk
bandwidth, the reasoning engine should not attempt to solve solve the
SLA violation for ![]() by throttling
by throttling ![]() even if
even if
![]() has the lowest priority. As shown in Figure 10,
the reasoning engine selects
has the lowest priority. As shown in Figure 10,
the reasoning engine selects ![]() and
and ![]() .
.
For these experiments, we replay the web-search SPC trace [21] and HP's Cello96 trace [11]. Both are block-level traces with timestamps recorded for each I/O request. We use approximately 6 hours of SPC and one day of Cello96. To generate a reasonable I/O load for the storage infrastructure, SPC was replayed 40 times faster and Cello96 was replayed 10 times faster.
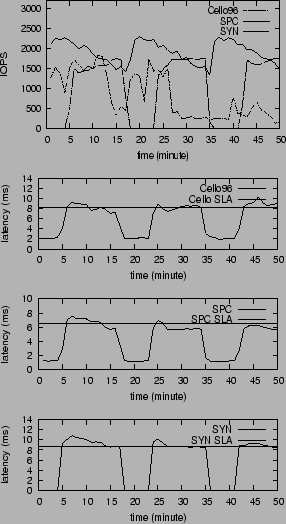
In addition to the traces, we used a phased, synthetic workload was used; this workload was assigned the highest priority. In an uncontrolled case i.e. without throttling, with three workloads running on the system, one or more of them violate their SLA. Figure 11 shows the throughput and latency values for uncontrolled case. For all the figures in this subsection, there are four parts (ordered vertically): the first plot represents the throughput for the SPC, Cello96, and the synthetic workload. The second, third, and fourth plots represent the latency for each of these workloads respectively.
The aim of the tests is to evaluate the following:
For these experiments, the models were reasonably accurate (component
![]() , workload
, workload ![]() , and action
, and action ![]() ).In addition, the SLAs
for each workload are: Cello96 1000 IOPS with 8.2ms latency,
SPC 1500 IOPS with 6.5 ms latency and 1600 IOPS with 8.6ms latency
for the synthetic workload unless otherwise specified.
).In addition, the SLAs
for each workload are: Cello96 1000 IOPS with 8.2ms latency,
SPC 1500 IOPS with 6.5 ms latency and 1600 IOPS with 8.6ms latency
for the synthetic workload unless otherwise specified.
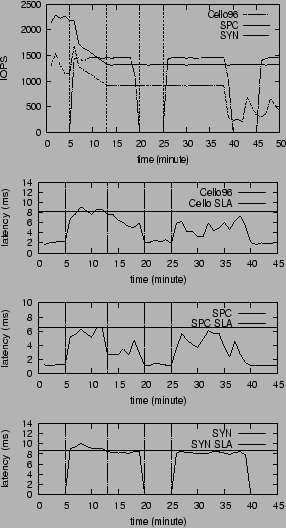 |
Phase 0 (t=0 to t=5 min): Only the SPC and Cello96 traces are running on the system; the latency values of both these workloads are significantly below the SLA.
Phase 1 (t= 5 min to t= 13 min): The phased synthetic workload is introduced in the system. This causes an SLA violation for the Cello96 and synthetic traces. CHAMELEON triggers the throttling of the SPC and Cello96 workloads (Cello96 is also throttled because it is operating in the exceeded region, means it is sending more than it should. Therefore, it is throttled even if its SLA latency goal is not met.) The system uses a feedback approach to move along the direction of the output of the constraint solver. In this experiment, the feedback system starts from 30% of the throttling value and uses step size is 8% (30% and 8% are decided according to the confidence value of the models). It took the system 6 minutes to meet the SLA goal and stop the feedback.
Phase 2 (t=13 min to t= 20 min ): The system stabilizes after the throttling and all workloads can meet their SLAs.
Phase 3 (t=20 min to t= 25 min ): The synthetic workload enters the OFF phase. During this time, the load on the system is reduced, but the throughput of Cello96 and SPC remains the same.
Phase 4 ( beyond t= 25 min): The system is stable, with all the workloads meeting their SLAs. As a side note, around t=39 min the throughput of Cello96 decreases further; this is because of characteristics of the trace.
Figure 12 shows the effectiveness of the throttling: all workloads can meet their SLA after throttling. However, because the lack of an unthrottling scheme, throttled workloads have no means to increase their throughput even when tokens are released by other workloads. Therefore, the system is underutilized.
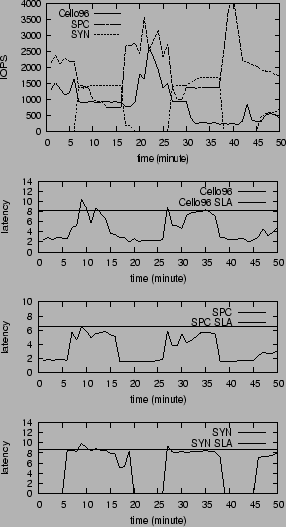 |
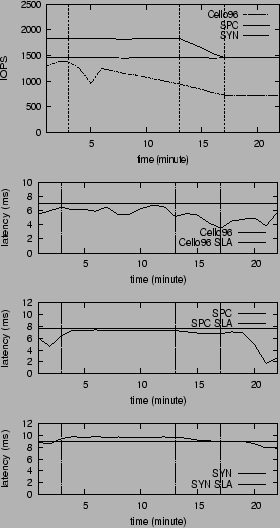
This test demonstrates how CHAMELEON handles changes in the confidence values of the models at run-time; these changes can be due to unpredictable system variations (hardware failures) or un-modeled properties of the system (such as changes in the workload access characteristics that change the workload models). It should be noted that refining the models to reflect the changes will not be instantaneous; in the meantime, CHAMELEON should have the ability to detect decreases in the confidence value and switch to a conservative management mode (e.g., using designer-defined policies, or generate a warning for a human administrator).
Figure 14 show the reaction of the system when the access characteristics of the SPC and Cello96 workloads are synthetically changed such that the cache hit rate of Cello96 increases significantly (in reality, a similar scenario arise due to changes in the cache allocation to individual workload streams sharing the controller) and the SPC is doing more random access (sequential random ratio increases from 0.11 to 0.5). In the future, we plan to run experiments with hardware failures induced on the RAID 1 logical volume.
The SLAs used for this test are: Cello96 has a SLA with 1000 IOPS with 7ms latency, SPC is 2000 IOPS with 8.8ms latency and the synthetic workloads has a SLA with 1500 IOPS and 9ms latency.
Phase 0 (at t= 3 mins): The synthetic workload violates its latency SLA. In response, CHAMELEON decides to throttle the Cello96 workload (using the original workload model). The output of the reasoning engine as a confidence value of 65%
Phase 1 (t= 3 min to t = 13 min): The feedback module continues to throttle for 3 consecutive increments; since the latency of the synthetic workload does not change, it re-invokes the reasoning engine. The output of the reasoning engine is similar to the previous invocation (since the models haven`t changed), but its confidence value is lower (because of the higher differences between predicted and observed model values). This repeats for consecutive invocations of the reasoning engine after which the feedback module switches to use the designer-defined policies.
Phase 2 (t= 13 min to t=17 min): A simple designer policy the CHAMELEON uses is to throttle all the non-violating workloads uniformly (uniform pruning). Both SPC and Cello96 are throttled in small steps (5% of their SLA IOPS) till the latency SLA of the synthetic workload is satisfied.
Phase 3 (beyond t= 17min): All workloads are meeting their SLA goals and the system is stabilized.
Most storage management frameworks (including all commercial tools, e.g., BMC Patrol [4]) encode policies as ECA rules [27,13] that fire when some precondition is satisfied--typically, when one or more system metrics cross predetermined thresholds. Rules are a clumsy, error-prone programming language; they front-load all the complexity into the work of creating them at design time, in exchange for simplicity of execution at run time. Administrators are expected to account for all relevant system states, to know which corrective action to take in each case, to specify useful values for all the thresholds that determine when rules will fire, and to make sure that the right rule will fire if preconditions overlap. Moreover, simple policy changes can translate into modifications to a large number of rules. Rule-based systems are only as good as the human who wrote the rules; they can just provide a coarse level of control over the system. Some variations rely on case-based reasoning [28] to iteratively refine rules from a tabula rasa initial knowledge base. This approach does not scale well to real systems, because of the exponential size of the search space that is explored in an unstructured way. In contrast, CHAMELEON relies on constrained optimization to steer the search in the full space of throttle values, and uses its dynamically refined models in lieu of fixed thresholds.
Feedback-based approaches use a narrow window of the most recent performance samples to make allocation decisions based on the difference between the current and desired system states. They are not well-suited for decision-making with multiple variables [22], and can oscillate between local optima. Façade [19] controls the queue length at a single storage device; decreasing the queue length is equivalent to throttling the combination of all workloads, instead of (as in CHAMELEON) selectively throttling only the workloads that will minimize the objective function. Triage [17] keeps track of which performance band the system is operating in; it shares Façade's lack of selectivity, as a single QoS violation may bring the whole system down to a lower band (which is equivalent to throttling every workload). Sleds [7] can selectively throttle just the workloads supposedly responsible for the QoS violations, and has a decentralized architecture that scales better than Façade's. However, its policies for deciding which workload to throttle are hard-wired and will not adapt to changing conditions. Hippodrome [3] iteratively refines the data placement; each of its data migrations can take hours. It is a solution to longer-term problems than CHAMELEON, that is more appropriate for reacting in minutes to problems requiring immediate attention. Hippodrome can take a long time to converge (due to the high cost of migrating data) and can get stuck in local minima, for it relies on a variation of hill-climbing.
Scheduling-based approaches establish relative priorities between workloads and individual I/Os. Jin et al. [15] compared different scheduling algorithms for performance isolation and resource-usage efficiency; they found that scheduling is effective but cannot ensure tight bounds on the SLA constraints (essential for high-priority workloads). Stonehenge [12] uses a learning-based bandwidth allocation mechanism to map SLAs to virtual device shares dynamically; although it allows more general SLAs than CHAMELEON, it can only arbitrate accesses to the storage device, not to any other bottleneck component in the system. In general, scheduling approaches are designed to work well for the common case, not being effective in handling exception scenarios such as hardware failures.
Model-based approaches make decisions based on accurate models of the storage system. The main challenge is to build them, far from trivial in practical systems; system administrators very rarely have that level of information about the devices they use. Minerva [1] assumes that such models are given. CHAMELEON and Polus [25] (an extension of this vision) build those models on the fly, without supervision.
An ideal solution for resource arbitration in shared storage systems would adapt to changing workloads, client requirements and system conditions. It would also relieve system administrators from the burden of having to specify when to step in and take corrective action, and what actions to take--thus allowing them to concentrate on specifying the global objectives that maximize the storage utility's business benefit, and having the system take care of the details. No existing solution satisfies these criteria; prior approaches are either inflexible, or require administrators to supply up-front knowledge that is not available to them.
Our approach to identifying which client workloads should be throttled is based on constrained optimization. Constraints are derived from the running system, by monitoring its delivered performance as a function of the demands placed on it during normal operation. The objective function being optimized can be defined, and changed, by the administrator as a function of organizational goals. Given that the actions prescribed by our reasoning engine are only as good as the quality of the models used to compute them, CHAMELEON will switch to a conservative decision-making process if insufficient knowledge is available. CHAMELEON's approach to model building requires no prior knowledge about the quantitative characteristics of workloads and devices--and makes good decisions in realistic scenarios like those involving workloads with relative priorities. We replayed traces from production environments on a real storage system, and found that CHAMELEON makes very accurate decisions for the workloads examined. CHAMELEON always made the optimal throttling decisions, given the available knowledge. The times to react to and solve performance problems were in the 3-14 min. range, which is quite encouraging.
Areas for future work include component and workload models that incorporate additional relevant parameters, more general (non-linear) optimizers to accommodate the resulting, more accurate problem formulations, and even some degree of workload prediction using techniques related to ARIMA [23].
Acknowledgments: We wish to thank Randy Katz, Jai Menon, Kaladhar Voruganti and Honesty Young for their inputs on the direction of this work and valuable comments on earlier versions of this paper. We also thank Lucy Cherkasova for her excellent shepherding. Finally, we thank the HP Labs Storage Systems Department for making their traces available to the general public.
This document was generated using the LaTeX2HTML translator Version 2002-2-1 (1.70)
Copyright © 1993, 1994, 1995, 1996,
Nikos Drakos,
Computer Based Learning Unit, University of Leeds.
Copyright © 1997, 1998, 1999,
Ross Moore,
Mathematics Department, Macquarie University, Sydney.
The command line arguments were:
latex2html -split 0 -show_section_numbers -local_icons paper.tex
The translation was initiated by Li Yin on 2005-02-17
|
This paper was originally published in the
Proceedings of the 2005 USENIX Annual Technical Conference,
April 10–15, 2005, Anaheim, CA, USA Last changed: 2 Mar. 2005 aw |
|