All the experiments were performed on an HP x4000 Workstation with a 1.7 GHz Intel Xeon processor, 2 GB RAM, Intel e100 PRO/100 network interface, and Maxtor 40GB 7200 RPM IDE disk. For these measurements, we used the XenoLinux port based on Linux 2.6.8.1 and Xen 2.0.
The first group of experiments relates to web server performance. Among the industry standard benchmarks that are used to evaluate web server performance are the SPECweb'96 [6] and SPECweb'99 [7] benchmarks. The web server performance is measured as a maximum achievable number of connections per second supported by a server when retrieving files of various sizes. Realistic web server workloads may vary significantly in both their file mix and file access pattern. The authors of an earlier study [5] established the web server performance envelope: they showed that under a workload with a short file mix the web server performance is CPU bounded, while under a workload with a long file mix the web server performance is network bounded.
To perform a sensitivity study of the CPU overhead in Domain0 caused by different web traffic, we use Apache HTTP server version 2.0.40 running in the guest domain, and the httperf tool [4] for sending the client requests. The httperf tool provides a flexible facility for generating various HTTP workloads and for measuring server performance. In order to measure the request throughput of a web server, we invoke httperf on the client machine, which sends requests to the server at a fixed rate and measures the rate at which replies arrive. We run the tests with monotonically increasing request rates, until we see that the reply rate levels off and the server becomes saturated, i.e., it is operating at its full capacity. In our experiments, the http client machine and web server are connected by a 100 Mbit/s network.
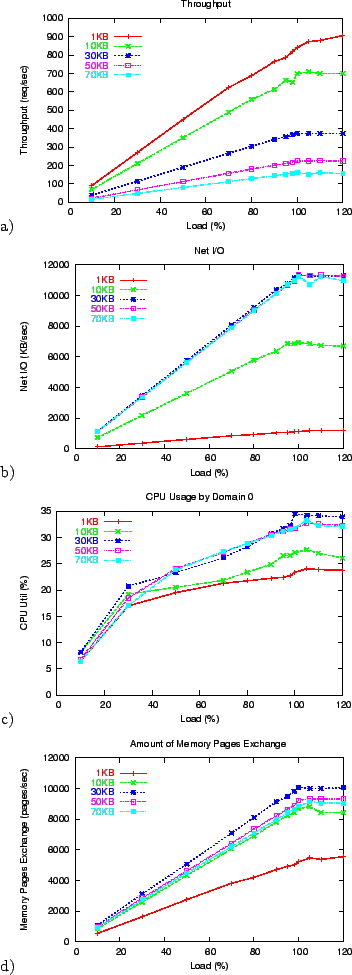
We created a set of five simple web server workloads, each retrieving a fixed size file: 1 KB, 10 KB, 30 KB, 50 KB, and 70 KB. Our goal is to evaluate the CPU overhead in Domain0 caused by these workloads. Figure 1 summarizes the results of our experiments.
Figures 1 a), b) show the overall web server
performance under the studied workloads. To present all the workloads on
the same scale, we show the applied load expressed as a percentage of
maximum achieved throughput. For example, the maximum throughput
achieved under a workload with a 1 KB file size is 900 req/s. Thus the
point on the graph with X axis of 100% reveals 900 req/s throughput
shown on the Y axis. Similarly, the maximum throughput achieved under a
workload with 70 KB file size is 160 req/s, and this point corresponds
to 100% of applied load. Figure 1 b) presents the
amount of performed network I/O in KB/s as reported by the httperf
tool. These measurements combine the HTTP requests (80 bytes long) and
the HTTP responses (that include 278 bytes HTTP headers and the
corresponding file as content). Figure 1 b)
reveals that web server throughput is network bounded for workloads
of 30-70 KB files due to network bandwidth being limited to
100Mb/s (12.5 MB/s). Another interesting feature of these workloads
is apparent from Figure 1 b): the amount of
transferred network I/O is practically the same for workloads of
30-70 KB files (30KB![]() 380 req/s
380 req/s ![]() 50KB
50KB![]() 225 req/s
225 req/s ![]() 70KB
70KB![]() 160 req/s).
160 req/s).
Figure 1 c) shows the measured CPU usage by Domain0 for each of the corresponding workloads. The CPU usage by Domain0 increases with a higher load, reaching 24% for the workload of 1 KB files and peaking at 33-34% for workloads of 30-70 KB files. Measurements presented in Figure 1 c) answer one of our questions about the amount of CPU usage in Domain0 that is caused by device driver processing for web server related workloads. The measured CPU usage presents a significant overhead, and thus should be charged to the virtual machine causing this overhead.
Our monitoring tool measures the number of memory page
exchanges performed per second over time. Figure 1 d)
presents the rates of memory page exchanges between Domain0 and
the corresponding guest domain. At first glance, these numbers look
surprising, but under more careful analysis, they all make
sense. While the memory pages are 4 KB, a single memory page
corresponds to a network packet transfer whether it is a SYN,
or SYN-ACK, or a packet with the HTTP request. Thus network
related activities for an HTTP request/response pair for a 1 KB file
require at least 5 TCP/IP packets to be transferred between the client
and a web server. Thus, processing 1000 requests for a 1 KB file
translates to ![]() 5000 TCP/IP packets and the corresponding
rates of memory page exchanges.
5000 TCP/IP packets and the corresponding
rates of memory page exchanges.
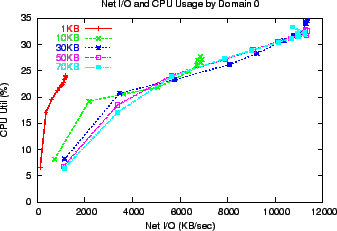 |
Figure 2 presents the CPU usage by Domain0 versus the amount of network I/O traffic transferred to/from a web server during the the corresponding workload. Often, the expectations are that the CPU processing overhead can be predicted from the number of transferred bytes. In the case of high volume HTTP traffic requesting small files, the small size transfers are ``counter-balanced'' by the high number of interrupts corresponding to the processing of the web requests. While the amount of transferred data is relatively small for the 1 KB file workload, it results in high CPU processing overhead in Domain0 due to the vastly higher number of requests (10-20 times) for the corresponding workload as shown in Fig. 2.
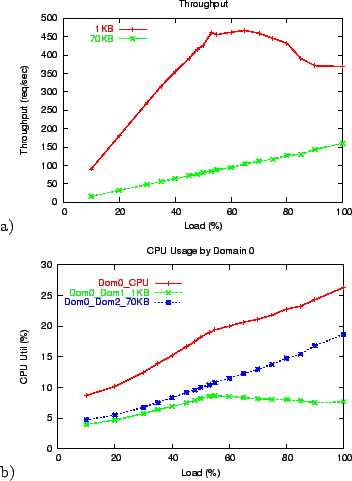 |
To complete our web server case study, we run Xen with two guest domains configured with equal resource allocations, where each guest domain runs an Apache web server. Using the httperf tool, we designed a new experiment where requests that are sent to a web server in Domain1 retrieve 1 KB files, and the requests sent to a web server in Domain2 retrieve 70 KB files. In these experiments, we use the same request rates as in a single guest domain case. Our goal is to evaluate the CPU overhead in Domain0 caused by these workloads, as well as present the parts of this overhead attributed to Domain1 and Domain2.
Figure 3 a) presents throughput achieved for both web servers under the applied workloads. It shows that a web server running in Domain1 and serving 1 KB file workload is able to achieve 50% of the throughput achieved by a web server running in a single guest domain (see Figure 1 a). Interestingly, a web server running in Domain2 and serving 70 KB file workload is able to achieve almost 100% of its throughput compared to the single guest domain case. This is because the performance of a web server handling a 70 KB file workload is network bounded, not CPU bounded. In the designed experiment, it can use most of the available network bandwidth, since the ``competing'' 1 KB file workload is CPU bounded and has network bandwidth requirements that are 70 times lower.
Figure 3 b) shows the measured CPU usage by Domain0 and the portions attributed to Domain1 and Domain2. For example, under 100% of applied load, the CPU usage by Domain0 is 26.5%, where Domain1 is responsible for 7.5% and Domain2 accounts for the remaining 19% of it. Thus, it is important to capture the additional CPU overhead caused by the I/O traffic in Domain0, and accurately charge it to the domain causing this traffic.
The second group of experiments targets the disk I/O traffic in order
to evaluate the CPU usage in Domain0 caused by this traffic. We
use the dd command to read 500, 1000, 5000, and 10000 blocks of
size 1024 KB from the ``raw'' disk. Table 1
summarizes the measurements collected during these experiments.
We repeated the same set of experiments for a disk device that is
mounted as a file system. Table 2 summarizes
the results collected for the new set of experiments.
The transfer time is practically unchanged and again is directly
proportional to the transferred amount of data. The achieved disk
bandwidth is similar to the first set of experiments.
To quantify the overhead introduced by our instrumentation and performance monitor, we repeated all the experiments for the original Xen 2.0. The performance results for the instrumented and non-instrumented, original version of Xen 2.0 are practically indistinguishable.
In our future work, we intend to design a set of resource allocation policies that take this CPU overhead into account.